ITS Transit Standards Professional Capacity Building Program
Module 1: Introduction to Intelligent Transportation Systems (ITS) Transit Standards
HTML of the PowerPoint Presentation
(Note: This document has been converted from a PowerPoint presentation to 508-compliant HTML. The formatting has been adjusted for 508 compliance, but all the original text content is included, plus additional text descriptions for the images, photos and/or diagrams have been provided below.)
Slide 1:
(Extended Text Description: Welcome - Graphic image of introductory slide. A large dark blue rectangle with a wide, light grid pattern at the top half and bands of dark and lighter blue bands below. There is a white square ITS logo box with words "Standards ITS Training" in green and blue on the middle left side. The word "Welcome" in white is to the right of the logo. Under the logo box is the logo for the U.S. Department of Transportation, Office of the Assistant Secretary for Research and Technology.)
Slide 2:
(Extended Text Description: This slide, entitled "Welcome" has a photo of Ken Leonard, Director, ITS Joint Program Office, on the left hand side, with his email address, Ken.Leonard@dot.gov. A screen capture snapshot of the home webpage is found on the right hand side - for illustration only - from August 2014. Below this image is a link to the current website: www.its.dot.gov/pcb - this screen capture snapshot shows an example from the Office of the Assistant Secretary for Research and Development - Intelligent Transportation Systems Joint Program Office - ITS Professional Capacity Building Program/Advanced ITS Education. Below the main site banner, it shows the main navigation menu with the following items: About, ITS Training, Knowledge Exchange, Technology Transfer, ITS in Academics, and Media Library. Below the main navigation menu, the page shows various content of the website, including a graphic image of professionals seated in a room during a training program. A text overlay has the text Welcome to ITS Professional Capacity Building. Additional content on the page includes a box entitled What's New and a section labeled Free Training. Again, this image serves for illustration only. The current website link is: https://www.its.dot.gov/pcb.)
Slide 3:
ITS Transit Standards Professional Capacity Building Program
Module 1:
Introduction to Intelligent Transportation Systems (ITS) Transit Standards
Bruce Eisenhart
Slide 4:
Slide 5:
Instructor
Bruce S. Eisenhart
Vice President, Operations
Consensus Systems Technologies
Centreville, VA, USA
Slide 6:
Target Audience
- Transit management staff;
- Transit planning, operations, and maintenance staff;
- Transit procurement staff;
- Transit ITS staff;
- Transit ITS contractors and consultants;
- Transit technology vendors;
- Vehicle manufacturers; and
- Transit IT staff.
Slide 7:
Recommended Prerequisite(s)
None. This is the Introductory Module in the series of Transit Standards modules.
Slide 8:
Curriculum Path (Decision-maker)
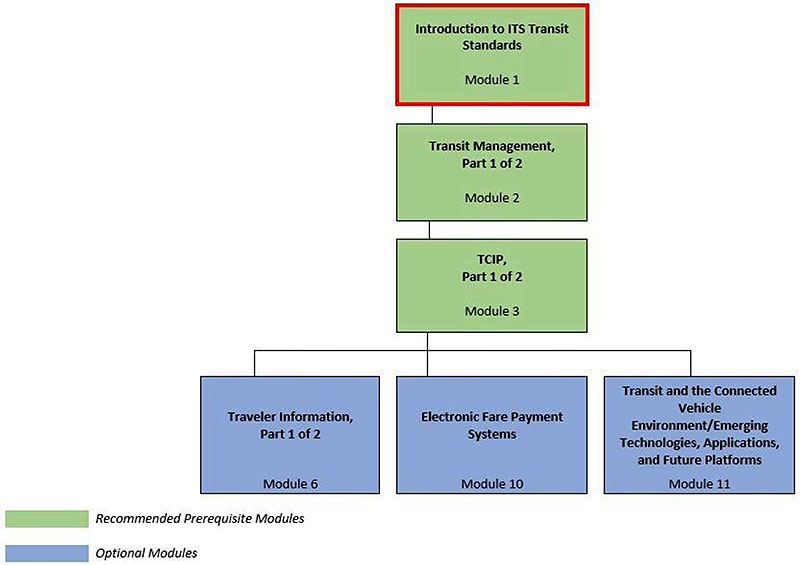
(Extended Text Description: Curriculum Path for Decision Maker. A graphical illustration indicating the sequence of training modules and where this module fits in. Each module is represented by a box with the name of the module in it and a flow chart showing the logical flow of the modules with the current module boxed in red. The first three boxes are green and aligned horizontally, green signifying "Recommended Pre-requisites." The first box is "Introduction to ITS Transit Standards, Module 1", which is outlined in red. Below that, connected by a line, is a box with the text "Transit Management, Part 1 of 2." Below that, connected by a line, is a box with the text, "TCIP, Part 1 of 2." From here, the lines branch out into three text boxes that are horizontally sequenced and are in blue, signifying "Optional Modules." These three boxes are: "Traveler Information, Part 1 of 2", "Electronic Fare Payment Systems," and "Transit and the Connected Vehicle Environment/Emerging Technologies, Applications, and Future Platforms.")
Slide 9:
Curriculum Path (Project Manager)
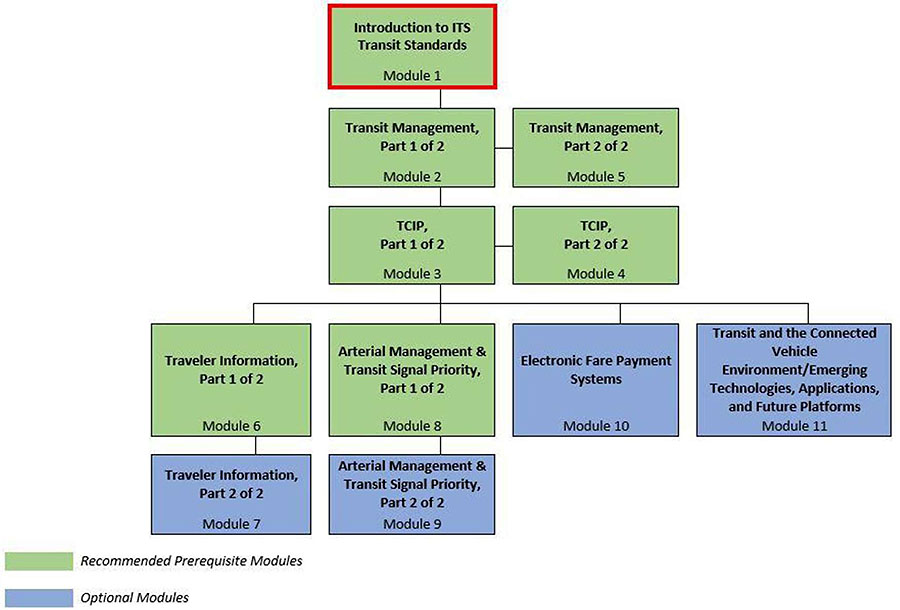
(Extended Text Description: Curriculum Path for Project Manager. A graphical illustration indicating the sequence of training modules and where this module fits in. Each module is represented by a box with the name of the module in it and a flow chart showing the logical flow of the modules with the current module boxed in red. The first three horizontally sequenced boxes are green. The first box is "Introduction to ITS Transit Standards, Module 1", which is outlined in red. Below that, connected by a line, is a box with the text "Transit Management, Part 1 of 2." To the right of this box, is "Transit Management, Part 2 of 2". Below that "Transit Management, Part 1 of 2", connected by a line, is a box with the text, "TCIP, Part 1 of 2." To the right of this box, is "TCIP, Part 2 of 2." From here, the lines branch out into four text boxes that are horizontally sequenced. The first two: "Traveler Information, Part 1 of 2" and "Arterial Management & Transit Signal Priority, Part 1 of 2" are green; the last two are "Electronic Fare Payment Systems," and "Transit and the Connected Vehicle Environment/Emerging Technologies, Applications, and Future Platforms." Below "Traveler Information, Part 1 of 2," is the text box "Traveler Information, Part 2 of 2" coded in blue. Below "Arterial Management & Transit Signal Priority, Part 1 of 2", is the text box "Arterial Management & Transit Signal Priority, Part 2 of 2," coded in blue. )
Slide 10:
Curriculum Path (Project Engineer)
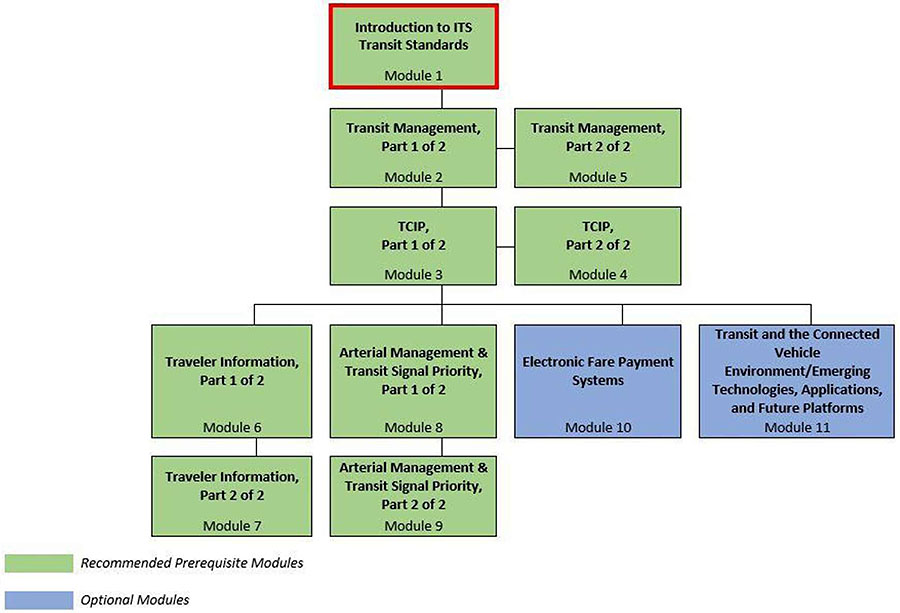
(Extended Text Description: Curriculum Path for Project Engineer A graphical illustration indicating the sequence of training modules and where this module fits in. Each module is represented by a box with the name of the module in it and a flow chart showing the logical flow of the modules with the current module boxed in red. The first three horizontally sequenced boxes are green. The first box is "Introduction to ITS Transit Standards, Module 1", which is outlined in red. Below that, connected by a line, is a box with the text "Transit Management, Part 1 of 2." To the right of this box, is "Transit Management, Part 2 of 2". Below that "Transit Management, Part 1 of 2", connected by a line, is a box with the text, "TCIP, Part 1 of 2." To the right of this box, is "TCIP, Part 2 of 2." From here, the lines branch out into four text boxes that are horizontally sequenced. The first two: "Traveler Information, Part 1 of 2" and "Arterial Management & Transit Signal Priority, Part 1 of 2" are green; the last two are "Electronic Fare Payment Systems," and "Transit and the Connected Vehicle Environment/Emerging Technologies, Applications, and Future Platforms." Below "Traveler Information, Part 1 of 2," is the text box "Traveler Information, Part 2 of 2" coded in green. Below "Arterial Management & Transit Signal Priority, Part 1 of 2", is the text box "Arterial Management & Transit Signal Priority, Part 2 of 2," coded in green.)
Slide 11:
Learning Objectives
- Define ITS transit standards and examine the benefits and costs of using ITS transit standards
- Introduce the use of the Systems Engineering Process (SEP) and articulate benefits of SEP in ITS transit projects
- Define high level technical and institutional challenges
- Identify the role of ITS Standards in Transit ITS applications
- Describe Roadmap for Transit Standards Modules
Slide 12:
Learning Objective #1: Define ITS Transit Standards and Examine the Benefits and Costs of Using ITS Transit Standards
- What are ITS transit standards?
- Standards development process
- Benefits of using standards as part of transit deployments
- Costs of using (or not using)
Slide 13:
Learning Objective #1
What are ITS Transit Standards?
-
What is a standard?
-
Established norm or requirement about technical systems that establishes:
- Uniform engineering or technical criteria, methods, processes, and practices
-
Established norm or requirement about technical systems that establishes:
-
What are Intelligent Transportation Systems (ITS) Standards?
- Defines how ITS systems, products, and components can interconnect, exchange information, and interact to deliver services within a transportation network
-
Types of ITS Standards
- Data transferred on an interface
- Communications protocols used to send data
- Hardware definition
Slide 14:
Learning Objective #1
Standards Development Process
Standards Development Organizations (SDO)
- Voluntary
- Consensus based
- Open
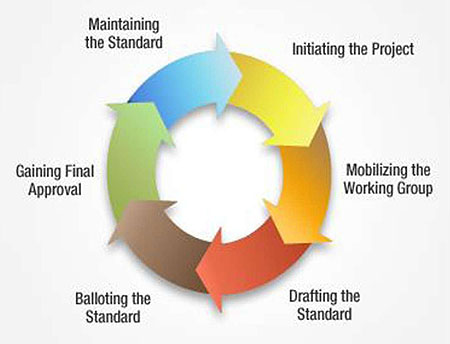
(Extended Text Description: A graphic showing how standards are developed by Standards Development Organizations (SDOs). Six arrows making a complete circle signifying the following: Initiating the Project, Mobilizing the Working Group, Drafting the Standard, Balloting the Standard, Gaining Final Approval, Maintaining the Standard.)
Slide 15:
Learning Objective #1
Benefits of Using Standards
- Facilitates regional interoperability
- Supports compliance to Federal Transit Agency (FTA) Policy on ITS Architecture and Standards
- Facilitates systems integration
- Reduces future integration costs
- Reduces operating and maintenance costs
- Easier to apply boilerplate specifications and copy similar procurements from other agencies
Slide 16:
Learning Objective #1
Benefits - Interoperability
-
The ability of an ITS system to:
- Provide information and services to other systems
- Use exchanged information and services to operate together effectively
- Analogy: home theater system
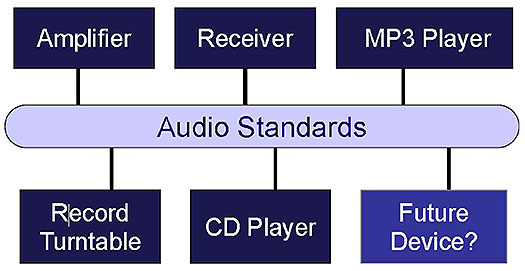
(Extended Text Description: A graphic showing how an audio system works to illustrate the property of interoperability. The graphic shows how audio standards connect an Amplifier, a Receiver, and an MP3 Player above the standards icon and Record Turntable, CD Player and Future Device below the standards icon. )
Slide 17:
Learning Objective #1
Interoperability in Transit
-
The interoperability with standards support regional information sharing
- E.g. sharing of real-time bus information
-
Supports Code of Federal Regulations (CFR) 23 Rule 511 - Real-time System Management Information Program (RTSMIP)
- Requires states and metropolitan regions to collect and share real-time traffic and travel conditions
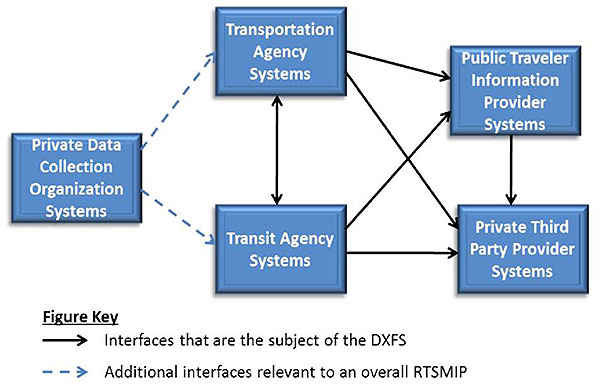
(Extended Text Description: A graphic showing the interfaces to transit agency systems described as part of the Real-time System Management Information Program (RTSMIP). The diagram is taken from the Data Exchange Format Specification (DXFS) document. The image shows a series of interconnected boxes. The key at the bottom shows a black line and arrow labeled "Interfaces that are the subject of the DXFS." A dotted blue line and arrow is labeled "Additional interfaces relevant to an overall RTSMIP." The first box on the left reads "Private Data Collection Organization Systems" which is connected by a blue dotted arrow to "Transportation Agency Systems" and by another blue dotted arrow to "Transit Agency Systems." "Transportation Agency Systems" is then connected via a bi-directional black arrow to "Transit Agency Systems." Both of those boxes are then connected by black arrows to "Public Traveler Information Provider Systems" and "Private Third Party Provider Systems." "Public Traveler Information Provider Systems" is also connected via a black arrow to "Private Third Party Provider Systems.")
Slide 18:
Learning Objective #1
Supports Compliance to FTA Policy on ITS Architecture and Standards
- FTA Policy enacted on January 8, 2001
- "Requires" a systems engineering analysis for ITS projects using highway trust funds
-
Seven requirements included in the Systems Engineering (SE) analysis (see supplemental materials)
- #6 states: Identification of applicable ITS standards and testing procedures
Slide 19:
Learning Objective #1
Facilitates Systems Integration
-
Standards facilitate integration of systems within an agency
- Between services (e.g. fixed route and paratransit)
- Between modes (e.g. bus and rail)
- Between departments (e.g. between operations and maintenance)
-
How is systems integration made easier?
- Data created by one part of the agency can be input and used directly by another part of the agency
- Removes the need for costly translation from one form to another
Slide 20:
Learning Objective #1
Reduces Costs for Integration and O&M
-
Reduced Integration Costs
- Not locked into proprietary systems
- Expansion is easier
- Still allows for innovation
- Reduced risk
- Increased flexibility
-
Reduced Operations and Maintenance (O&M) Costs
- Documented standards-based interfaces are easier to maintain and update
Slide 21:
Learning Objective #1
Simplifies Procurement
-
Easier to apply boilerplate specifications and copy similar procurements from other agencies
- Use of commonly deployed standards means that others have already gone through procurements using the standard
- They have created specifications and technical procurement packages
- Can borrow and customize for your particular procurement
- Lowers implementation risks
Slide 22:
Learning Objective #1
Costs Associated with Standards Use
-
Using ITS standards may have a cost
- Agency must do the upfront work to understand and define use of the standard but these costs will be offset by cost advantages for future upgrades and deployments
- Decision makers must support increased cost of extra time to support initial (upfront) development costs
-
Not using ITS standards will also have a cost
- Being locked into proprietary systems costs more for upgrades and additional deployments
Slide 23:

Slide 24:
Learning Objective #1
What are some benefits of using ITS Standards?
Answer Choices
- Facilitates regional interoperability
- Supports compliance to FTA Policy on ITS Architecture and Standards
- Facilitates systems integration
- All of the above
Slide 25:
Learning Objective #1
Review of Answers
 a) Facilitates regional interoperability
Incorrect. Including information sharing across agencies.
b) Supports compliance to FTA Policy on ITS Architecture and Standards
Incorrect. Identifying standards used is one part of policy requirement for systems engineering analysis.
c) Facilitates systems integration
Incorrect. Data created by one part of the agency can be input and used directly by another part of the agency.
 d) All of the above
Correct! Each of the above are key benefits of using standards.
Slide 26:
Summary of Learning Objective #1
Define ITS Transit Standards and Examine the Benefits and Costs of Using ITS Transit Standards
- ITS Standards define how ITS systems exchange information to deliver services within a transportation network
-
Using ITS Transit Standards
- Facilitates regional interoperability, which allows agencies to share information
- Supports compliance to FTA Policy on ITS Architecture and Standards
- However, the agency must do the upfront work to understand and define how the standard will be used.
Slide 27:
Learning Objective #2: Introduce the Use of the Systems Engineering Process (SEP) and Articulate Benefits of SEP in ITS Transit Projects
- Explain SEP and its benefits
- Recognize how standards fit into SEP
Slide 28:
Learning Objective #2
SEP and its Benefits
- Define Systems Engineering and explain the Systems Engineering Process (SEP)
- List key benefits of using SEP
- Discuss ITS Architectures- National and Regional
Slide 29:
Learning Objective #2
What is Systems Engineering?
- Interdisciplinary approach
- Structured development process
- Focuses on defining customer needs (business and technical) and required functionality
- Final design selected from alternatives that accomplish objectives and considers technical merits and costs
- Addresses the problem throughout the process
Slide 30:
Learning Objective #2
What is the "Vee" Model?
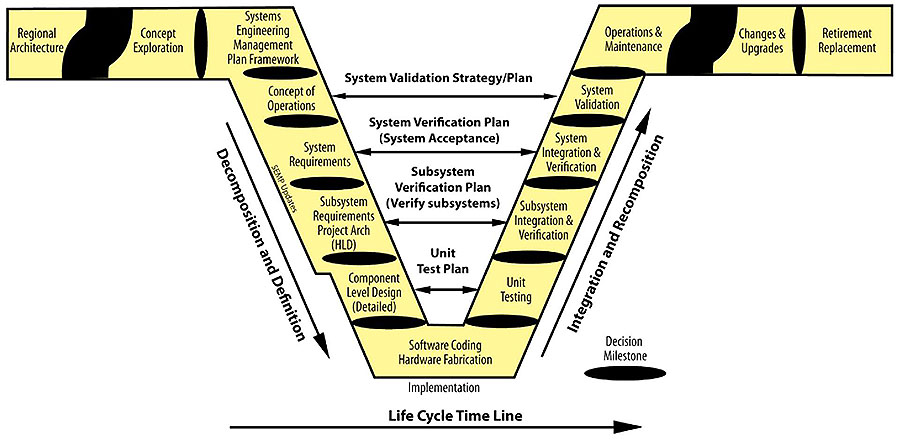
(Extended Text Description: A graphic of the Vee Diagram, which shows the life cycle of an ITS system. The Vee Diagram shows the steps in the Systems Engineering Process. These steps are: Regional ITS Architecture, Concept Exploration, Systems Engineering Management Plan Framework, Concept of Operations, System Requirements, Subsystem Requirements/ Project Architecture, Component Level (Detailed Design), Software Coding/ Hardware Fabrication, Unit Testing, Subsystem Integration & Testing, System Integration & Verification, System Validation, Operation & Maintenance, Changes & Upgrades, Retirement/ Replacement. The diagram also shows the connection between the left and right sides of the Vee. The left side of the Vee shows an arrow pointing down along the Vee labeled Decomposition and Definition. The bottom of the Vee show an arrow pointing left to right labeled Life Cycle Time Line. On the symmetrical opposite side going up the Vee is another arrow labeled Integration and Recomposition. In between each step is a Decision Milestone. Connecting the left side of the Vee to the right side of the Vee are various bidirectional arrows: Concept of Operations is connected via System Validation Strategy/Plan to System Validation. System Requirements is connected via System Verification Plan (System Acceptance) to System Integration & Verification. Subsystem Requirements Project Arch is connected via Subsystem Verification Plan (Verify Subsystems) to Subsystem Integration & Verification. Finally, Component Level Design is connected via Unit Testing Plan to Unit Testing.)
Slide 31:
Learning Objective #2
Connecting Left and Right Sides
- Vee symmetry reflects the relationship between the steps on the left and right
-
Definition generated on the left is ultimately used to verify the system on the right
- e.g., user needs and performance measures in ConOps are the basis for System Validation Plan
Slide 32:
Learning Objective #2
Detailed "Vee" Diagram with Relationship to Project Life Cycle
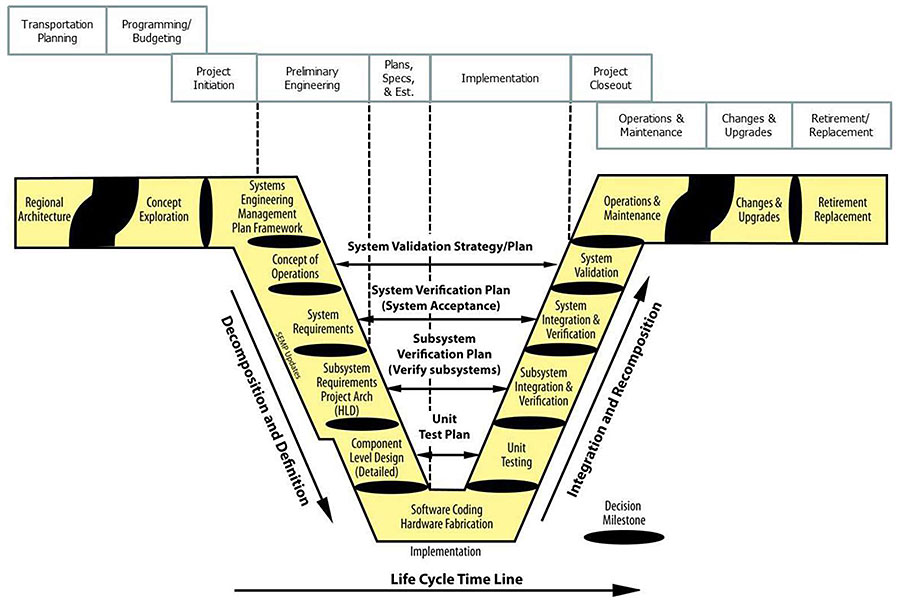
(Extended Text Description: This image shows the same Vee Diagram from slide 30, with an additional top graphic that runs horizontal across the Vee diagram, showing the traditional project development cycle with the following steps, in order: Transportation Planning, Programming/Budgeting, Project Initiation, Preliminary Engineering, Plans Specs & Estimates, Implementation, Project Closeout, Operations & Maintenance, Changes & Upgrades, and Retirement/ Replacement. The bottom portion of the diagram is the same Vee along with lines showing the connections between the two processes. Project Initiation connects with Systems Engineering Management Plan Framework, Preliminary Engineering covers from the previous point to the decision milestone after System Requirements, Plans Specs & Estimates covers from the previous point to the decision milestone after Component Level Design, and Implementation covers from the previous point to the decision milestone after System Validation.)
Slide 33:
Learning Objective #2
SEP Decision Points
-
Project reviews:
- Provide structured and organized approach to reviewing project products to determine if fit for intended use
- Are a primary method of communicating progress, monitoring risk, and transferring products and knowledge
- Often occur at completion of "Vee" process step
- Represent decision points that must be passed successfully before moving on to next step
- In addition to formal decision-point reviews, many less formal reviews may be conducted
Slide 34:
Learning Objective #2
Benefits of SEP
- Improve quality of products created by the project
- Reduce the risk of schedule and cost overruns
- Increase the likelihood that user needs will be met
- Improve stakeholder participation
- Provide better documentation
- Reduce operational costs
Slide 35:
Learning Objective #2
Regional ITS Architecture
- First step in the SEP, occurring before project initiation
-
Regional ITS Architecture is defined as:
- A regional framework for ensuring institutional agreement and technical integration for the implementation of ITS projects in a particular region" 1
-
Regional ITS Architecture is a plan for deployment of ITS in the region
- Used to support transportation planning and
- ITS project development
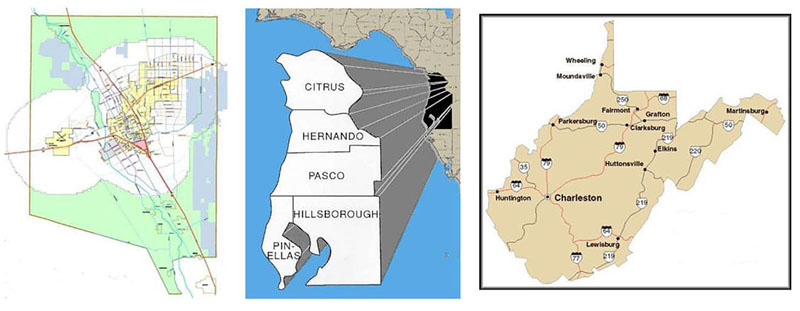
(Extended Text Description: For illustration purposes only: There are three graphics on the page showing examples of types of "Regions" used to create regional ITS architectures. The left diagram is of Mesilla Valley Metropolitan Planning Organization, the middle diagram is of Florida DOT District 7, and the right diagram is of the state of West Virginia.)
1 FTA Policy on Architecture and Standards, 2001
Slide 36:
Learning Objective #2
National ITS Architecture
- Provides a common framework for planning, defining, and integrating ITS.
-
The architecture defines:
- The functions that are required for ITS
- The physical entities or subsystems where these functions reside
- The information flows that connect these physical subsystems
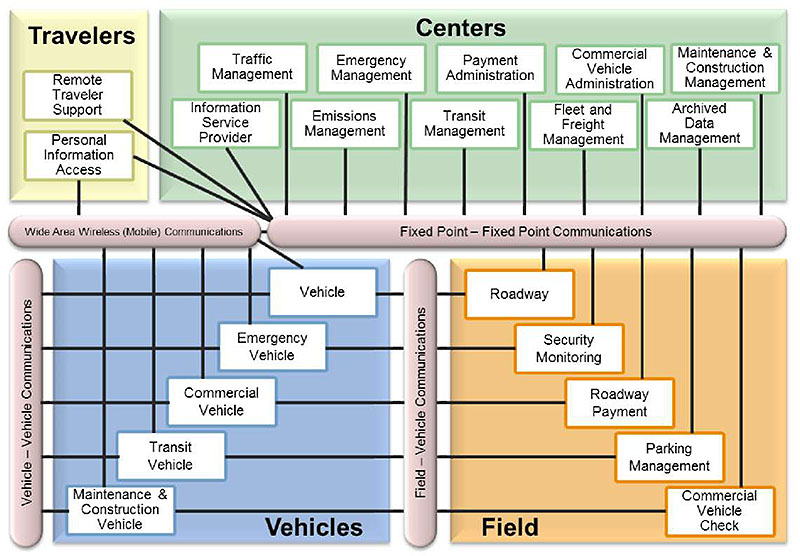
(Extended Text Description: Graphic of the "Sausage Diagram" diagram of the National ITS Architecture, which shows a high level interconnect diagram of the 22 subsystems of the National ITS Architecture. The diagram is divided into four main sections, with a series of connecting communications formats. In the upper left corner, the Travelers section (yellow background) has two sub-boxes within it: Remote Traveler Support (top, connected by a line to Fixed Point – Fixed Point Communications) and Personal Information Access (bottom, connected by a line to Wide Area Wireless (Mobile) Communications underneath and Fixed Point – Fixed Point Communications underneath and to the right). At the top right, the larger Centers section (green background) has two rows of sub-boxes within it. Top row, left to right: Traffic Management, Emergency Management, Payment Administration, Commercial Vehicle Administration, and Maintenance & Construction Management. Bottom row, left to right: Information Service Provider, Emissions Management, Transit Management, Fleet and Freight Management, and Archived Data Management. Every one of these sub-boxes under Centers is connected by a line to the Fixed Point – Fixed Point Communications box underneath the Centers section and to the right of the Wide Area Wireless (Mobile) Communications box (under Travelers section). To the lower left there is a Vehicles section (blue background) with a set of diagonally ascending sub-boxes within it (start lower left to the upper right of the box): Maintenance & Construction Vehicle, Transit Vehicle, Commercial Vehicle, Emergency Vehicle, and Vehicle. Each of these sub-boxes is connected by a line to the Wide Area Wireless (Mobile) Communications box above it, and to the vertically-running Vehicle-Vehicle Communications box to the left of the Vehicles section. To the lower right, there is a Field section (orange background) with a set of diagonally descending sub-boxes within it (from upper left to lower right): Roadway, Security Monitoring, Roadway Payment, Parking Management, and Commercial Vehicle Check. Each sub-box is connected by a line to the Fixed Point – Fixed Point Communications box above it, and to the vertically-running Field – Vehicle Communications box to the left (in between the Vehicles and Field sections). See Author Notes below for more information.)
View at https://www.iteris.com/itsarch/index.htm- content is no longer available.
Slide 37:
Learning Objective #2
How Standards Fit into SEP
- Standards to be used are defined as part of High Level Design (HLD)
- Key output of HLD is definition of Interfaces- where standards are used
- During Detailed Design the use of standards is fully defined via tailoring of the standards
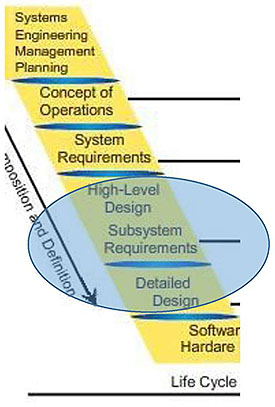
(Extended Text Description: Graphic shows the left side of the Vee diagram as described in Slide 30 with a shaded oval showing the two steps in the process where standards are defined and tailored. The two areas that are highlighted include High-Level Design Subsystem Requirements and Detailed Design.)
Slide 38:

Slide 39:
Learning Objective #2
What is the relationship between the steps on the left of the Vee and the right?
Answer Choices
- No relationship between left and right
- System definition on left used to verify system on right
- Items on the left are performed after items on right
Slide 40:
Learning Objective #2
Review of Answers
a) No relationship between left and right
Incorrect. There is a relationship between items on the left and items on the right.
b) System definition on left used to verify system on right
Correct! Definition generated on the left is ultimately used to verify the system on the right. See Slide 88.
c) Items on left performed after items on right
Incorrect. Items on the left are performed first and used to verify items on the right.
Slide 41:
Learning Objective #2
ITS Standards are typically first used in what step in the SE Process?
Answer Choices
- Concept of Operations
- Requirements
- Design - High Level and Detailed
- HW and SW development
Slide 42:
Learning Objective #2
Review of Answers
a) Concept of Operations
Incorrect. Defines user needs.
b) System Requirements
Incorrect. Defines functional, performance, and other requirements (may be able to pull requirements from standards).
c) Design- High Level and Detailed
Correct! Standards are identified in High Level Design and specified in Detailed Design.
d) HW and SW development
Incorrect. Implemented based on the standards defined.
Slide 43:
Summary of Learning Objective #2
Introduce the Use of the Systems Engineering Process (SEP) and Articulate Benefits of SEP in ITS Transit Projects
-
SEP for Transportation Projects—the Vee Diagram
- Project Planning and Concept of Operations
- System Requirements
- System Definition and Design
- System Development and Implementation
- Integration, Testing, and Validation
- Using SEP can reduce the risks and improve the quality of ITS projects
- Regional ITS Architectures provide a plan for regional deployment of ITS
- Standards are defined in the Design steps of SEP (High Level Design and Detailed Design)
Slide 44:
Learning Objective #3: Define High Level Technical and Institutional Challenges
- Technical Challenges
- Institutional Challenges
Slide 45:
Learning Objective #3
Technical Challenges
- Inconsistent industry support for standards (some vendors don't support standards)
-
What to do when standards are piecemeal and only partially developed
- EXISTING GAPS—not all potential standards defined
- There are some key areas that do not have mature standards
- Paradigm shift from non-standards based to standards based
- Paradigm shift from non-SEP-based to SEP-based
Slide 46:
Learning Objective #3
Technical Challenges - Industry Support
-
Inconsistent industry support for standards
- Many transit vendors provide custom solutions
- They don't support standards
-
Ownership of data is sometimes an issue
- So the data can be shared as part of regional integration (key benefit of standards)
Slide 47:
Learning Objective #3
Technical Challenges - Gaps
-
Gaps in standards coverage exist in some interfaces that have been standardized
- Some only partially developed
- Some standards that do exist are not yet mature
-
Not many deployments have used the standard
- Actual deployments uncover and resolve bugs or issues resulting in a mature standard
Slide 48:
Learning Objective #3
Technical Challenges - Paradigm Shifts
-
From non-standards based to standards based
-
In past decade extensive progress made toward development of Transit ITS Standards
- Options now exist for standards based procurements
-
In past decade extensive progress made toward development of Transit ITS Standards
-
From non-SEP-based to SEP-based
-
FTA pushing SEP-based deployment
- Part of FTA Policy on Architecture and Standards
- Use of standards is a key aspect of SEP
-
FTA pushing SEP-based deployment
- Paradigm shifts can meet with resistance - not business as usual
Slide 49:
Learning Objective #3
Institutional Challenges
- Resistance to change
- Gaps in existing skills
- Training (having the skills to use the standard)
Slide 50:
Learning Objective #3
Institutional Challenges - Resistance to Change
- Agency leadership has comfort with "business as usual"
- May be bigger issue if agency is not aggressive in applying technology since ITS deployments are technology based
-
To overcome this resistance, the case for change must be strong
- SEP can actually help this by defining user needs and scenarios based on standards that can meet the needs
Slide 51:
Learning Objective #3
Institutional Challenges - Gaps in Skills/Training
- Standards knowledge gaps make use of standards more difficult
- Systems Engineering knowledge gaps also make its use difficult
- Training for agency staff is important to address the gaps
-
The set of ITS Transit Standards Modules are a valuable training resource
- What standards to consider
- How to tailor these standards
- Alternative is contracting for skills
Slide 52:

Slide 53:
Learning Objective #3
Agencies have found which of the following to be a technical challenge of using ITS Standards?
Answer Choices
- Inconsistent industry support
- Needed standards are not mature
- Using standards is a paradigm shift for agency
- All of the above
Slide 54:
Learning Objective #3
Review of Answers
a) Inconsistent industry support
Incorrect. Specifying standards may incur pushback from vendors who do not support them.
b) Needed standards are not mature
Incorrect. May have some gaps in coverage.
c) Using standards is a paradigm shift for agency
Incorrect. Technical skills are needed to properly specify standards in procurements.
d) All of the above
Correct! Each of the above are potential technical challenges to using standards.
Slide 55:
Summary of Learning Objective #3
Define High Level Technical and Institutional Challenges
-
Technical Challenges
- Some transit standards are not mature and some key industry vendors don't support those that are mature
-
Institutional Challenges
- Gaps in agency skills can make it harder to implement standards
- This can be overcome with training, which is the goal of these ITS Transit Standards modules
Slide 56:
Learning Objective #4: Identify the Role of ITS Standards in Transit ITS Applications
-
Standards applicability
- What are specific ITS applications for which standards can be applied?
- What are some of the key standards that address these applications?
-
Procurement link
- How to specify an ITS standard in a procurement
-
Other Issues to consider
- Addressing changing technologies
- Interfacing with legacy systems
- What transit agency staff will need to know to implement standards
Slide 57:
Learning Objective #4
What are Specific ITS Applications for which Standards can be Applied
-
ITS Standards can be used to address a wide array of ITS Applications for transit:
- Automated Vehicle Location (AVL)
- Computer Aided Dispatch (CAD)
- Automatic Passenger Counters (APCs)
- Scheduling Software and Systems
- Traveler Information and Trip Planning
- Transit Signal Priority (TSP)
- Electronic Fare Payment
Slide 58:
Learning Objective #4
How do the Standards Apply to the Applications?
-
The later modules in this series will discuss the general areas of transit where these ITS applications are employed such as:
- Transit Management
- Traveler Information
- Electronic Fare Payment
- In each module the ITS standards relevant to the area will be addressed
Slide 59:
Learning Objective #4
How do the Standards Apply to the Applications? (cont.)
-
Some of the key standards that will be discussed include
- Transit Communications Interface Profiles (TCIP)
- SAE Data Bus Standards
- TransXChange
- Service Interface for Real Time Information (SIRI)
- National Transportation Communications for ITS Protocol (NTCIP) 1211
- Contactless Fare Media System (CFMS) Standard
Slide 60:
Learning Objective #4
Procurement Link to Standards
- To include an ITS standard in a project it must be included in the procurement package
-
How to specify an ITS standard in a procurement?
- Cannot just put in a procurement - "comply with standard xyz"
- Must tailor or customize the standard to cover just those aspects needed by the specific deployment
- Customizing standards for individual procurements will be a recurring topic in many of the modules in this series
Slide 61:
Learning Objective #4
Addressing Changing Technologies
-
But doesn't technology change quickly?
- Changing technologies often offer different ways to provide similar system functionality
- Properly standardized Interfaces will work well no matter the underlying technology that creates the functionality.
- Standards reduce your vulnerability to technology changes
Slide 62:
Learning Objective #4
Interfacing with Legacy Systems
-
Interfacing with legacy systems
- Deployments don't get to start with a "clean slate"
- They build upon existing systems
-
How to handle this when specifying ITS standards?
-
Consider all the interfaces in the project
- If new, is it covered by a standard?
- If legacy, does it need to be revised for project?
- Use standards where possible, keep legacy definitions as needed
-
Consider all the interfaces in the project
Slide 63:
Learning Objective #4
What Transit Agency Staff will Need to Know to Implement Standards
- Which standards to consider
- How to specify standards as part of procurement
- How to test standards when deployed
Slide 64:
Summary of Learning Objective #4
- ITS standards apply to many of the common transit applications including CAD, AVL, and Electronic Payment Systems
- To deploy projects using ITS standards, consideration must begin in the procurement package
-
Agencies need to decide:
- which standards;
- how they will be tailored; and
- how they will be tested
Slide 65:
Learning Objective #5: Describe Roadmap for Transit Standards Modules
-
Roadmaps for the following
- Transit Decision Maker
- Transit Project Managers
- Transit Project Engineering Staff
Slide 66:
Learning Objective #5
Roadmap for Transit Decision-makers
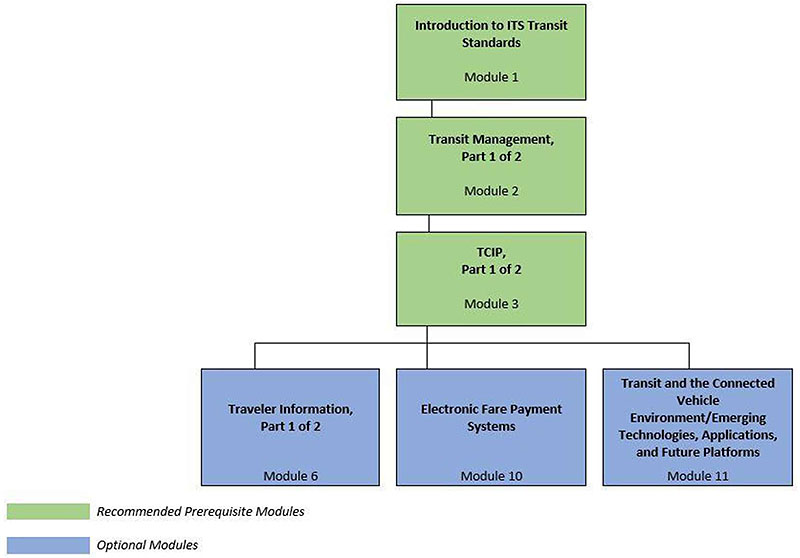
(Extended Text Description: Curriculum Path for Decision Maker: A graphical illustration indicating the sequence of training modules and where this module fits in. Each module is represented by a box with the name of the module in it and a flow chart showing the logical flow of the modules. The first three boxes are green and aligned horizontally, green signifying "Recommended Pre-requisites." The first box is "Introduction to ITS Transit Standards, Module 1." Below that, connected by a line, is a box with the text "Transit Management, Part 1 of 2." Below that, connected by a line, is a box with the text, "TCIP, Part 1 of 2." From here, the lines branch out into three text boxes that are horizontally sequenced and are in blue, signifying "Optional Modules." These three boxes are: "Traveler Information, Part 1 of 2", "Electronic Fare Payment Systems," and "Transit and the Connected Vehicle Environment/Emerging Technologies, Applications, and Future Platforms.")
Slide 67:
Learning Objective #5
Roadmap for Transit Project Managers
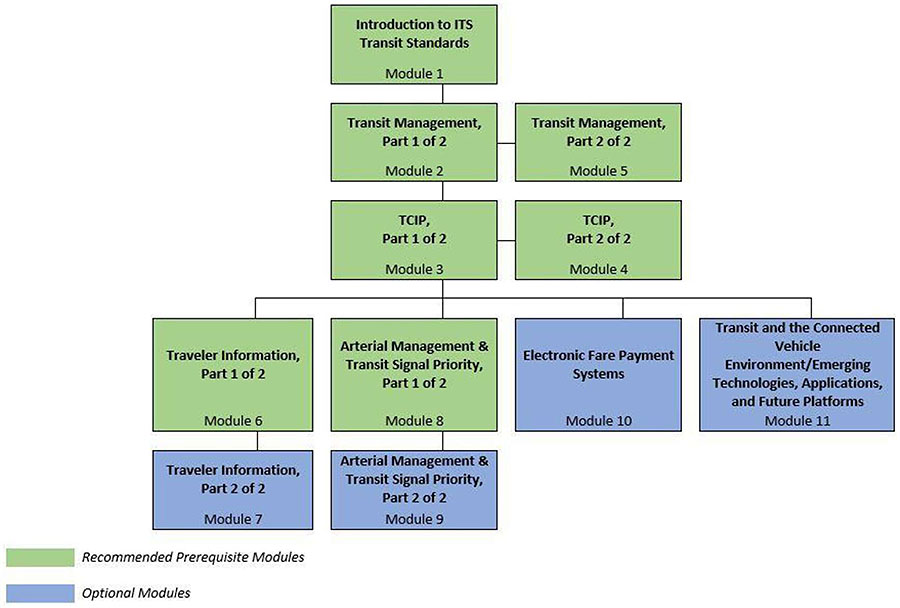
(Extended Text Description: Curriculum Path for Project Manager: A graphical illustration indicating the sequence of training modules and where this module fits in. Each module is represented by a box with the name of the module in it and a flow chart showing the logical flow of the modules. The first three horizontally sequenced boxes are green. The first box is "Introduction to ITS Transit Standards, Module 1." Below that, connected by a line, is a box with the text "Transit Management, Part 1 of 2." To the right of this box, is "Transit Management, Part 2 of 2". Below that "Transit Management, Part 1 of 2", connected by a line, is a box with the text, "TCIP, Part 1 of 2." To the right of this box, is "TCIP, Part 2 of 2." From here, the lines branch out into four text boxes that are horizontally sequenced. The first two: "Traveler Information, Part 1 of 2" and "Arterial Management & Transit Signal Priority, Part 1 of 2" are green; the last two are "Electronic Fare Payment Systems," and "Transit and the Connected Vehicle Environment/Emerging Technologies, Applications, and Future Platforms." Below "Traveler Information, Part 1 of 2," is the text box "Traveler Information, Part 2 of 2" coded in blue. Below "Arterial Management & Transit Signal Priority, Part 1 of 2", is the text box "Arterial Management & Transit Signal Priority, Part 2 of 2," coded in blue.)
Slide 68:
Learning Objective #5
Roadmap for Project Engineering Staff
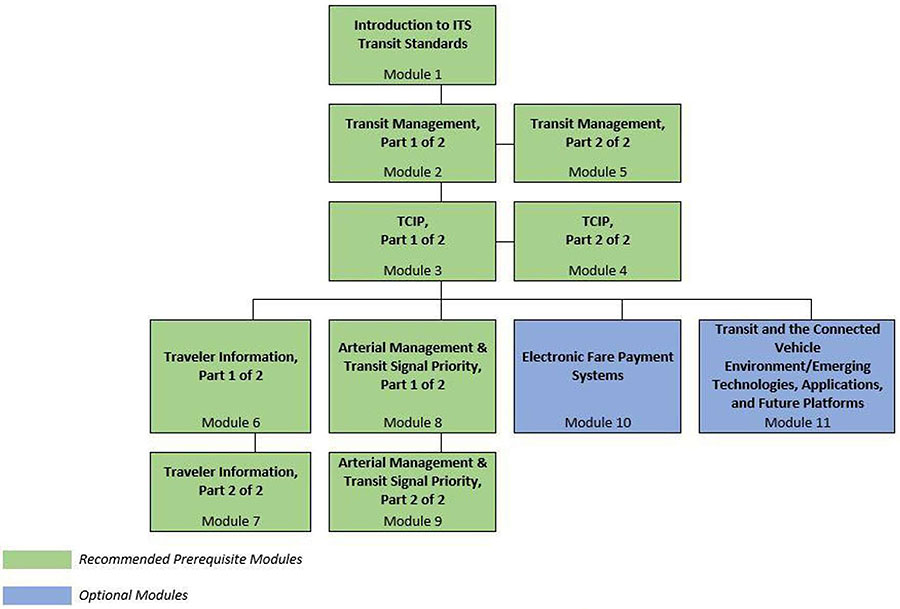
(Extended Text Description: Curriculum Path for Project Engineer: A graphical illustration indicating the sequence of training modules and where this module fits in. Each module is represented by a box with the name of the module in it and a flow chart showing the logical flow of the modules. The first three horizontally sequenced boxes are green. The first box is "Introduction to ITS Transit Standards, Module 1." Below that, connected by a line, is a box with the text "Transit Management, Part 1 of 2." To the right of this box, is "Transit Management, Part 2 of 2". Below that "Transit Management, Part 1 of 2", connected by a line, is a box with the text, "TCIP, Part 1 of 2." To the right of this box, is "TCIP, Part 2 of 2." From here, the lines branch out into four text boxes that are horizontally sequenced. The first two: "Traveler Information, Part 1 of 2" and "Arterial Management & Transit Signal Priority, Part 1 of 2" are green; the last two are "Electronic Fare Payment Systems," and "Transit and the Connected Vehicle Environment/Emerging Technologies, Applications, and Future Platforms." Below "Traveler Information, Part 1 of 2," is the text box "Traveler Information, Part 2 of 2" coded in green. Below "Arterial Management & Transit Signal Priority, Part 1 of 2", is the text box "Arterial Management & Transit Signal Priority, Part 2 of 2," coded in green.)
Slide 69:
Summary of Learning Objective #5
Describe Roadmap for Transit Standards Modules
-
Recommended for all groups of students
- Module 2: Transit Management Part 1
- Module 3: TCIP Part 1
- Remaining modules are optional depending on the types of person's role in the organization and the type of deployments being considered
Slide 70:
What We Have Learned
- ITS Standards define how ITS systems, products, and components can interconnect, exchange information, and interact to deliver services within a transportation network.
- TS Standards can facilitate Regional interoperability.
- Standards can be used as part of the Systems Engineering Process.
-
There are challenges to using ITS Transit standards that are both:
- Technical and
- Institutional
- ITS Transit standards can be used to support a wide array of transit applications, including AVL, CAD, traveler information, TSP, and Electronic Fare Payment.
Slide 71:
Resources
- ITS Standards Program: https://www.standards.its.dot.gov
- SEP FHWA Guidance: https://ops.fhwa.dot.gov/int its deployment/sys eng.htm
- Regional ITS Architecture: https://ops.fhwa.dot.gov/its arch imp/index.htm
- ITS ePrimer Module 7: Public Transportation: eprimer/module7.aspx#opsmgmt
- ITS ePrimer Module 2: Systems Engineering eprimer/module2.aspx#opsmgmt
- FTA Transit Intelligent Transportation System Architecture Consistency Review - 2010 Update https://www.transit.dot.gov/sites/fta.dot.gov/files/docs/2010TransitITSArchRvw_-_08.29.2011.pdf
Slide 72:
Next Course Module
Module 2: Transit Management Standards,
Part 1 of 2
- Module 2 covers technologies and systems that facilitate and automate operations, planning, management, safety, security, and data management functions of public transit systems.
Slide 73:
Thank you for completing this module.