ITS Transit Standards Professional Capacity Building Program
Module 13: An Introduction to Integrated Corridor Management (ICM)
HTML of the PowerPoint Presentation
(Note: This document has been converted from a PowerPoint presentation to 508-compliant HTML. The formatting has been adjusted for 508 compliance, but all the original text content is included, plus additional text descriptions for the images, photos and/or diagrams have been provided below.)
Slide 1:
(Extended Text Description: Welcome - Graphic image of introductory slide. A large dark blue rectangle with a wide, light grid pattern at the top half and bands of dark and lighter blue bands below. There is a white square ITS logo box with words "Standards ITS Training - Transit" in green and blue on the middle left side. The word "Welcome" in white is to the right of the logo. Under the logo box is the logo for the U.S. Department of Transportation, Office of the Assistant Secretary for Research and Technology.)
Slide 2:
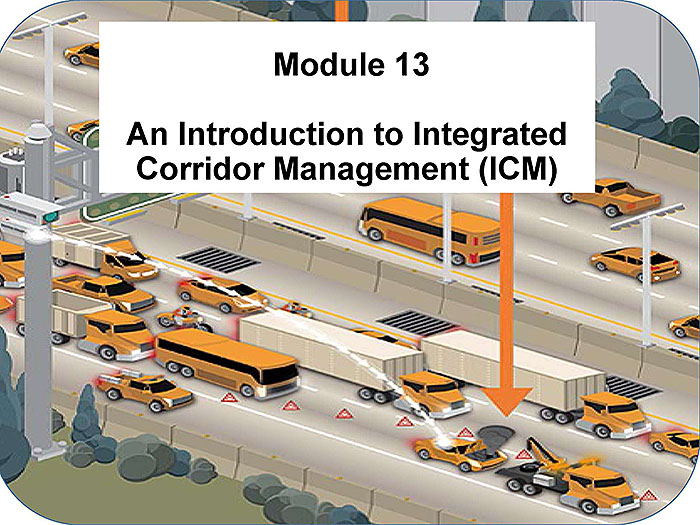
(Extended Text Description: This slide, entitled "Module 13: An Introduction to Integrated Corridor Management (ICM)" has a graphic of a highway with various types of vehicles traveling on it. There is an automobile that has broken down in the travel lane closest to the breakdown lane and is about to be towed away. A camera mounted next to the highway is focused on the broken-down vehicle.)
Slide 3:
Instructor

Carol L. Schweiger
President
Schweiger Consulting LLC
Slide 4:
Learning Objectives
- Describe Integrated Corridor Management (ICM)
- Identify and describe standards associated with ICM
- Describe actual ICM deployments, the role(s) of standards, and the use of standards
Slide 5:
Learning Objective 1
- Describe Integrated Corridor Management (ICM)
Slide 6:
ICM Concepts
What is Integrated Corridor Management (ICM)?
- Next logical step in multimodal congestion management
- Leverages and optimizes existing transportation infrastructure
- Enables travelers to make informed travel decisions and dynamically shift modes
- Reduces travel time, delays, fuel consumption, emissions, and incidents
- Improves travel time reliability and predictability

Slide 7:
ICM Concepts (continued)
Four Basic ICM Concepts
1. Corridor modes of operation
How ICM manager and/or transportation network operators are operating transportation networks

Slide 8:
ICM Concepts (continued)
Four Basic ICM Concepts
1. Corridor modes of operation
2. Strategic areas for ICM
- Demand Management
- Load Balancing
- Event Response
- Capital Improvement

Slide 9:
ICM Concepts (continued)
Four Basic ICM Concepts
1. Corridor modes of operation
2. Strategic areas for ICM
3. Conceptual Levels within the corridor
- Physical
- Information processing
- Execution or decision-making
Slide 10:
ICM Concepts (continued)
Four Basic ICM Concepts
1. Corridor modes of operation
2. Strategic areas for ICM
3. Conceptual Levels within the corridor
4. ICM environment
- Four strategic areas
- Three conceptual levels
Slide 11:
ICM Concepts (continued)

Corridor Modes of Operations
- Normal mode: constitutes all actions to ensure day-to-day transportation needs are addressed
-
Event mode:
- Planned Event mode
- Unplanned Event mode
Slide 12:
ICM Concepts (continued)

Corridor Modes of Operations
- Can shift between Normal mode and Event several times during one day
- Can operate in single mode for entire day
- If event continues for extended period, mode can transition into "Normal" mode
- Corridor manager assesses severity, impact on entire corridor, and expected duration of event before switching from Normal to Event
- Ability of existing systems to support shift is another factor affecting decision to shift from one operational mode to another
Slide 13:
ICM Concepts (continued)

Strategic Areas for ICM
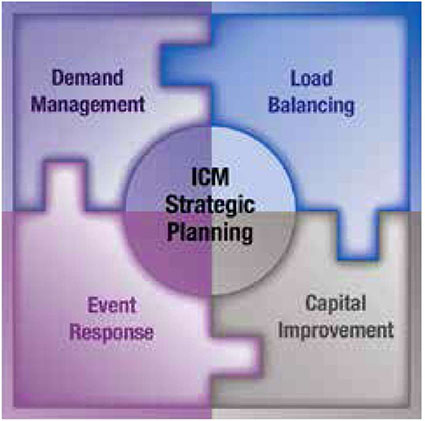
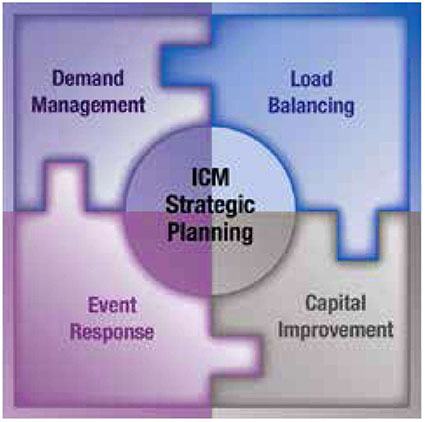
(Extended Text Description: This figure is made up of 4 inter-connecting puzzle pieces. The title of each puzzle piece is Demand Management for the puzzle piece in the upper left of the box; Load Balancing for the puzzle piece in the upper right of the box; Capital Improvement for the puzzle piece in the lower right of the box; and Event Response in the lower left of the box. There is a circle in the middle of the box and its title is ICM Strategic Planning.)
Slide 14:
ICM Concepts (continued)
Strategic Areas for ICM
Demand Management
- Addresses patterns of usage of transportation networks
- Demand changes by time of day, day of week, and time of year
- Actions involve changing or addressing changes in demand patterns
- Type of demand management action depends on mode of operation
Slide 15:
ICM Concepts (continued)
Strategic Areas for ICM
Load Balancing
Addresses how travelers use transportation networks
- During Normal mode operation
- To address Event mode operation
Slide 16:
ICM Concepts (continued)
Strategic Areas for ICM
Event Response
Events categorized by duration or effect. Effects include:
- Reduction of capacity
- Increase in demand
- Change in demand pattern
Slide 17:
ICM Concepts (continued)
Strategic Areas for ICM
Capital Improvements to Mitigate Transportation Problems
- Construction of additional capacity on existing networks
- Addition of networks
- Use of technology on new or existing facilities
Slide 18:
ICM Concepts (continued)

Strategic Areas for ICM
(Extended Text Description: This figure is made up of 4 inter-connecting puzzle pieces. The title of each puzzle piece is Demand Management for the puzzle piece in the upper left of the box; Load Balancing for the puzzle piece in the upper right of the box; Capital Improvement for the puzzle piece in the lower right of the box; and Event Response in the lower left of the box. There is a circle in the middle of the box and its title is ICM Strategic Planning.)
Slide 19:
ICM Concepts (continued)

Three Conceptual Levels
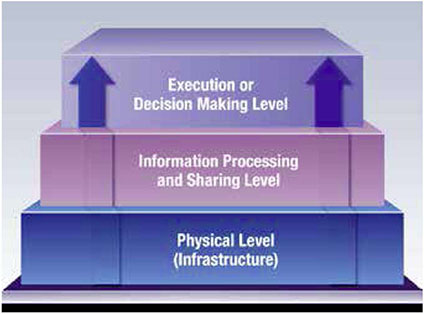
(Extended Text Description: This figure depicts a staircase with three stairs. Each step is a little smaller than the one below it. The bottom step is entitled Physical Level (Infrastructure). The step above it is entitled Information Processing and Sharing Level. The step above it (the top step) is entitled Execution or Decision Making Level. There is an arrow pointing up on the left of the top step and another arrow pointing up on the right of the top step.)

Slide 20:
ICM Concepts (continued)

Four Basic ICM Concepts
4. ICM environment
- Four strategic areas
- Three conceptual levels
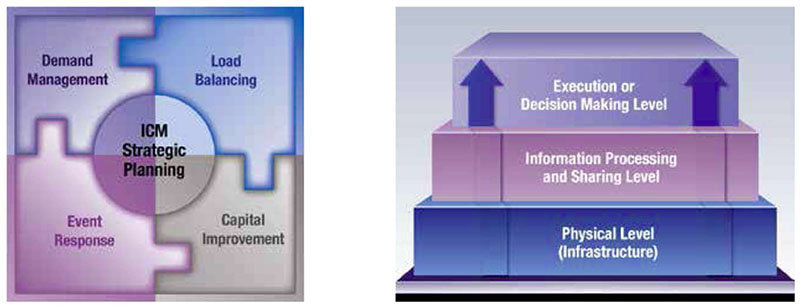
(Extended Text Description: This slide has a box on the left of the slide, which is made up of 4 inter-connecting puzzle pieces. The title of each puzzle piece is Demand Management for the puzzle piece in the upper left of the box; Load Balancing for the puzzle piece in the upper right of the box; Capital Improvement for the puzzle piece in the lower right of the box; and Event Response in the lower left of the box. There is a circle in the middle of the box and its title is ICM Strategic Planning. On the right side of the slide, there is a staircase with three stairs. Each step is a little smaller than the one below it. The bottom step is entitled Physical Level (Infrastructure). The step above it is entitled Information Processing and Sharing Level. The step above it (the top step) is entitled Execution or Decision Making Level. There is an arrow pointing up on the left of the top step and another arrow pointing up on the right of the top step.)
Slide 21:
Benefits of ICM
Benefits of ICM
- Reduced travel times
- Improved travel time reliability
- Reduced fuel consumption
- Reduced emissions
- Annual savings of vehicle-hours of travel
- Reduced travel time variability
- Better utilization of transit excess capacity
- Improved productivity of transportation system as a whole
Slide 22:
ICM: An Operational Scenario
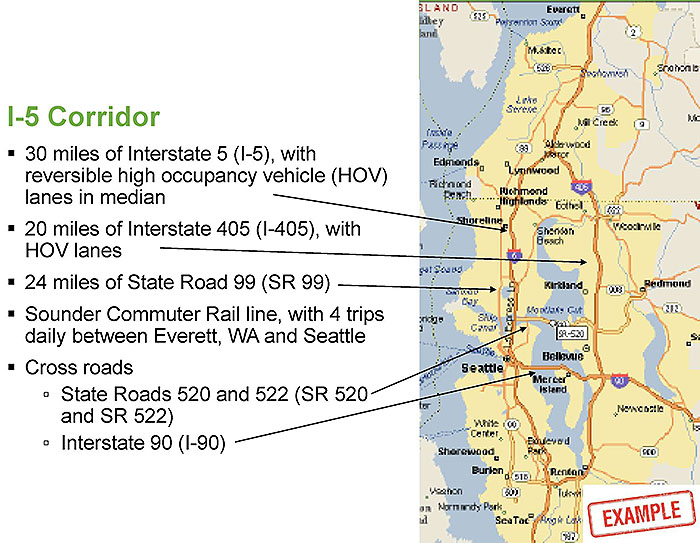
(Extended Text Description: This slide, entitled ICM: An Operational Scenario, with a subtitle of I-5 Corridor, has a map of the Greater Seattle area on the right of the slide. The top of the map is around Everett and the bottom of the map is around Sea Tac. There is an arrow from the bulleted items on the slide to where they are respectively on the map. The bulleted items include:
- 30 miles of Interstate 5 (I-5), with reversible high occupancy vehicle (HOV) lanes in median
- 20 miles of Interstate 405 (I-405), with HOV lanes
- 24 miles of State Road 99 (SR 99)
- Sounder Commuter Rail line, with 4 trips daily between Everett, WA and Seattle
-
Cross roads
- State Roads 520 and 522 (SR 520 and SR 522)
- Interstate 90 (I-90)

Slide 23:
ICM: An Operational Scenario
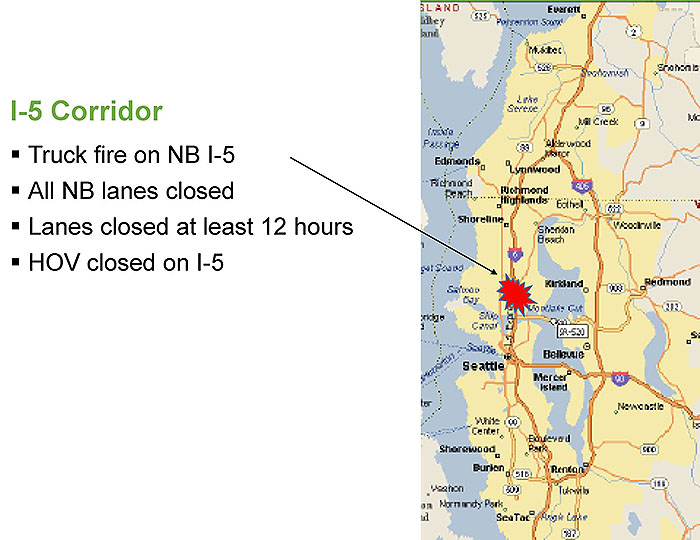
(Extended Text Description:This slide, entitled ICM: An Operational Scenario, with a subtitle of I-5 Corridor, has a map of the Greater Seattle area on the right of the slide. The top of the map is around Everett and the bottom of the map is around Sea Tac. There is a red jagged oval over a small area on the map where there is a truck fire on Northbound I-5. The bulleted items include:
- Truck fire on NB I-5
- All NB lanes closed
- Lanes closed at least 12 hours
- HOV closed on I-5
Slide 24:
ICM: An Operational Scenario
Operational Scenario
-
Network operators want to:
- Ensure traveler safety
- Prevent catastrophic incidents that strand road users
- Provide viable alternatives to road users
- Keep travelers informed
- Current commuter rail ridership about 1,000 people per day
- Without ICM and ICMS, operator reacts to incident in manner permitted by operator's network management system
Slide 25:
How ICM works: An Operational Scenario
Operational Scenario
- Signal timing plans
- Ramp meters
- Detour signage
- Law enforcement to facilitate traffic at intersections
- Advise commuters via broadcast media, email alerts, and other mechanisms
- Suggest staggered trip departure times
- Lift HOV lane restrictions
- Eliminate parking restrictions
- Change bus schedules and routes
- Free shuttle service
- Add commuter rail service
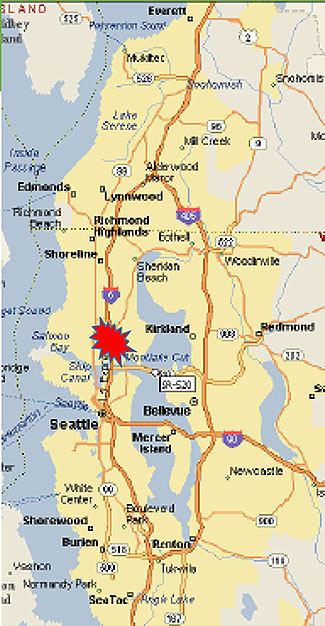
(Extended Text Description: This slide, entitled How ICM works: An Operational Scenario, with a subtitle of Operational Scenario, has a map of the Greater Seattle area on the right of the slide. The top of the map is around Everett and the bottom of the map is around Sea Tac. There is a red jagged oval over a small area on the map where there is a truck fire on Northbound I-5.)
Slide 26:
The Role of Standards in ICM
Control and Real-time Management Standards
-
Traffic Signal Standards:
- National Transportation Communications for ITS Protocol (NTCIP)
- Actuated Traffic Signal Controller (ASC) Units
- NTCIP Signal Systems Masters
- NTCIP Signal Control and Prioritization (SCP)
- Advanced Transportation Controller (ATC)
- ATC Cabinet
- ATC Application Programming Interface (API)
-
Device Standards:
- NTCIP Dynamic Message Signs (DMS)
- NTCIP Ramp Metering
- NTCIP Transportation Sensor System (TSS)
Slide 27:
The Role of Standards in ICM
Data Sharing Standards
- NTCIP Center-to-Center (C2C)
- Society of Automotive Engineers (SAE) Advanced Traveler Information System (ATIS) message sets
- SAE Location Referencing Message Specification (LRMS)
- NTCIP TSS
- NTCIP CCTV Camera Control
Slide 28:

Slide 29:
Question
Which of these is NOT a benefit of Integrated Corridor Management?
Answer Choices
- Reduced fuel consumption
- Improved customer service
- Reduced travel time variability
- Better utilization of transit excess capacity
Slide 30:
Review of Answers
 a) Reduced fuel consumption
Incorrect. ICM is expected to save hundreds of thousands of gallons of fuel annually.
 b) Improved customer service
Correct! While there could be improved customer service, it is not a direct benefit of ICM.
c) Reduced travel time variability
Incorrect. ICM is expected to improve travel time reliability from a reduction in travel time variance.
d) Better utilization of transit excess capacity
Incorrect. ICM is expected to utilize any excess transit capacity.
Slide 31:
Learning Objective 2
- Identify and describe standards associated with ICM
Slide 32:
Traffic Signal Standards for Control and Real Time Management
Traffic Signal Standards
- National Transportation Communications for ITS Protocol (NTCIP)
- Actuated Traffic Signal Controller Units (ASC)
- NTCIP Signal Systems Masters
- NTCIP Signal Control and Prioritization (SCP)
- Advanced Transportation Controller (ATC)
- ATC Cabinet
- ATC Application Programming Interface (API)
Slide 33:
National Transportation Communications for ITS Protocol (NTCIP): Example of ITS Integration Using NTCIP
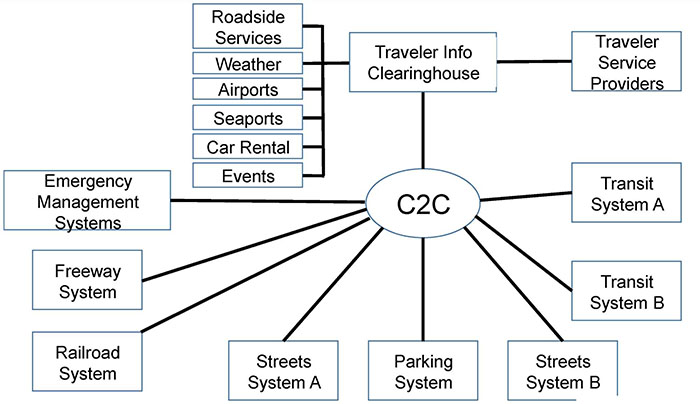
(Extended Text Description: National Transportation Communications for ITS Protocol (NTCIP): Example of ITS Integration Using NTCIP: The chart on this slide shows center to center (C2C) communications. The center of the diagram is an oval that is entitled C2C. Emanating from this oval are numerous boxes that represent various types of systems. Starting from the far left of the diagram is a box entitled Emergency Management Systems – it is connected to the C2C oval by a line. The other boxes connected to the C2C oval counterclockwise from the Emergency Management Systems box are called Freeway System, Railroad System, Streets System A, Parking System, Streets System B, Transit System B, Transit System A, and Traveler Info Clearinghouse. There are six boxes connected to the Traveler Information Clearinghouse, with the following titles: Roadside Services, Weather, Airports, Seaports, Car Rental and Events. These six boxes are to the left of the Traveler Information Clearinghouse box. There is one box to the right of and connected to the Traveler Information Clearinghouse box entitled Traveler Service Providers.)

Slide 34:
Traffic Signal Standards for Control and Real Time Management
Actuated Traffic Signal Controller (ASC) Units
- NTCIP 1202 v02 - Object Definitions for Actuated Traffic Signal Controller (ASC) Units
- Vocabulary (commands, responses and information) necessary to control, manage and monitor ASC Units
- Object definitions to support functionality of ASC units
- Conformance group requirements and conformance statements to support compliance with standard
Slide 35:
Traffic Signal Standards for Control and Real Time Management
NTCIP Signal Systems Masters (SSMs)
-
NTCIP 1210 v01 - Field Management Stations - Part 1: Object Definitions for Signal System Masters (SSMs):
- Vocabulary to control, manage and monitor SSMs and signal system locals (SSLs)
- Means for pass-through communications from traffic management system to local device
- SSMs used when infeasible to provide reliable, full-time communications from SSLs to transportation management center
- SSM device acts as surrogate for traffic management system
- SSM provides various methods of managing set of SSLs, which may include ASCs or other devices
Slide 36:
Traffic Signal Standards for Control and Real Time Management
NTCIP Signal Control and Prioritization (SCP)
- NTCIP 1211 v02 - Object Definitions for Signal Control and Prioritization (SCP)
- Vocabulary necessary to interact with, control, manage, and monitor transportation signal controllers implementing vehicle prioritization schemes
- Description of SCP scenarios and possible configurations
- Object definitions to support functionality of each scenario, conformance group requirements and conformance statements to support compliance with standard
Slide 37:
Traffic Signal Standards for Control and Real Time Management
Advanced Transportation Controller (ATC)
-
ITE/AASHTO/NEMA ATC Family of standards:
- Defines field controller devices used in traffic management applications, particularly (but not exclusively) for traffic signal control
- Has two types of users: Operational and Developers
-
Three components of ATC are:
- Controller
- Cabinet (next slide)
- Software
- Standards define initial modular ATC software platform for Applications Programming Interface (API) (see slide 42), Cabinet and Controller
- ITE/AASHTO/NEMA ATC Family describes open architecture field control devices and software applications that run on them
Slide 38:
Traffic Signal Standards for Control and Real Time Management
ATC Cabinet
- Functional physical design requirements for cabinet that supports deployment of multiple ITS functions in single cabinet
-
Major components installed in a cabinet:
- Controller
- Input Assembly(s)
- Output Assembly(s)
- Power Distribution Assembly
- Service Panel Assembly
- DC Power/Communications Assembly & Extension
- Raw/Clean AC Power Assembly & Extension
- Cabinet Monitoring System
- Optionally, a Fiber Optic Splice Tray
- Includes other components
- Three standard cabinet assemblies are defined
Slide 39:
Traffic Signal Standards for Control and Real Time Management
ATC Application Programming Interface (API)
- Specifies interface for application programs designed to operate on ATC controllers
- Allows multiple applications to be interoperable on single controller by sharing fixed resources of controller
-
Software Requirements Specification (SRS) defines:
- Five-layer structure
- User needs and requirements of ATC software
- Further defines API layer
- Provides basis for Board Support Package, the layer underneath API that is part of ATC controller standard
Slide 40:
Device Standards Providing Control and Real Time Management
Device Standards
- NTCIP Dynamic Message Signs (DMS)
- NTCIP Ramp Metering
- NTCIP Transportation Sensor System (TSS)

Slide 41:
Device Standards Providing Control and Real Time Management
NTCIP Dynamic Message Signs (DMS)
Slide 42:
Device Standards Providing Control and Real Time Management
NTCIP Dynamic Message Signs (DMS)
- NTCIP 1203 v03 - Object Definitions for Dynamic Message Signs (DMS)
- DMS can change the message presented to the viewer
- Vocabulary to advise and inform vehicle operators of current highway conditions by using DMS
- Message syntax, called MULTI (Mark-Up Language for Transportation Information), which allows objects to be grouped into message object
- Message object is analogous to sentence - both message object and sentence require syntax or ordering of information objects (words) to be understood
Slide 43:
Device Standards Providing Control and Real Time Management
NTCIP Ramp Metering
Slide 44:
Device Standards Providing Control and Real Time Management
NTCIP Ramp Metering
- NTCIP 1207 v02 - Object Definitions for Ramp Meter Control (RMC) Units
- Ramp meter is a controller (Type 170, 2070, ATC) equipped with software/firmware and algorithms for freeway ramp
-
Assumes model of operation:
- RMC units possess intelligence
- Data for ramp management and data collection resident at RMC unit
- RMC unit's status, control and configuration data as "controller database"
- Specifies interfaces so data can be manipulated by central system
Slide 45:
Device Standards Providing Control and Real Time Management
NTCIP Transportation Sensor System (TSS)
- NTCIP 1209 v02 - Object Definitions for Transportation Sensor Systems (TSS)
- Provides vocabulary necessary to control, manage, and monitor TSS devices
-
Devices include:
- Smart inductive loop amplifiers
- Machine vision video detection
- Microwave radar monitoring systems
- Provide various methods of sensing the presence and other characteristics of vehicle traffic
- Includes overview of TSS architecture and operations
Slide 46:
TCIP for Control and Real Time Management of Transit
Transit Communications Interface Profiles (TCIP)
American Public Transportation Association (APTA) Standard
Provides library of information exchange building blocks to allow transit agencies and transit suppliers to create standardized tailored interfaces
Slide 47:
- TCIP for Control and Real Time Management of Transit_
- TCIP
- NTCIP 1400-series standards
-
Provides building blocks for interfaces for business areas:
- Common Public Transport
- Scheduling
- Passenger Information
- Transit Signal Priority
- Control Center
- Onboard Systems
- Spatial Referencing
- Fare Collection
-
See Modules 3 and 4 of ITS PCB Standards Transit Training Modules
(stds modules transit.aspx)
Slide 48:
Data Sharing Standards
Data Sharing Standards
- NTCIP Center-to-Center (C2C)
- Society of Automotive Engineers (SAE) Advanced Traveler Information System (ATIS) message sets
- SAE Location Referencing Message Specification (LRMS)
- NTCIP TSS (covered previously)
- NTCIP CCTV Camera Control
Slide 49:
Data Sharing Standards
NTCIP Center-to-Center (C2C)
- C2C communications is type of communication involving messages sent between two or more center systems
- Involves peer-to-peer communications between any number of center systems in many-to-many network
- Type of communication similar to Internet
Slide 50:
Data Sharing Standards
Society of Automotive Engineers (SAE) Advanced Traveler Information System (ATIS) Message Sets - SAE J2354
- Messages and data elements exchanged among traveler information providers (data providers) and travelers (data consumers)
-
Includes:
- Integrated use of International Traveler Information System (ITIS) phrase lists
- XML-based versions of each entry
- Reuse of data elements from other functional area data dictionaries (e.g., Traffic Management Data Dictionary)
- Defines messages for general use
- Consists of data elements (DEs) formerly defined in companion standard SAE J2353

Slide 51:
Data Sharing Standards
SAE J2266 - Location Referencing Message Specification (LRMS)
-
Describes the following LRMS profiles:
- Address
- Area Location
- Chain
- Cross Streets
- Geographic Coordinate
- Geometry
- Grid
- Group Location
- Linear Reference
- L/n/c Location
- Node Attribute
- Point Location
- Pre-Coded
- Public Grid
- Route Location
- Spatial Object
- Transition
Slide 52:
Data Sharing Standards
NTCIP CCTV Camera Control
- NTCIP 1205 Amendment 1 to v01 - Object Definitions for Closed Circuit Television (CCTV) Camera Control
- Vocabulary necessary to control, manage and monitor cameras, lenses and pan/tilt units
- Object definitions to support functionality of these devices as used for transportation and traffic monitoring applications
- Includes conformance group requirements and conformance statements to support compliance with the standard
Slide 53:
Standards Associated with Monitoring Conditions Along a Corridor
Monitoring Conditions Standards
- NTCIP TSS
- Signal
- CCTV standards
Slide 54:

Slide 55:
Question
Which one of these device standards does not provide control and real time management?
Answer Choices
- NTCIP Ramp Metering
- ATC Application Programming Interface (API)
- NTCIP Transportation Sensor System (TSS)
- NTCIP Dynamic Message Signs (DMS)
Slide 56:
Review of Answers
a) NTCIP Ramp Metering
Incorrect. This device standard is used to provide control and rea time management - a ramp meter is a traffic controller specific to freeway ramp to control traffic flow entering freeway lanes.
b) ATC Application Programming Interface (API)
Correct! The ATC API standard is in the category of traffic signal standards for control and real time management.
c) NTCIP Transportation Sensor System (TSS)
Incorrect. This standard is used to provide control and real time management - it provides vocabulary necessary to control, manage, and monitor TSS devices.
d) NTCIP Dynamic Message Signs (DMS)
Incorrect. This standard is used to provide control and real time management - it provides vocabulary necessary to advise and inform vehicle operators of current highway conditions.
Slide 57:
Learning Objective 3
Describe actual ICM deployments, how each ICM works, and the role and use of standards
Slide 58:
San Diego - Demonstration Site
Basic Components
Vision
Proactively and collaboratively manage I-15 corridor
- Maximize system performance
- Enable opportunity to shift among modes and routes
Slide 59:
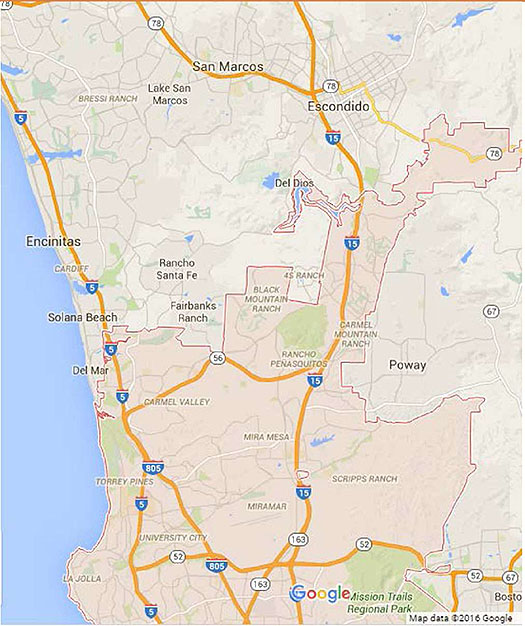
San Diego - Demo Site
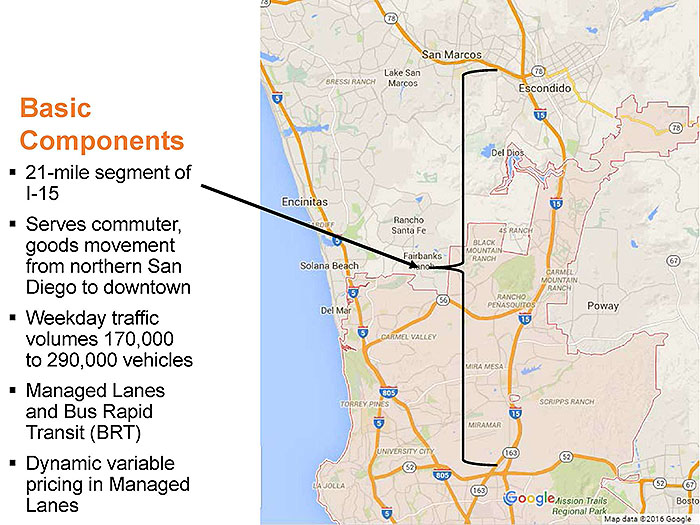
(Extended Text Description: This slide, entitled San Diego – Demonstration Site, with a subtitle of Basic Components, has a map of the Greater San Diego area on the right of the slide. The top of the map is around San Marcos and the bottom of the map is around the intersection of I-15 and Route 52. A 21-mile segment of I-15 is highlighted on the map running from SR-78 in the north to the SR-163 interchange in the south. Bulleted text to the left of the map has an arrow that points in to the 21-mile segment, and contains the following bullet text:
Basic Components
- 21-mile segment of I-15
- Serves commuter, goods movement from northern San Diego to downtown
- Weekday traffic volumes 170,000 to 290,000 vehicles
- Managed Lanes and Bus Rapid Transit (BRT)
- Dynamic variable pricing in Managed Lanes
Slide 60:
San Diego - Demonstration Site
Basic Components of San Diego ICMS (continued)
-
Improve mobility achieved by:
- Improving system integration
- Continued collaboration among corridor's partners and their systems
-
Actions taken by individual agencies made based on condition of and impact on entire corridor:
- All corridor operations coordinated through ICMS
Stakeholders: San Diego Association of Governments (SANDAG), USDOT, California Department of Transportation (Caltrans), Metropolitan Transit System, North County Transit District, and cities of San Diego, Poway and Escondido
Slide 61:
San Diego - Demonstration Site
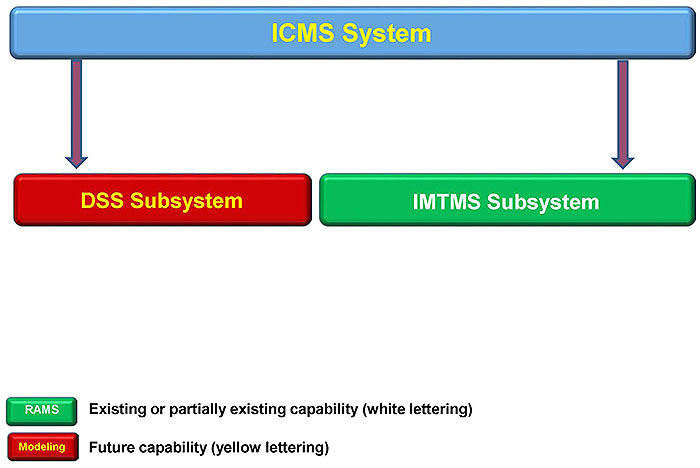
(Extended Text Description: This slide, entitled San Diego - Demonstration Site has a blue box entitled ICMS in yellow lettering at the top of the slide, with two boxes below it, both connected by lines from the blue box with arrows pointing to each of the two boxes. The box on the left is red and entitled DSS Subsystem in yellow lettering. The box on the right is green and entitled IMTMS Subsystem in white lettering. The red box is considered an ICMS candidate system to be developed or enhanced. The blue box is the core functionality required under the ICMS delivery. The green box is a subsystem which is currently part of the Regional Intermodal Transportation Management System. At the bottom left of the slide are two boxes – one is green with white lettering that says RAMS and the other box is red with yellow lettering that says Modeling. The white lettering means existing or partially existing capability, and the yellow lettering means future capability.)
Slide 62:
San Diego - Demonstration Site
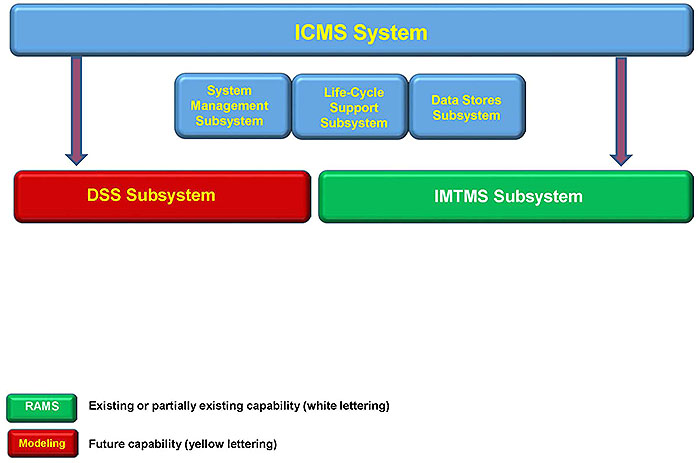
(Extended Text Description: This slide, entitled San Diego - Demonstration Site has a blue box entitled ICMS in yellow lettering at the top of the slide, with three blue boxes below it. Each of these boxes is entitled in yellow lettering, from left to right, is System Management Subsystem, Life-Cycle Support Subsystem and Data Stores Subsystem. Below these three boxes, but connected to the blue box at the top of the slide are two boxes, both connected by lines from the blue box with arrows pointing to each of the two boxes. The box on the left is red and entitled DSS Subsystem in yellow lettering. The box on the right is green and entitled IMTMS Subsystem in white lettering. The red box is considered an ICMS candidate system to be developed or enhanced. The blue box is the core functionality required under the ICMS delivery. The green box is a subsystem which is currently part of the Regional Intermodal Transportation Management System. At the bottom left of the slide are two boxes – one is green with white lettering that says RAMS and the other box is red with yellow lettering that says Modeling. The white lettering means existing or partially existing capability, and the yellow lettering means future capability.)
Slide 63:
San Diego - Demonstration Site
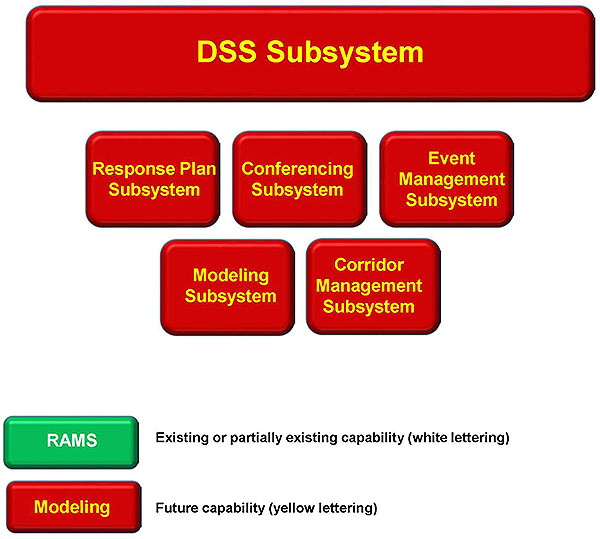
(Extended Text Description: This slide, entitled San Diego - Demonstration Site has a red box entitled DSS Subsystem in yellow lettering at the top of the slide, with three red boxes below it. Each of these boxes is entitled in yellow lettering, from left to right, is Response Plan Subsystem, Conferencing Subsystem and Event Management Subsystem. Below these three boxes are two more red boxes entitled Modeling Subsystem and Corridor Management Subsystem in yellow lettering. At the bottom left of the slide are two boxes – one is green with white lettering that says RAMS and the other box is red with yellow lettering that says Modeling. The white lettering means existing or partially existing capability, and the yellow lettering means future capability.)
Slide 64:
San Diego - Demonstration Site
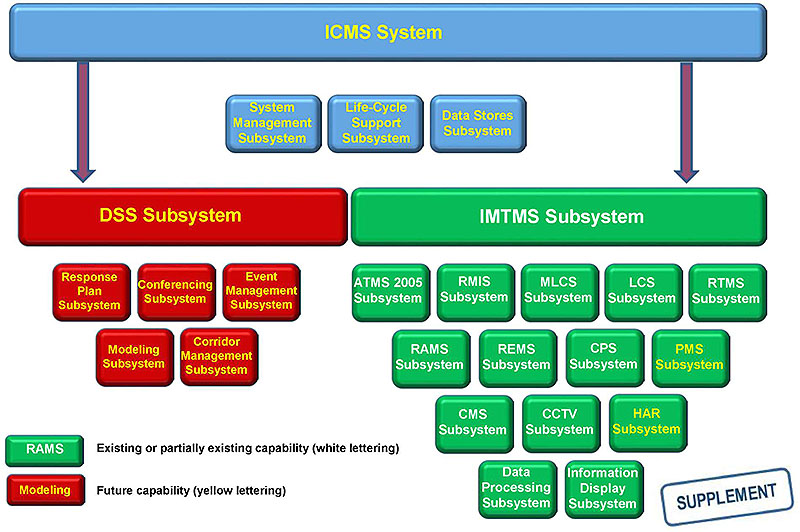
(Extended Text Description: This slide, entitled San Diego - Demonstration Site has a blue box entitled ICMS in yellow lettering at the top of the slide, with three blue boxes below it. Each of these boxes is entitled in yellow lettering, from left to right, is System Management Subsystem, Life-Cycle Support Subsystem and Data Stores Subsystem. Below these three boxes, but connected to the blue box at the top of the slide are two boxes, both connected by lines from the blue box with arrows pointing to each of the two boxes. The box on the left is red and entitled DSS Subsystem in yellow lettering. The box on the right is green and entitled IMTMS Subsystem in white lettering. The red box is considered an ICMS candidate system to be developed or enhanced. The blue box is the core functionality required under the ICMS delivery. The green box is a subsystem which is currently part of the Regional Intermodal Transportation Management System. Under the red box entitled DSS Subsystem in yellow lettering are three red boxes below it. Each of these boxes is entitled in yellow lettering, from left to right, is Response Plan Subsystem, Conferencing Subsystem and Event Management Subsystem. Below these three boxes are two more red boxes entitled Modeling Subsystem and Corridor Management Subsystem in yellow lettering. Under the green box entitled IMTMS Subsystem in white lettering are five green boxes below it. Each of these boxes is entitled in white lettering, from left to right, is ATMS 2005 Subsystem, RMIS Subsystem, MLCS Subsystem, LCS Subsystem, and RTMS Subsystem. Below these five boxes are four more green boxes entitled RAMS Subsystem, REMS Subsystem, and CPS Subsystem, in white lettering and PMS Subsystem in yellow lettering. Below these four boxes are three more green boxes entitled CMS Subsystem and CCTV Subsystem in white lettering and HAR Subsystem in yellow lettering. Below these three boxes are two more green boxes entitled Data Processing Subsystem and Information Display Subsystem in white lettering. At the bottom left of the slide are two boxes – one is green with white lettering that says RAMS and the other box is red with yellow lettering that says Modeling. The white lettering means existing or partially existing capability, and the yellow lettering means future capability.)
Slide 65:
San Diego - Demonstration Site
How the I-15 ICM System Works
- Uses ITS networks to measure and manage performance
- Enables systems to "talk" to each other to coordinate operations and maximize efficiency regardless of ownership
- Monitors changing conditions and congestion using real-time information
- Generates automated response plans
- Generates new response plans as traffic conditions change
- Operations in corridor managed using Decision Support System (DSS)
Slide 66:
San Diego - Demonstration Site
Standards Used in the San Diego I-15 ICM System
-
Intermodal Transportation Management System (IMTMS) Distribution Interface uses:
- Traffic Management Data Dictionary (TMDD) Version 2.1 for data definitions
- NTCIP 2306 for Center-to-Center (C2C) message interfaces ° IMTMS Systems Design Document (SDD), Section 4, Draft 1.0
-
511 Dissemination Interface uses:
- TMDD, Version 2.1 for data definitions
- NTCIP 2306 for C2C message interfaces
- IMTMS-511 Interface Design Document (IDD), Draft 1.0
- OrbCAD (Regional Transit Management System [RTMS]) Interface uses Interface Control Document (ICD) FE-ICD202, Version 1.0
Slide 67:
San Diego - Demonstration Site
Evaluation of the San Diego I-15 ICM System
-
Demonstrated ability to:
- Identify incidents and unusual congestion events
- Develop traffic management strategies integrating freeway, arterial, and transit operational elements
- Implement recommended strategies automatically or following approval by relevant system operators
- Demonstrated feasibility of using microscopic traffic simulation model in real-time operational environment to forecast corridor operations under alternative scenarios
- Simulation evaluations shown operational benefits exceeding deployment costs
Slide 68:
Dallas - Demonstration Site
Basic Components of Dallas ICM System (ICMS)
-
Vision: Operate US-75 Corridor in multimodal, integrated, efficient, and safe fashion where focus is on transportation customer:
- Increase corridor throughput
- Improve travel time reliability
- Improved incident management
- Enable intermodal travel decisions
-
ICM Corridor covers:
-
US-75 Corridor - cantilevered frontage roads and eight general-purpose lanes:
- Freeway main lanes carry over 330,000 vehicles a day
- Another 20,000-30,000 on the frontage roads
- Concurrent-flow, HOV lanes operated by TxDOT
- Light-rail lines in Dallas
-
US-75 Corridor - cantilevered frontage roads and eight general-purpose lanes:
Slide 69:
Dallas - Demonstration Site
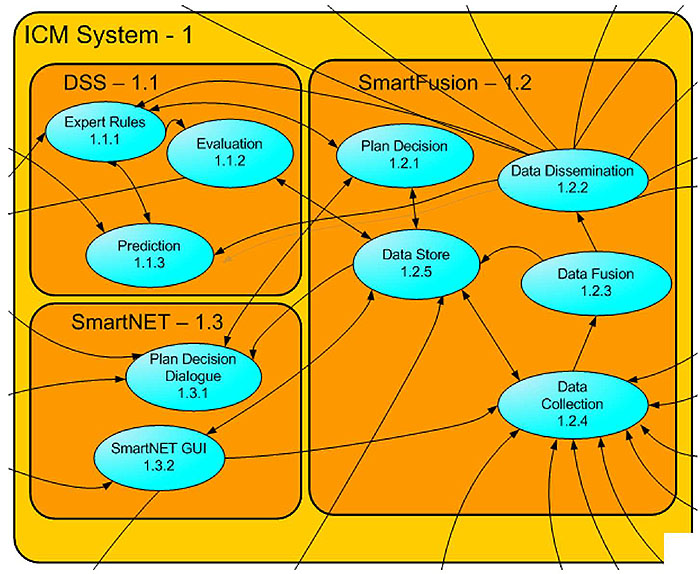
(Extended Text Description: This slide, entitled Dallas - Demonstration Site has a diagram that is composed of three major areas. The top left area of the graphic is entitled DSS 1.1 and is composed of three connected ovals entitled Expert Rules 1.1.1, Evaluation 1.1.2 and Prediction 1.1.3. The right area of the graphic is entitled Smart Fusion 1.2 and is composed of five connected ovals entitled Plan Decision 1.2.1, Data Dissemination 1.2.2, Data Fusion 1.2.3, Data Collection 1.2.4 and Data Store 1.2.5. The lower left slide of the graphic is entitled SmartNET 1.3 and is composed of two connected ovals entitled Plan Decision Dialogue 1.3.1 and SmartNET GUI. The connections in the graphic can be described as follows:
- There is a line with an arrow going from 1.1.1 to 1.1.2
- There is a line with arrows at both ends going between 1.1.1 and 1.1.3
- There is a line with arrows at both ends going between 1.1.1 and 1.2.1
- There is a line with an arrow going from 1.2.2 to 1.1.1
- There is a line with an arrow going from 1.2.2 to 1.1.3
- There is a line with arrows at both ends going between 1.1.2 and 1.2.5
- There is a line with arrows at both ends going between 1.2.1 and 1.2.5
- There is a line with an arrow going from 1.2.3 to 1.2.2
- There is a line with an arrow going from 1.2.3 to 1.2.5
- There is a line with an arrow going from 1.2.4 to 1.2.3
- There is a line with arrows at both ends going between 1.2.1 and 1.3.1
- There is a line with an arrow going from 1.2.5 to 1.3.1
- There is a line with arrows at both ends going between 1.2.5 and 1.3.2
- There is a line with arrows at both ends going between 1.2.4 and 1.2.5
- There is a line with an arrow going from 1.3.2 to 1.2.4
Slide 70:
Dallas - Demonstration Site
Real Time Transit Data Used for ICM and 511DFW
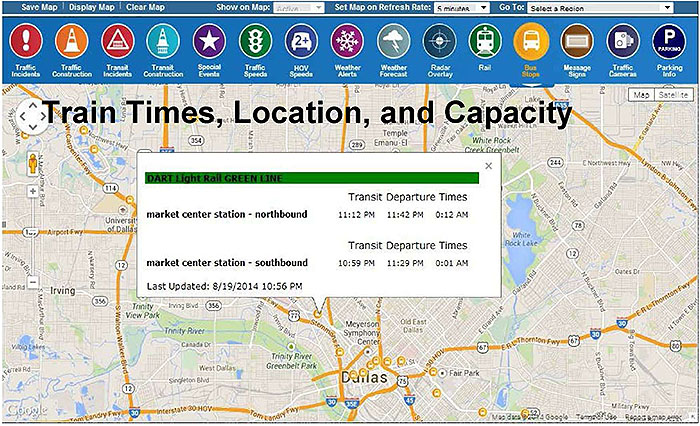
(Extended Text Description: This slide, entitled Dallas – Demonstration Site, subtitled Real Time Transit Data Used for ICM and 511DFW has a graphic that has a map of Dallas in the background and in the foreground, there is a window that has the following words DART Light Rail GREEN LINE on the first line, and then shows Transit Departure Times for Market Center Station Northbound of 11:12pm, 11:42pm and 01:12am, for Market Center Station Southbound of 10:59pm, 11:29pm and 0:01am. Above the window are the words Train Times, Location, and Capacity. At the top of the graphic are the following icons: Traffic Incidents, Traffic Construction, Transit Incidents, Transit Construction, Special Events, Traffic Speeds, HOV Speeds, Weather Alerts, Weather Forecast, Radar Overlay, Rail Bus Stops, Message Signs, Traffic Cameras and Parking Info.)
Slide 71:
Dallas - Demonstration Site
Real Time Transit Data Used for ICM and 511DFW
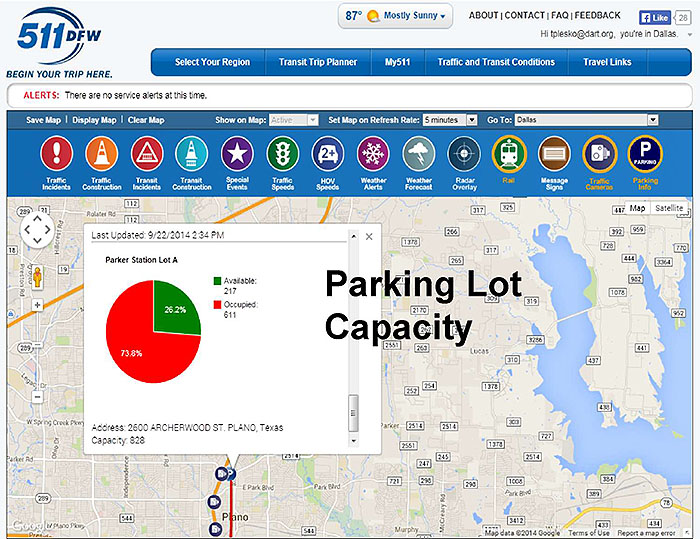
(Extended Text Description: This slide, entitled Dallas – Demonstration Site, subtitled Real Time Transit Data Used for ICM and 511DFW has a graphic that has a map of Dallas in the background and in the foreground, there is a window that shows the parking lot capacity at Parker Station Lot A in a pie chart that shows 73.8% or 611 spaces occupied and 26.2% or 217 spaces available. At the top of the graphic are the following icons: Traffic Incidents, Traffic Construction, Transit Incidents, Transit Construction, Special Events, Traffic Speeds, HOV Speeds, Weather Alerts, Weather Forecast, Radar Overlay, Rail Bus Stops, Message Signs, Traffic Cameras and Parking Info.)
Slide 72:
Dallas - Demonstration Site
Real Time Transit Data Used for ICM and 511DFW
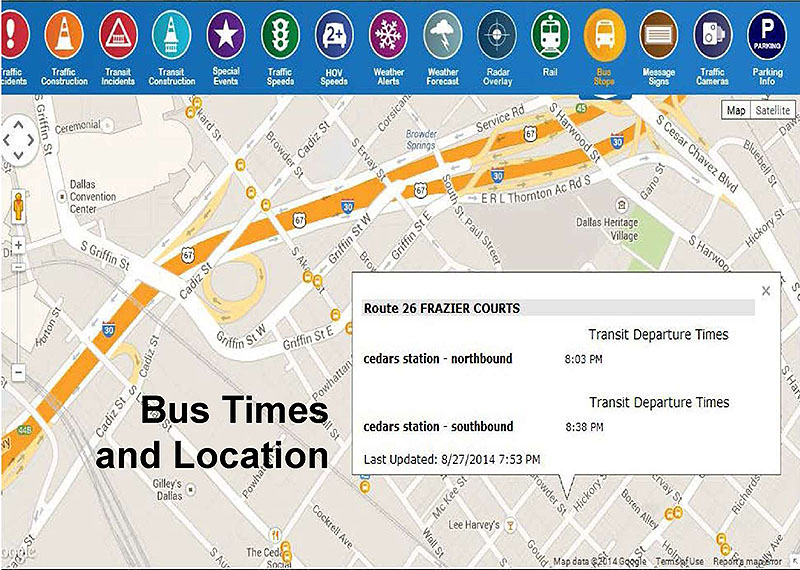
(Extended Text Description: This slide, entitled Dallas – Demonstration Site, subtitled Real Time Transit Data Used for ICM and 511DFW has a graphic that has a map of Dallas in the background and in the foreground, there is a window that shows Bus Times and Location for Route 26 Frazier Courts as follows: at Cedar Station Northbound at 8:03pm and Cedar Station Southbound at 8:38pm. At the bottom of this window, it says Last Updated 8/27/2014 7:53pm. At the top of the graphic are the following icons: Traffic Incidents, Traffic Construction, Transit Incidents, Transit Construction, Special Events, Traffic Speeds, HOV Speeds, Weather Alerts, Weather Forecast, Radar Overlay, Rail Bus Stops, Message Signs, Traffic Cameras and Parking Info.)
Slide 73:
Dallas - Demonstration Site
Standards Used in the Dallas ICM System
-
Traffic Management Data Dictionary (TMDD) -
SmartNET utilizes TMDD version 2.1 as basis of data dictionary. Dallas Regional C2C system based on TMDD version 2.1, with some localization -
Message Sets for External TMC to TMC Communication
(MS/ETMCC) - SmartNET and Dallas Regional C2C system utilize this standard -
Transit Communication Interface Protocol (TCIP) -
DART Data Portal envisioned to utilize TCIP for some of its data elements
Slide 74:
Dallas - Demonstration Site
Concept Validation Through Simulation
- Reduced congestion 740,000 person-hours saved/year
- Travel time reliability improved by 3%
- Fuel savings of 981,000 gallons annually
- Emissions reduction of 9,400 tons annually
Benefit/Cost ratio of 20:1
Slide 75:
I-80 Integrated Corridor Mobility (ICM)/ Smart Corridor Project
Basic Components of I-80 ICM Project
Vision:
- Create a Well-Balanced System
- Maintain Optimal Operational Viability
- Proactively Avoid Flow Breakdown
- Detect and Respond to Congestion Events Faster
- Improve Safety
- Manage Congested Flow When it Does Occur
- Promote Transit Ridership and Mode Shifts
- Clear Local Arterials from Diversion
Slide 76:
I-80 Integrated Corridor Mobility (ICM)/ Smart Corridor Project
Basic Components of I-80 ICM Project (continued)
ICM Corridor covers:
- 20 mile corridor from Bay Bridge to the Carquinez Bridge
- Major corridor for commuters and transit
- National freight corridor
- Link to 2 international airports and the Port of Oakland
- Connects significant job centers (Alameda County ranked 2nd largest in Region)
- Spans across 2 counties and 9 cities
Slide 77:
I-80 Integrated Corridor Mobility (ICM)/ Smart Corridor Project
Project Concepts Deployed
- Freeway and Incident Management
- Adaptive Ramp Metering
- Arterial Management
- Traveler Information
- Traffic Monitoring
-
Transit Management:
-
Preferential Treatment for Transit
- Transit Signal Priority
- Ramp Meter Bypass
-
Park and Ride Facilities (future)
- Provide Real-time information
-
Transit Traveler Information
- Travel times
- Directions to transit facilities
- Real time Transit Departure Times
-
Preferential Treatment for Transit
Slide 78:
I-80 Integrated Corridor Mobility (ICM)/ Smart Corridor Project
System Integration
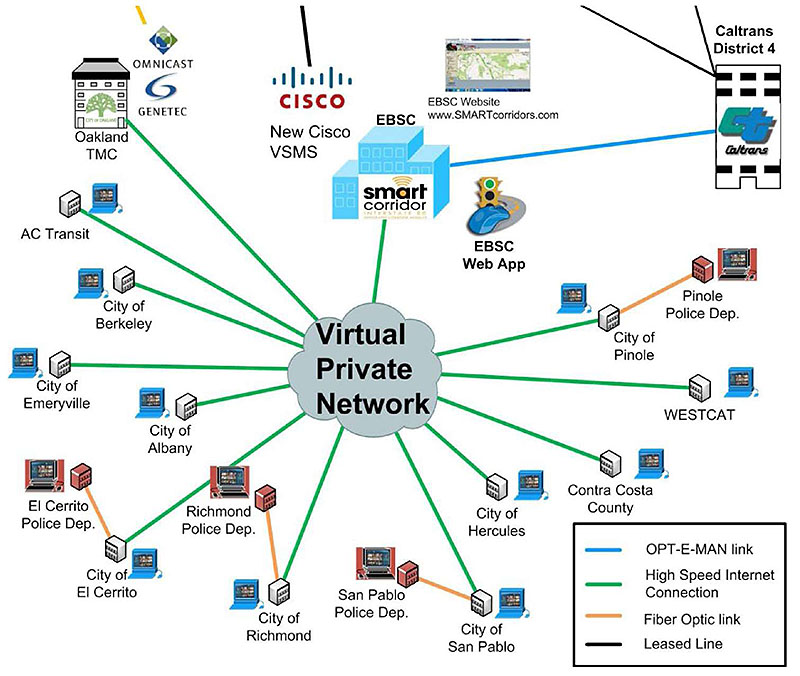
(Extended Text Description: This slide, entitled I-80 Integrated Corridor Mobility (ICM)/ Smart Corridor Project, subtitled System Integration has a graphic that shows elements of their Virtual Private Network. In the middle of the diagram, it says Virtual Private Network. Emanating from the middle of the diagram are the following elements (starting at a noon position moving clockwise): Smart Corridor building, City of Pinole, WESTCAT, Contra Costa County, City of Hercules, City of San Pablo, City of Richmond, City of El Cerrito, City of Albany, City of Emeryville, City of Berkeley, AC Transit, and Oakland TMC. Each of these elements are connected to the center of the diagram with lines that represent High Speed Internet Connections. The Smart Corridor building is connected to Caltrans District 4 with a line representing OPT-E-MAN link. The City of Pinole is connected to Pinole Police Dep with a line representing a Fiber Optic link. The City of San Pedro is connected to San Pedro Police Dep with a line representing a Fiber Optic link. The City of Richmond is connected to Richmond Police Dep with a line representing a Fiber Optic link. The City of El Cerrito is connected to El Cerrito Police Dep with a line representing a Fiber Optic link.)
Slide 79:
I-80 Integrated Corridor Mobility (ICM)/ Smart Corridor Project
Status of I-80 ICM Project
As of April 29, 2015:
- Construction completed
-
Signs being tested on Westbound I-80:
- Installation of overhead signs across westbound I-80 between Richmond and Emeryville completed
- Signs are being tested
- Testing continuing through the summer when traffic volumes are lowest
- Roadside electronic speed limit signs are also being tested
Slide 80:
NY/NJ ICM - 495 Project
Basic Components of ICM- 495 Project
Vision
- Enhance current transportation management systems of ICM-495 Corridor
- Solutions and resources create balanced network reflecting integration of pre-existing programs and systems with modified and new deployments
- Improving overall Corridor performance will be a priority by providing better knowledge about real-time conditions and alternative travel options within practical operational, institutional, and financial constraints
Slide 81:
NY/NJ ICM - 495 Project
Basic Components
- NY/NJ metro area
- Connects NJ Turnpike to Van Wyck Exressway and traverses Midtown Manhattan
- Diverse residential, commercial, and industrial uses
- 2 key facilities - Lincoln Tunnel and Queens-Midtown Tunnel
- Extensive highway network
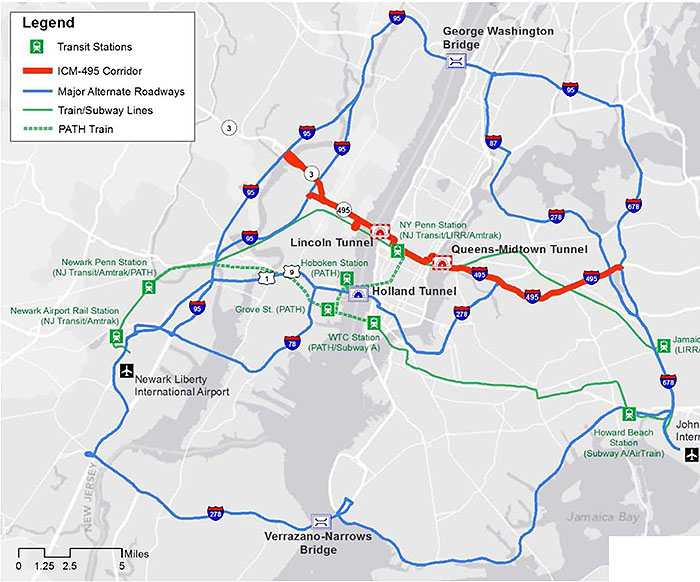
(Extended Text Description: This slide, entitled NY/NJ ICM-495 Project, subtitled Basic Components has a map of the NY/NJ Metro area on the right side of the slide. A red line represents the ICM corridor on I-495 from the intersection with I-678 on the east to the intersection with Route 3 and I-95 on the west. The map also shows Major Alternate Roadways, Train and Subway Lines, the PATH train and Transit Stations.)
Slide 82:
NY/NJ ICM - 495 Project
Leverage Existing Infrastructure and Standards
- CCTV surveillance cameras and Fiber
- Weather System covering all bridge facilities with both surface and atmospheric sensors
- NTCIP compliant VMS and VSLS
- TRANSMIT System
- Lane Use Signal Control System
- Video Incident Detection
- Advanced Traffic Information System
- MTA B&T Operations Central Command Center (OCCC)
- Dynamic Message Signs
- Lane-Use Control Signals
- Changeable Speed Limit Signs
- Video-based vehicle detection system stations
- TRANSMIT readers
Slide 83:
NY/NJ ICM - 495 Project
Leverage and Build upon Ongoing Programs
- Congestion Management Process
- Drivers First Initiative
- Drive Smart & Bike Share
- I-495 Managed Use Lane
- Midtown in Motion
- New York and New Jersey 511 and Rideshare
- New York and New Jersey ITS Programs
- Off-Hour Deliveries
- PARK Smart
- Select Bus Service
- Smart Move Program
- Truck Routing and Bridge Strike Mitigation
Slide 84:

Slide 85:
Question
Which one of these standards is NOT used in the Dallas ICM system?
Answer Choices
- Message Sets for External TMC to TMC Communication (MS/ETMCC)
- Transit Communication Interface Protocol (TCIP)
- 511 Dissemination Interface
- Traffic Management Data Dictionary (TMDD)
Slide 86:
Review of Answers
a) Message Sets for External TMC to TMC Communication (MS/ETMCC)
Incorrect. SmartNET and the Dallas Regional Center-to-Center system utilize the MS/ETMCC in the Dallas ICM system.
b) Transit Communication Interface Protocol (TCIP)
Incorrect. The DART Data Portal utilizes the TCIP for some of its data elements in the Dallas ICM system.
c) 511 Dissemination Interface
Correct! 511 Dissemination Interface is not used in the Dallas ICM system.
d) Traffic Management Data Dictionary (TMDD)
Incorrect. SmartNET utilizes TMDD version 2.1 as the basis of its data dictionary. The Dallas Regional Center-to-Center system is based on TMDD version 2.1, with some localization.
Slide 87:
Module Summary
What We Have Learned
- Defined Integrated Corridor Management (ICM) and ICM concepts and described the benefits of ICM, how ICM works, and the role of standards in ICM
- Identified and described the standards associated with ICM
- Learned about four actual ICM deployments
Slide 88:
Thank you for completing this module.
Feedback
Please use the Feedback link below to provide us with your thoughts and comments about the value of the training.
Thank you!