Module 13: An Introduction to Integrated Corridor Management (ICM)
Student Supplement
(Note: This document has been converted from the Student Supplement to 508-compliant HTML. The formatting has been adjusted for 508 compliance, but all the original text content is included, plus additional text descriptions for the images, photos and/or diagrams have been provided below.)
Module 13: An Introduction to Integrated Corridor Management (ICM)
Table of Contents
Module Description - 2
Introduction/Purpose - 2
Samples/Examples - 2
Reference to Other Standards - 10
Case Studies - 13
Glossary - 21
References - 24
Study Questions - 26
Icon Guide - 27
1. Module Description
Integrated Corridor Management (ICM) focuses on managing a transportation corridor by creating a framework for interaction and coordination among the various agencies that operate facilities along that corridor, including transit agencies and operators. This is in contrast to traditional management, in which individual agencies manage their respective networks (e.g., a highway agency is concerned only with performance on the highway system). With ICM, agencies work together to optimize travel within the corridor by providing travelers with actionable information and implementing innovative operational practices and strategies, enabled by Intelligent Transportation Systems (ITS) technologies. For example, if a highway is experiencing higher than normal traffic (e.g., congestion caused by an accident), a diversion strategy can be crafted to redirect travelers to frontage roads or arterials and/or to park-and-ride lots to take transit.
To plan and implement these strategies, technology often plays a strong role. These technologies include parking management systems, Automatic Vehicle Location (AVL) and Automatic Passenger Counter (APC) technologies on transit, traffic-sensing technology on roads, and methods of information dissemination (e.g., variable message signs, 511, mobile alerts), both for travelers and transportation managers. It is anticipated that having access to and using this information will support better situational awareness and response than before ICM.
2. Introduction/Purpose
Transit agencies can play an important role in the process of improving mobility and reduce congestion on a busy corridor. This module provides an introduction to ICM and provides information on pertinent transit and other standards deployed using ICM case studies. There are four basic concepts within ICM that will be briefly described in this module: (1) Corridor modes of operation; (2) Strategic areas for ICM; (3) Conceptual levels within the corridor; and (4) ICM environment. Further, there are two sites that have fully-deployed ICM systems (Dallas and San Diego) and several others that are being deployed. The characteristics of three ICM systems (Dallas, San Diego and Virginia/DC) will be described in this module.
Finally, ITS standards have the ability to facilitate integration of ICM technologies and systems. Standards for facilities, centers and operators within a corridor support, corridor management strategy, interoperability of systems, control and sharing of technologies and data, and interchangeability of technologies. Several specific standards are considered as a part of ICM strategies, and these will be introduced in this module.
3. Samples/Examples
The U.S. Department of Transportation (USDOT) selected eight "Pioneer Sites" to act as critical partners in the development, deployment and evaluation of Integrated Corridor Management (ICM) strategies designed to help manage congestion in some of our nation's busiest urban corridors. Figure 1 shows the cities that were ICM Pioneer Sites. Dallas and San Diego were then selected as demonstration sites. This module includes more information about ICM in these two sites.
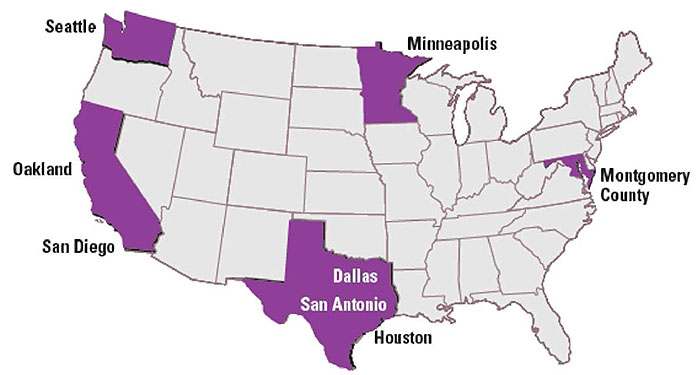
(Extended Text Description: Figure 1. USDOT ICM Pioneer Sites: This is a map of the United States that shows the location of the eight ICM Pioneer Sites. Each state in which there is a Pioneer Site is colored purple: Maryland - Montgomery County was a Pioneer Site; Minnesota – Minneapolis was a Pioneer Site; Texas – Dallas, San Antonio and Houston were Pioneer Sites; California – San Diego was a Pioneer Site and Washington – Seattle was a Pioneer Site.)
Figure 1. US DOT ICM Pioneer Sites1

(Extended Text Description: Figure 2. I-5 Operational Scenario (left is before, right is after): Two maps are displayed in this figure. To the left is a map of the Greater Seattle area. The top of the map is around Everett and the bottom of the map is around Sea Tac. To the right is an identical map, but with a red jagged oval over a small area on the map where there is a truck fire on Northbound I-5.)
Figure 2. I-5 Operational Scenario (left is before, right is after)
Figure 2 shows the location of a sample ICM operational scenario as described in this module.1
1 Dallas, TX, and San Diego, CA were selected to demonstrate ICM concepts that may have applicability to a broad range of corridors around the country.
http://www.its.dot.gov/icms/docs/knowledgebase/HTML/pioneer fact.htm- content is no longer available.
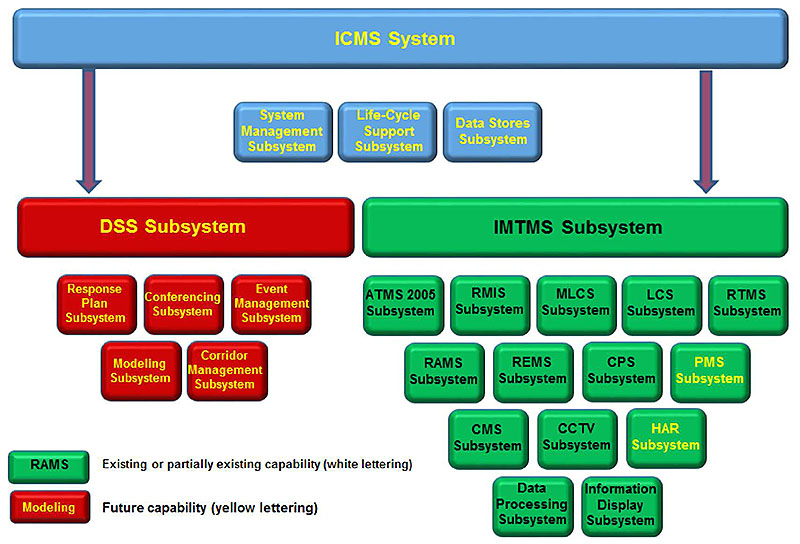
(Extended Text Description: Figure 3. Conceptual Diagram of the San Diego ICM System: This figure has a blue box entitled ICMS in yellow lettering at the top of the slide, with three blue boxes below it. Each of these boxes is entitled in yellow lettering, from left to right, is System Management Subsystem, Life-Cycle Support Subsystem and Data Stores Subsystem. Below these three boxes, but connected to the blue box at the top of the slide are two boxes, both connected by lines from the blue box with arrows pointing to each of the two boxes. The box on the left is red and entitled DSS Subsystem in yellow lettering. The box on the right is green and entitled IMTMS Subsystem in black lettering. The red box is considered an ICMS candidate system to be developed or enhanced. The blue box is the core functionality required under the ICMS delivery. The green box is a subsystem which is currently part of the Regional Intermodal Transportation Management System. Under the red box entitled DSS Subsystem in yellow lettering are three red boxes below it. Each of these boxes is entitled in yellow lettering, from left to right, is Response Plan Subsystem, Conferencing Subsystem and Event Management Subsystem. Below these three boxes are two more red boxes entitled Modeling Subsystem and Corridor Management Subsystem in yellow lettering. Under the green box entitled IMTMS Subsystem in black lettering are five green boxes below it. Each of these boxes is entitled in black lettering, from left to right, is ATMS 2005 Subsystem, RMIS Subsystem, MLCS Subsystem, LCS Subsystem, and RTMS Subsystem. Below these five boxes are four more green boxes entitled RAMS Subsystem, REMS Subsystem, and CPS Subsystem, in black lettering and PMS Subsystem in yellow lettering. Below these four boxes are three more green boxes entitled CMS Subsystem and CCTV Subsystem in black lettering and HAR Subsystem in yellow lettering. Below these three boxes are two more green boxes entitled Data Processing Subsystem and Information Display Subsystem in black lettering. At the bottom left of the slide are two boxes – one is green with black lettering that says RAMS and the other box is red with yellow lettering that says Modeling. The black lettering means existing or partially existing capability, and the yellow lettering means future capability.)
Figure 3. Conceptual Diagram of the San Diego ICM System
Figure 3 is a functional diagram that shows what the I-15 ICM System (ICMS) will do. Those areas of the diagram shaded in GREEN are the subsystems which are currently part of the Regional Intermodal Transportation Management System (i.e., traffic detection systems CCTVs, Ramp Metering System (RES), RAMS, Regional Transit Management System etc.) that are currently being used in the region, although a limited number are still stand-alone. Those shaded RED are considered ICMS candidate systems to be developed or enhanced. Those shaded in BLUE are the core functionality required under the ICMS delivery, and draw upon all underlying subsystems shaded RED or GREEN.
Of note here are the build-out components of a Decision Support subsystem (DSS), and the Modeling subsystem. These subsystems assist the decision making process that will be required for a multi-modal, inter-jurisdictional, and inter-disciplinary coordination, and ICM effort.
Figure 4 shows the Dallas ICM system, which is comprised of three major subsystems. One of the main components of the ICM System is SmartNET/SmartFusion, which gathers data from a variety of sources and delivers it to multiple destinations. Information is gathered from transportation systems, emergency management systems, dispatch systems for law enforcement, and other types of systems. The ICM System then makes this information available via a web server to traditional users such as Traffic Operations Centers, the Media, and Agency and public websites.
Figure 5 shows one of the unique aspects of Dallas' Traveler Information features for the 511, which is the ability to display real time next bus times graphically with maps.
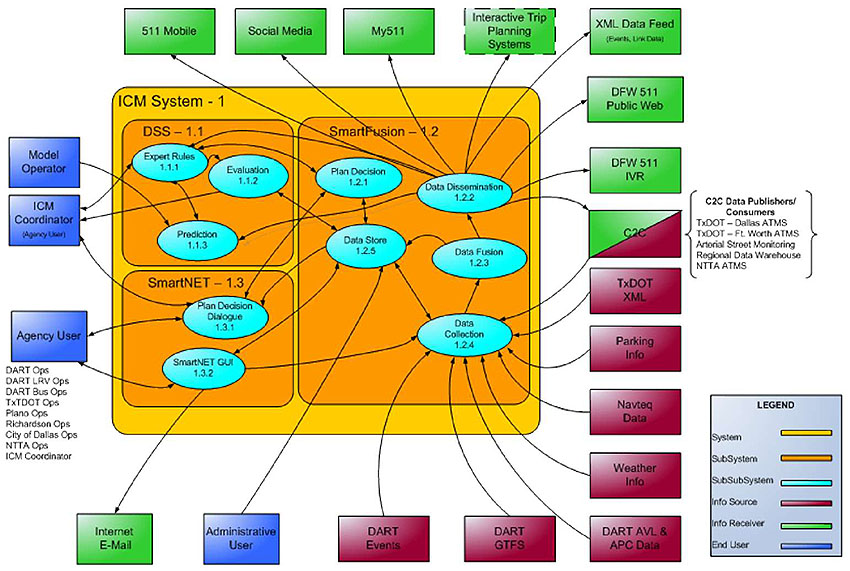
(Extended Text Description: Figure 4. High-Level ICMS Conceptual Diagram. High-Level ICMS Conceptual Diagram (Source: Dallas Area Rapid Transit, March 22, 2013). This diagram is composed of three major areas. The top left area of the graphic is entitled DSS 1.1 and is composed of three connected ovals entitled Expert Rules 1.1.1, Evaluation 1.1.2 and Prediction 1.1.3. The right area of the graphic is entitled Smart Fusion 1.2 and is composed of five connected ovals entitled Plan Decision 1.2.1, Data Dissemination 1.2.2, Data Fusion 1.2.3, Data Collection 1.2.4 and Data Store 1.2.5. The lower left slide of the graphic is entitled SmartNET 1.3 and is composed of two connected ovals entitled Plan Decision Dialogue 1.3.1 and SmartNET GUI. The connections in the graphic can be described as follows:
- There is a line with an arrow going from 1.1.1 to 1.1.2
- There is a line with arrows at both ends going between 1.1.1 and 1.1.3
- There is a line with arrows at both ends going between 1.1.1 and 1.2.1
- There is a line with an arrow going from 1.2.2 to 1.1.1
- There is a line with an arrow going from 1.2.2 to 1.1.3
- There is a line with arrows at both ends going between 1.1.2 and 1.2.5
- There is a line with arrows at both ends going between 1.2.1 and 1.2.5
- There is a line with an arrow going from 1.2.3 to 1.2.2
- There is a line with an arrow going from 1.2.3 to 1.2.5
- There is a line with an arrow going from 1.2.4 to 1.2.3
- There is a line with arrows at both ends going between 1.2.1 and 1.3.1
- There is a line with an arrow going from 1.2.5 to 1.3.1
- There is a line with arrows at both ends going between 1.2.5 and 1.3.2
- There is a line with arrows at both ends going between 1.2.4 and 1.2.5
- There is a line with an arrow going from 1.3.2 to 1.2.4
There are four green boxes above the diagram entitled from left to right: 511 Mobile, Social Media, My511 and Interactive Trip Planning Systems (which is a box with a dashed line around it). Then there are nine boxes to right of the diagram. From top to bottom: the first three boxes are green XML Data Feed (Events, Link Data), DFW 511 Public Web and DFW 511 IVR. The next box is half green and half purple and is entitled C2C. The remaining five boxes are purple and have the following titles: TxDOT XML, Parking Info, Navteq Data, Weather Info and DART AVL and APC Data. Below the diagram are four boxes. From right to left, the boxes are one purple box entitled DART GTFS, one purple box entitled DART Events, one blue box entitled Administrative User, and one green box entitled Internet E-mail. To the left of the diagram are three blue boxes. From bottom to top, they are entitled Agency User, ICM Coordinator (Agency User) and Model Operator. All of these boxes are connected to ovals in the diagram as follows:
- There is a line with an arrow going from 1.2.2 to 511 Mobile
- There is a line with an arrow going from 1.2.2 to Social Media
- There is a line with an arrow going from 1.2.2 to My511
- There is a line with an arrow going from 1.2.2 to Interactive Trip Planning Systems
- There is a line with an arrow going from 1.2.2 to XML Data Feed (Events, Link Data)
- There is a line with an arrow going from 1.2.2 to DFW 511 Public Web
- There is a line with an arrow going from 1.2.2 to DFW 511 IVR
- There is a line with an arrow going from 1.2.2 to C2C
- There is a line with an arrow going from C2C to 1.2.4
- There is a line with an arrow going from TxDOT XML to 1.2.4
- There is a line with an arrow going from Parking Info to 1.2.4
- There is a line with an arrow going from Navteq Data to 1.2.4
- There is a line with an arrow going from Weather Info to 1.2.4
- There is a line with an arrow going from DART AVL and APC Data to 1.2.4
- There is a line with an arrow going from DART GTFS to 1.2.4
- There is a line with an arrow going from DART Events to 1.2.4
- There is a line with an arrow going from Administrative User to 1.2.5
- There is a line with an arrow going from 1.3.2 to Internet E-mail
- There is a line with arrows at both ends going between Agency User and 1.3.2
- There is a line with arrows at both ends going between Agency User and 1.3.1
- There is a line with arrows at both ends going between ICM Coordinator (Agency User) and 1.3.1
- There is a line with arrows at both ends going between ICM Coordinator (Agency User) and 1.1.1
- There is a line with an arrow going from 1.1.2 to ICM Coordinator (Agency User)
- There is a line with an arrow going from Model Operator to 1.1.3
Figure 4. High-Level ICMS Conceptual Diagram (Source: Dallas Area Rapid Transit, March 22, 2013)
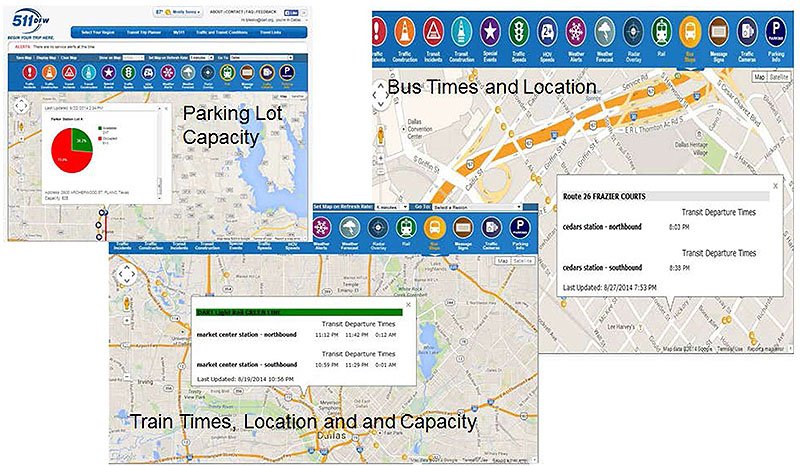
(Extended Text Description: Figure 5. Real Time Transit Data Used for ICM and 511DFW. This figure is a collage of three slides in the presentation, all entitled Dallas – Demonstration Site, subtitled Real Time Transit Data Used for ICM and 511DFW. The three graphics are described as follows. The first graphic has a map of Dallas in the background and in the foreground, there is a window that has the following words DART Light Rail GREEN LINE on the first line, and then shows Transit Departure Times for Market Center Station Northbound of 11:12pm, 11:42pm and 01:12am, for Market Center Station Southbound of 10:59pm, 11:29pm and 0:01am. Above the window are the words Train Times, Location, and Capacity. At the top of the graphic are the following icons: Traffic Incidents, Traffic Construction, Transit Incidents, Transit Construction, Special Events, Traffic Speeds, HOV Speeds, Weather Alerts, Weather Forecast, Radar Overlay, Rail Bus Stops, Message Signs, Traffic Cameras and Parking Info. The second graphic has a map of Dallas in the background and in the foreground, there is a window that shows the parking lot capacity at Parker Station Lot A in a pie chart that shows 73.8% or 611 spaces occupied and 26.2% or 217 spaces available. At the top of the graphic are the following icons: Traffic Incidents, Traffic Construction, Transit Incidents, Transit Construction, Special Events, Traffic Speeds, HOV Speeds, Weather Alerts, Weather Forecast, Radar Overlay, Rail Bus Stops, Message Signs, Traffic Cameras and Parking Info. The third graphic has a map of Dallas in the background and in the foreground, there is a window that shows Bus Times and Location for Route 26 Frazier Courts as follows: at Cedar Station Northbound at 8:03pm and Cedar Station Southbound at 8:38pm. At the bottom of this window, it says Last Updated 8/27/2014 7:53pm. At the top of the graphic are the following icons: Traffic Incidents, Traffic Construction, Transit Incidents, Transit Construction, Special Events, Traffic Speeds, HOV Speeds, Weather Alerts, Weather Forecast, Radar Overlay, Rail Bus Stops, Message Signs, Traffic Cameras and Parking Info.)
Figure 5. Real Time Transit Data Used for ICM and 511DFW
(Extended Text Description: Figure 6. Example of ITS Integration Using NTCIP. This figure shows center to center (C2C) communications. The center of the diagram is an oval that is entitled C2C Message Sets. Under the words C2C Message Sets are following: Traffic Management, Incident Management, Transit Management, Traveler Information, Intermodal Network Management (Global) and Other. Emanating from this oval are numerous boxes that represent various types of systems. Starting from the far left of the diagram is a box entitled Emergency Management Systems – it is connected to the C2C oval by a line. The other boxes connected to the C2C oval counterclockwise from the Emergency Management Systems box are called Freeway System, Railroad System, Streets System A, Parking System, Streets System B, Transit System B, Transit System A, and Traveler Info Clearinghouse. There are six boxes connected to the Traveler Information Clearinghouse, with the following titles: Roadside Services, Weather, Airports, Seaports, Car Rental and Events. These six boxes are to the left of the Traveler Information Clearinghouse box. There is one box to the right of and connected to the Traveler Information Clearinghouse box entitled Traveler Service Providers.)
Figure 6. Example of ITS Integration Using NTCIP illustrates how various transportation management systems and devices can be integrated using NTCIP.
(Extended Text Description: Figure 7. I-80 Systems Integration. This figure has a graphic that shows elements of their Virtual Private Network. In the middle of the diagram, it says Virtual Private Network. Emanating from the middle of the diagram are the following elements (starting at a noon position moving clockwise): Smart Corridor building, City of Pinole, WESTCAT, Contra Costa County, City of Hercules, City of San Pablo, City of Richmond, City of El Cerrito, City of Albany, City of Emeryville, City of Berkeley, AC Transit, and Oakland TMC. Each of these elements are connected to the center of the diagram with lines that represent High Speed Internet Connections. The Smart Corridor building is connected to Caltrans District 4 with a line representing OPT-E-MAN link. The City of Pinole is connected to Pinole Police Dep with a line representing a Fiber Optic link. The City of San Pedro is connected to San Pedro Police Dep with a line representing a Fiber Optic link. The City of Richmond is connected to Richmond Police Dep with a line representing a Fiber Optic link. The City of El Cerrito is connected to El Cerrito Police Dep with a line representing a Fiber Optic link.)
Figure 7. I-80 Systems Integration shows a schematic of the I-80 system integration among various cities, AC Transit, emergency management and Caltrans. System operations are automated, traffic management is coordinated along the corridor and there is information sharing among agencies.
4. Reference to Other Standards
This section contains additional information about the standards described in this module.
4.1. National Transportation Communications for ITS Protocol (NTCIP)
-
Center to Field (C2F) Communications Examples:
- Computer change signal timings as traffic conditions change, and controllers send status and traffic flow information to computer
- On-board vehicle transit system communicating with traffic signal device to facilitate transit priority
- Freeway management system communicating with detectors and ramp meters on freeways
- Traffic management system controlling various types of infrastructure
-
Center to Center (C2C) Communications Examples:
- Two traffic management centers that exchange real-time information about inventory and status of traffic control devices
- Two or more traffic signal systems exchanging information to achieve coordinated operation of traffic signals managed by different systems and to enable personnel at one center to monitor status of signals operated from another center
- Transit system reporting schedule adherence exceptions to transit customer information system and regional traveler information system, while also asking traffic signal management system to instruct signals to give priority to behind-schedule transit vehicle
- Emergency management system reporting an incident to freeway management system, to traffic signal management system, to two transit management systems and to traveler information system
- Freeway management system informing an emergency management system of a warning message just posted on a dynamic message sign on the freeway in response to its notification of an incident
- Weather monitoring system informing a freeway management system of ice forming on the roadway so that the freeway management system is able to post warning messages on dynamic message signs as appropriate
4.2. NTCIP 1211 v02 - Object Definitions for Signal Control and Prioritization (SCP)
- Provides vocabulary necessary for traffic management centers, including:
- Traffic management
- Emergency management
- Transit management
- Other fleet management centers and their respective vehicles
To interact with, control, manage, and monitor transportation signal controllers implementing vehicle prioritization schemes
- Includes description of signal control and prioritization scenarios and possible configurations
- Contains object definitions to support functionality of each scenario, conformance group requirements and conformance statements to support compliance with standard
4.3. Advanced Transportation Controller (ATC)
-
ITE ATC Family of standards:
- Defines field controller devices used in traffic management applications, particularly (but not exclusively) for traffic signal control
-
Has two types of users: Operational and Developers
- Operational users: transportation and traffic engineers and technicians (or their consultants) who design, specify, procure, implement, operate, and maintain ITS field controller units
- Developers: manufacturers who design, develop, and manufacture the field equipment in addition to software developers who design, develop, and program the software applications to run on it
-
Three components of ATC are:
- Controller
- Cabinet
- Software
- Standards define initial modular ATC software platform for Applications Programming Interface (API) (see slide 31), Cabinet and Controller
- ATC Family describes open architecture field control devices and software applications that run on them
4.4. ATC Cabinet
- ITS Cabinet specifies functional physical design requirements for ITS cabinet that supports deployment of multiple ITS functions in single cabinet
-
Defines major components installed in a cabinet:
- Controller
- Input Assembly(s)
- Output Assembly(s)
- Power Distribution Assembly
- Service Panel Assembly
- DC Power/Communications Assembly & Extension
- RAW/CLEAN AC Power Assembly & Extension
- Cabinet Monitoring System
- Optionally, a Fiber Optic Splice Tray
- Includes other components, including traffic detectors, traffic signal load switches, malfunction monitors (that monitor the output of the cabinet for safety), fail-safe controls such as malfunction flash operation, special detection equipment, lightning protection, and power management
- Three standard cabinet assemblies are defined
4.5. NTCIP Center-to-Center (C2C)
- C2C communications is type of communication involving messages sent between two or more center systems
- Involves peer-to-peer communications between any number of center systems in a many-to-many network
- Type of communication similar to Internet
-
Examples of C2C communications:
- Two traffic management centers that exchange real-time information about inventory and status of traffic control devices
- Two or more traffic signal systems exchanging information to achieve coordinated operation of traffic signals managed by the different systems
- Transit system reporting schedule adherence exceptions to transit customer information system and to a regional traveler information system, while also asking a traffic signal management system to instruct its signals to give priority to a behind-schedule transit vehicle
- Emergency management system reporting an incident to a freeway management system, to a traffic signal management system, to two transit management systems and to a traveler information system
- Freeway management system informing an emergency management system of warning message just posted on DMS on freeway
- Weather monitoring system informing freeway management system of ice forming on roadway so that warning messages are posted on DMS as appropriate
5. Case Studies
5.1. San Diego
The San Diego ICM Corridor covers a 21-mile segment of I-15 and runs from SR-78 in the north to SR-163 interchange in the south. It serves commuter, goods, and services movement from northern San Diego to the downtown area. Weekday traffic volumes range from 170,000 to 290,000 vehicles on general purpose lanes. Managed Lanes and Bus Rapid Transit (BRT) operate in the Managed Lanes. Dynamic variable pricing in the managed Lanes will help manage traffic flow.
San Diego's ICMS aims to proactively and collaboratively manage the I-15 corridor to maximize transportation system performance and enable travelers the opportunity to make convenient shifts among modes and routes.
Improved mobility for people, goods, and services will be achieved by improving current levels of system integration and through continued collaboration among the corridor's institutional partners and their native functional environments or systems. With ICM, actions taken by individual agencies or networks will be made based on the condition of and the impact on the entire corridor.
All corridor operations will be coordinated through the ICMS where corridor networks and agencies will share data and information and make changes for the benefit of the corridor's operations. For example, operations personnel will adjust traffic signals and ramp meters to direct travelers to High-Occupancy Toll (HOT) lanes, bus rapid transit and other operations tools as needed. The DSS will forecast corridor performance problems and recommend response plans allowing proactive courses of action. Who's involved? The I-15 ICM Demonstration is a collaborative effort led by the San Diego Association of Governments (SANDAG) in collaboration with the U.S. DOT, California Department of Transportation (Caltrans), the Metropolitan Transit System, the North County Transit District, and the cities of San Diego, Poway, and Escondido.
The ICM project leverages the region's extensive Intelligent Transportation System (ITS) modal networks to measure and manage performance from a corridor perspective. Existing assets include the Intermodal Transportation Management System (IMTMS), Regional Arterial Management System (RAMS), Advanced Freeway Traffic Management System (ATMS), Regional Transit Management System (RTMS), 511 advanced traveler information system, and FasTrak®. ICM enables multiple systems to "talk" to each other to coordinate operations and maximize efficiency regardless of who owns or operates the individual system; monitors changing conditions and congestion based on real-time information; generates automated response plans; and reevaluates and generates new response plans as traffic conditions change. Operations in the corridor are managed using a Decision Support System (DSS), the first of its kind developed in the nation, to assist operators with prediction and evaluation of complex traffic interactions and coordinate selection of appropriate multi-network response strategies to manage congestion during commute times or major incidents. Similar to earthquake or tsunami prediction systems, the DSS uses predictive algorithms and modeling tools to forecast corridor performance problems and recommend response plans. Predictions and recommendations are generated in 15-, 30-, and 60-minute horizons based on real-time and historical performance data. As a result, local transportation managers are able to carry out a coordinated response.
The standards in use or planned for use in developing ICMS subsystem interfaces are as follows:
-
Interface: Intermodal Transportation Management System (IMTMS) Distribution:
- TMDD
- NTCIP 2306
- IMTMS Systems Design Document (SDD) - Section 4 2.1 Draft 1.0
-
511 Dissemination:
- TMDD
- NTCIP 2306
- IMTMS-511 Interface Design Document (IDD) 2.1 Draft 1.0
- OrbCAD (RTMS) Interface Control Document (ICD) FE-ICD202 1.0
The deployed I-15 ICM system has demonstrated its ability to:
- Identify incidents and unusual congestion events
- Develop traffic management strategies integrating freeway, arterial, and transit operational elements
- Implement recommended strategies either automatically or following approval by relevant system operators
The system has also demonstrated the feasibility of using a microscopic traffic simulation model in a real-time operational environment to forecast corridor operations under alternative scenarios. Simulation evaluations have further consistently shown operational benefits exceeding deployment costs.
5.2. Dallas
The Dallas ICM Corridor covers a 28-mile segment of US-75 and is the primary connector between Dallas and northern suburbs. It serves commuter, commercial, and regional trips. Weekday mainline traffic volumes reach 250,000 vehicles with 30,000 on frontage roads. There are 167 miles of arterial roadways. And there are High Occupancy Vehicle (HOV) lanes, Light Rail Transit (LRT), Bus Service, and Park-and-Ride lots.
The Corridor for the Dallas Pioneer Project is the US-75 Corridor (aka the North Central Expressway Corridor). This Corridor is a major north-south radial Corridor connecting downtown Dallas with many of the suburbs and cities north of Dallas. The primary Corridor consists of a freeway, continuous frontage roads, light-rail line, transit bus service, park-and-ride lots, major regional arterial streets, toll roads, bike trails, and intelligent transportation systems. A concurrent-flow, high-occupancy vehicle lane in the Corridor, opened in December 2007, added significant expansion of the intelligent transportation systems for the freeway and arterials street systems are programmed. The US-75 Corridor has been defined at two levels. The immediate Corridor consists of the primary freeway Corridor and light-rail line Corridor and all arterial streets within approximately two miles of the freeway, as described above. In addition, a full "travel shed" influence area has been defined that includes additional alternate modes and routes that may be affected by a major incident or event. The travel shed area is generally bound by the downtown to the south, the Dallas North Tollway to the west, SH 121 to the north, and a combination of arterials streets and the DART Blue Line to the east. This US-75 Corridor contains Dallas' first major freeway completed around 1950. This section of freeway was totally reconstructed with cantilevered frontage roads over the depressed freeway section and re-opened in 1999 with a minimum of eight general purpose lanes. The freeway main lanes carry over 250,000 vehicles a day, with another 20,000-30,000 on the frontage roads. The Corridor also contains the first light-rail line constructed in Dallas, part of the 20-mile DART starter system, opened in 1996. The Red Line now expands into cities of Richardson and Plano and passes next to the cities of Highland Park and University Park. This facility operates partially at-grade and partially grade separated through deep-bored tunnels under US-75. There is also another rail line, the Blue Line, which operates in the US-75 Corridor near downtown Dallas and extends along the eastern edge of the Corridor boundary. In the downtown, there is also a connection from these lines to the regional commuter rail line that extends to downtown Fort Worth. The Corridor serves commuting trips into downtown Dallas via the freeway, bus routes, light-rail line, and arterial streets. There are also a significant number of reverse commuters traveling to commercial and retail developments in the northern cities and neighborhoods. The Corridor also serves significant regional traffic during off-peak periods. The freeway is a continuation of Interstate 45; and thus, it also serves interstate traffic into Oklahoma. The Corridor is also a major evacuation route and experienced significant volumes during the Hurricane Rita evacuation in 2005. There are three major freeway interchanges in the Corridor. US-75 has an interchange with the downtown freeway network connecting to Interstate 45 and Interstate 35E. At the midpoint in the Corridor, there is a newly constructed interchange with Interstate 635. In the northern section, there is an interchange with the President George Bush Turnpike (PGBT).
The US-75 ICM Project is a collaborative effort between Dallas Area Rapid Transit (DART), City of Dallas, Town of Highland Park, North Central Texas Council of Governments (NCTCOG), North Texas Tollway Authority (NTTA), City of Plano, City of Richardson, Texas Department of Transportation (TxDOT), the City of University Park and many local emergency service providers. The Team defined the Vision for the Corridor as "Operate the US-75 Corridor in a true multimodal, integrated, efficient, and safe fashion where the focus is on the transportation customer."
Using the Vision Statement as a starting point, the US-75 Steering Committee developed four primary Goals for the ICM:
- Increase corridor throughput
- Improve travel time reliability
- Improved incident management
- Enable intermodal travel decisions
The ICM system is comprised of three major subsystems, as shown in this Figure 4. One of the main components of the ICM System is SmartNET/SmartFusion, which gathers data from a variety of sources and delivers it to multiple destinations. Information is gathered from transportation systems, emergency management systems, dispatch systems for law enforcement, and other types of systems. The ICM System then makes this information available via a web server to traditional users such as Traffic Operations Centers, the Media, and Agency and public websites. The main purpose of the Dallas ICM System is to:
- Provide an integrated platform for coordinating responses to incidents, construction, and special events in the corridor
- Provide an information exchange tool based on center-to-center standards, and Traffic Management Data Dictionary (TMDD)
- Provide a data fusion engine for the corridor to feed information to the regional 511DFW systems
- Provide DSS real-time information on incidents, construction, special events, transportation network status, and device status throughout the corridor
- Provide a response plan coordination tool for multiple agencies to coordinate actions in responding to incidents within the corridor
One of the unique aspects of the Traveler Information features for the 511 is the ability to display real time next bus times graphically with the maps.
The standards used in the Dallas ICM system are as follows:
- Traffic Management Data Dictionary (TMDD) - SmartNET utilizes TMDD version 2.1 as the basis of its data dictionary. The Dallas Regional Center-to-Center system is based on TMDD version 2.1, with some localization
- Message Sets for External TMC to TMC Communication (MS/ETMCC) - SmartNET and the Dallas Regional Center-to-Center system utilize the Message Sets for External TMC to TMC Communication
- Transit Communication Interface Protocol (TCIP) - The DART Data Portal is envisioned to utilize the Transit Communication Interface Profile for some of its data elements
The following are the benefits from the Dallas ICM project:
- Reduced congestion 740,000 person-hours saved / year
- Travel time reliability improved by 3%
- Fuel savings of 981,000 gallons annually
- Emissions reduction of 9,400 tons annually
- Benefit/Cost ratio of 20:1
Also, there are a number of lessons learned that are worthwhile mentioning:
- Since ICM projects are time consuming, requires significant funding and long term commitment of staff time, it needs to be part of the Regional ITS strategic plan.
- You need to plan for future growth upfront as you plan ICM.
- Deal with institutional issues upfront. Dallas thought they had, but really probably didn't adequately address the institutional issues fully. Develop ILA's if possible before you commit to ICM. "The lessons learned for the overall [Dallas] project deal mostly with the institutional issues and relationships which any region considering ICM should address. ICM programs should build on existing institutional arrangements; this is a key to building consensus. By setting expectations, and defining roles and responsibilities, regions can address the institutional issues of ICM from the beginning of the program. For ICM programs to be successful all agencies involved need to be committed to the program, and have some benefit to their agency in order for ICM programs to succeed." (Final Report: Dallas Integrated Corridor Management (ICM) Demonstration Project, page 29)
- Finally, sharing data is relatively non-controversial. However, institutional objectives sometimes trump the ICM mobility objectives. Some agencies chose not to share incident or ATMS information for business reasons that weakens the value to the product.
5.3. I-80 Integrated Corridor Mobility (ICM)/ Smart Corridor Project
This ICM Corridor covers the following:
- 20 mile corridor from Bay Bridge to the Carquinez Bridge
- Major corridor for commuters and transit
- National freight corridor
- Link to 2 international airports and the Port of Oakland
- Connects significant job centers (Alameda County ranked 2nd largest in Region)
- Spans across 2 counties and 9 cities
The selected corridor is:
- Not only a major corridor for cars and transit but also for freight
- Connection to 2 major airports
- Port of Oakland
- Major job centers
- Across many jurisdictions
The vision of this ICM project is as follows:
- Create a Well Balance System
- Maintain Optimal Operational Viability
- Proactively Avoid Flow Breakdown
- Detect and Respond to Congestion Events Faster
- Improve Safety
- Manage Congested Flow When it Does Occur
- Promote Transit Ridership and Mode Shifts
- Clear Local Arterials from Diversion
The vision of the Smart Corridor Project is to address these conditions on I-80:
- Over 20,000 vehicle-hours of delay per day
- Inconsistent level of service (C to F)
- Variable speeds (stop & go to 65 mph)
- High incident rates: over 2,000 incidents annually
- Un-reliability of travel (20 to>60 min)
The project concepts that are being deployed are as follows:
- Freeway & Incident Management
- Adaptive Ramp Metering
- Arterial Management
- Traveler Information
- Traffic Monitoring
-
Transit Management:
-
Preferential Treatment for Transit
- Transit Signal Priority
- Ramp Meter Bypass
-
Park and Ride Facilities (future)
- Provide Real-time information
-
Transit Traveler Information
- Travel times
- Directions to transit facilities
- Real time Transit Departure Times
-
Preferential Treatment for Transit
In the transit management area, Transit Signal Priority is deployed on:
- San Pablo
- Crossing arterials
- Ramps with HOV Bypass lanes
This gives preferential treatment to buses at signals. The system is integrating with Park & Ride facilities, as well as the Bay Area 511 system and real-time transit information.
Figure 7 shows a schematic of the system integration among various cities, AC Transit, emergency management and Caltrans.
- System operations are automated
- Traffic management is coordinated along the corridor
- There is information sharing among agencies
As of April 29, 2015, signs are being tested on Westbound I-80. The installation of overhead signs across westbound I-80 between Richmond and Emeryville has been completed, and the new signs are being tested. Testing will continue intermittently through the summer, and will take place when traffic volumes are lowest. Motorists traveling the corridor during these times may see the word "TEST" displayed on overhead signs to warn motorists that electronic signs are being tested. Other symbols and numbers may be momentarily visible as well, such as green arrows, yellow arrows, red X's, checkerboard patterns or electronic speed limit signs displaying various numbers. Motorists will be notified of testing by changeable message signs at the side of the roadway. Roadside electronic speed limit signs are also being tested.
5.4. NY/NJ ICM-495 Project
The ICM-495 corridor is centrally located in New York / New Jersey metropolitan area with population of over 20 million people. The Corridor connects the New Jersey Turnpike (NJTP, a section of I-95) to Van Wyck Expressway (I-678) and traverses Midtown Manhattan. There are diverse residential, commercial and industrial uses that interact with the Corridor along its entire length. There are two regional key facilities - Lincoln Tunnel (connects NJ and Manhattan), and Queens-Midtown Tunnel (connects Manhattan and Queens). The Corridor encompasses an extensive highway network, including expressway facilities, their approach roads, and the surrounding principal and secondary arterial networks providing the circulatory system for the movement of people, goods, and services.
The vision of this project is to enhance the current transportation management systems of the ICM-495 Corridor by using state of practice solutions to build integrated, balanced, responsive, efficient, effective, and equitable programs and systems that actively reduce traveler demand; monitor and control traffic; and improve the mobility, reliability, and safety of all users. Solutions and resources will create a balanced network that reflects integration of pre-existing programs and systems with modified and new deployments. Improving overall Corridor performance will be a priority by providing better knowledge about real-time conditions and alternative travel options within practical operational, institutional, and financial constraints.
There are two key facilities and their infrastructure that will be leveraged:
-
The Queens Midtown Tunnel is a highway tunnel and toll road in New York City. The deployed ITS assets along the Queens Midtown Tunnel include:
- CCTV cameras and Fiber
- Weather System covering all the bridge facilities with both surface and atmospheric sensors
- NTCIP complaint VMS and VSLS
- TRANSMIT System
- Lane Use Signal Control System
- Video Incident Detection
- Advanced Traffic Information System
- The Operations Central Command Center (OCCC) is the nerve center of MTA B&T Operations, including linkages to individual facilities and the JTMC Integrates all the facilities to one another and to OCCC
-
The Lincoln Tunnel connects NJ 495 to Midtown Manhattan. The three-tube configuration of the Lincoln Tunnel provides for unique operational flexibility. The directional ability of the tubes enables the tunnel facility to address varying traffic demands as they arise throughout the day. The Lincoln Tunnel ITS assets monitored and controlled from the communications desk include:
- Dynamic Message Signs
- CCTV surveillance cameras
- Lane-Use Control Signals
- Changeable Speed Limit Signs
- Video-based vehicle detection system stations
- TRANSMIT readers
ICM-495 will leverage and build upon ongoing programs, as follows:
- Congestion Management Process
- Drivers First Initiative
- Drive Smart & Bike Share
- I-495 Managed Use Lane
- Midtown in Motion
- New York & New Jersey 511 and Rideshare
- New York & New Jersey ITS Programs
- Off-Hour Deliveries
- PARK Smart
- Select Bus Service
- Smart Move Program
- Truck Routing and Bridge Strike Mitigation
6. Glossary
| Term | Definition |
|---|---|
| Actuated Traffic Signal Controller (ASC) | Traffic signals operate in either pre-timed or actuated mode or some combination of the two. Actuated control can be characterized as fully-actuated or semi-actuated, depending on the number of traffic movements that are detected. Semi-actuated control uses detection only for the minor movements at an intersection. Fully-actuated control refers to intersections for which all phases are actuated and hence, it requires detection for all traffic movements. |
| Advanced Transportation Controller (ATC) | A field-hardened computer for embedded applications which, with the appropriate software and hardware modules, can perform many different ITS functions. The ATC Controller is made up of a central processing unit (CPU), an operating system (OS), memory, external and internal interfaces, and other associated hardware necessary to create an embedded transportation computing platform for control of field devices. |
| Advanced Traveler Information System (ATIS) | Any system that acquires, analyzes, and presents information to assist surface transportation travelers in moving from a starting location (origin) to their desired destination. Advanced Traveler Information Systems are aimed at providing users of the transportation system with more information to make decisions about route choices, estimate travel times, and avoid congestion. |
| Application Programming Interface (API) | A system of tools and resources in an operating system, enabling developers to create software applications. |
| Advanced Transportation Controller (ATC) | Transportation field device. |
| Bus Rapid Transit (BRT) | BRT is a high-quality bus-based transit system that delivers fast, comfortable, and cost-effective services at metro-level capacities. It does this through the provision of dedicated lanes, with busways and iconic stations typically aligned to the center of the road, off-board fare collection, and fast and frequent operations. |
| Closed-circuit television (CCTV) | The use of video cameras to transmit a signal to a specific place, on a limited set of monitors. |
| Dynamic Message Signs (DMS) | Traffic control devices used to provide motorist en route traveler information. They are commonly installed on full-span overhead sign bridges, post-mounted on roadway shoulders, and overhead cantilever structures. |
| High Occupancy Vehicle (HOV) | A motor vehicle with seating for several passengers, especially one that is carrying carpoolers. |
| Integrated Corridor Management (ICM) | Integrated Corridor Management (ICM) is a promising tool in the congestion management toolbox that seeks to optimize the use of existing infrastructure assets and leverage unused capacity along our nation's urban corridors. With ICM, transportation professionals manage the transportation corridor as a multimodal system rather than taking the more traditional approach of managing individual assets. |
| Integrated Corridor Management System (ICMS) | System that is used to support transportation network managers and operators in applying ICM. |
| Location Referencing Message Specification (LRMS) | Describes a set of standard interfaces for the transmission of location references among different components of Intelligent Transportation Systems (ITS). The LRMS facilitates the movement of ITS data on a transportation network, providing a common language for the expression of location among the different components. LRMS interfaces define standard meanings for the content of location reference messages, and standard, public domain formats for the presentation of location references to application software. |
| Mark-Up Language for Transportation Information (MULTI) | A message syntax which allows objects to be grouped into a message object. The message object is analogous to a sentence in that both the message object and a sentence require a syntax, or ordering of the information objects (words), to be understood. |
| National Transportation Communications for ITS Protocol (NTCIP) | The National Transportation Communications for ITS Protocol (NTCIP) family of standards defines protocols and profiles that are open, consensus-based data communications standards. When used for the remote control of roadside and other transportation management devices, the NTCIP-based devices and software can help achieve interoperability and interchangeability. |
| Ramp Meter Control (RMC) | Ramp metering can be defined as a method by which traffic seeking to gain access to a busy highway is controlled at the access point via traffic signals. This control aims at maximize the capacity of the highway and prevent traffic flow breakdown and the onset of congestion. Ramp metering is the use of traffic signals to control the flow of traffic entering a freeway facility. |
| Signal Control and Prioritization (SCP) | SCP operates in the context of a "system" that includes a priority requester, such as a transit vehicle, traffic signal controllers, and the management centers that configure and monitor the traffic signal controllers. It, therefore, imposes functional and communications requirements on all of these "system" components. |
| Signal Systems Master (SSM) | A method of interconnecting several signalized intersections with a master. The master provides a synchronization pulse and selects timing patterns to efficiently move platoons of vehicles through the system. Timing pattern selection through the master can be accomplished manually, by time of day or through traffic responsive means. In a closed loop system local controllers communicate with the master, sending back information regarding their operation. |
| Traffic Management Data Dictionary (TMDD) | TMDD Standards were developed to support center-to-center communications as part of the regional deployment of ITS in order for centers to cooperate in the management of a corridor, arterial, incident mitigation, event management, etc. Hence the TMDD provides the dialogs, message sets, data frames, and data elements to manage the shared use of these devices and the regional sharing of data and incident management responsibility. As a result, the TMDD standards often reference elements of the NTCIP standards, but deal with the devices at a higher level of abstraction. |
| Transit Communications Interface Profiles (TCIP) | TCIP is an interface standard whose primary purpose is to define standardized mechanisms for the exchange of information in the form of data among transit business systems, subsystems, components, and devices. The TCIP standard specifies the rules and terms for the automated exchange of information in transit applications such as operations, maintenance, planning, management, and customer services. |
| Transportation Sensor System (TSS) | Any system capable of sensing and communicating near real-time traffic parameters using NTCIP. |
7. References
"Integrated Corridor Management in Action," http://www.its.dot.gov/icms/icm inaction.htm- content is no longer available.
"Managing Congestion with Integrated Corridor Management (ICM)," http://www.its.dot.gov/icms/docs/cs over final.pdf- content is no longer available.
"Integrated Corridor Management (ICM) Demonstration Sites," http://www.its.dot.gov/factsheets/pdf/ICM DemoSites V7.pdf
Paul Gonzalez, Dawn Hardesty, Greg Hatcher, Michael Mercer, and Michael Waisley, "Integrated Corridor Management: Implementation Guide and Lessons Learned," Version 1.1, prepared for U.S.
Department of Transportation, ITS Joint Program Office, February 2012, FHWA-JPO-12-075, http://ntl.bts.gov/lib/47000/47600/47670/FHWA-JPO-12-075 FinalPKG 508.pdf- content is no longer available.>
"Integrated Corridor Management Concept Development and Foundational Research: Technical Memorandum, Task 2.3 � ICMS Concept of Operations for a Generic Corridor," April 18, 2006
"Integrated Corridor Management Standards," http://www.its.dot.gov/icms/stand.htm- content is no longer available.
National Transportation Communications for ITS Protocol: The NTCIP Guide, NTCIP 9001 version v04, July 2009, ©2009, https://www.ntcip.org/library/documents/pdf/9001v0406r.pdf- content is no longer available.
NTCIP 1202:2005, National Transportation Communications for ITS Protocol Object Definitions for Actuated Traffic Signal Controller (ASC) Units - version 02, https://www.nema.org/Standards/ComplimentaryDocuments/NTCIP-1202-2005-2.pdf- content is no longer available.
"NTCIP 1210 - Field Management Stations (FMS) - Part 1: Object Definitions for Signal System Masters," https://www.standards.its.dot.gov/Factsheets/Factsheet/88
"NTCIP 1211 - Object Definitions for Signal Control and Prioritization (SCP)," https://www.standards.its.dot.gov/Factsheets/Factsheet/89
"ITE Advanced Transportation Controller (ATC) Family of Standards," https://www.standards.its.dot.gov/Factsheets/Factsheet/14
"NTCIP 1203 - Object Definitions for Dynamic Message Signs (DMS)," https://www.standards.its.dot.gov/Factsheets/Factsheet/23
"Module 40 - A309a: Understanding User Needs for Ramp Meter Control (RMC) Units Based on NTCIP 1207 v02 Standard," StandardsTraining/mod40/sup/m40sup.htm
"NTCIP 1209 - Object Definitions for Transportation Sensor Systems (TSS)," https://www.standards.its.dot.gov/Factsheets/Factsheet/87
"Transit Communications Interface Profiles (TCIP) Standard Development Program, APTA-TCIP-S-01 4.2.0," http://www.aptatcip.com/- content is no longer available.
"SAE J2354 - Message Set for Advanced Traveler Information System (ATIS)," https://www.standards.its.dot.gov/Factsheets/Factsheet/54
"SAE J2266 - Location Referencing Message Specification (LRMS)," https://www.standards.its.dot.gov/Factsheets/Factsheet/92
"NTCIP 1205 - Object Definitions for Closed Circuit Television (CCTV) Camera Control," https://www.standards.its.dot.gov/Factsheets/Factsheet/83
"Integrated Corridor Management (ICM): Demonstration Sites," USDOT, FHWA-JPO-11-111, https://www.sandag.org/uploads/projectid/projectid 429 15373.pdf
"I-15 Integrated Corridor Management Project," presentation for MICM Workshop, December 2007, http://www.dot.ca.gov/newtech/modal/micm/icm-jb-draft-sjohnson.ppt
"I-15 Integrated Corridor Management - Frequently Asked Questions," December 2015, https://www.sandag.org/uploads/projectid/projectid 429 20192.pdf
"System Requirement Specification for the I-15 Integrated Corridor Management System (ICMS) in San Diego, California," prepared for U.S. Department of Transportation, Research and Innovative Technology Administration, ITS Joint Program Office, March 31, 2008, FHWA-JPO-08-044, EDL Number 14424, http://ntl.bts.gov/lib/30000/30800/30840/sd reqments.pdf- content is no longer available.
San Diego I-15 Demonstration Integrated Corridor Management System: PATH Report on Stage 3: Site Demonstration and Evaluation, http://escholarship.org/uc/item/7f96m702
"Concept of Operations for the US-75 Integrated Corridor in Dallas, Texas," prepared for U.S. Department of Transportation Research and Innovative Technology Administration ITS Joint Program
Office, April 30, 2008, FHWA-JPO-08-004, EDL Number 14390, http://ntl.bts.gov/lib/30000/30400/30409/14390 files/14390.pdf- content is no longer available.
Miller, Kevin; Bouattoura, Fariel; Macias, Roberto; Poe, Chris; Le, Minh; and Plesko, Todd, "Dallas Integrated Corridor Management (ICM) Demonstration Project," Final Report, prepared for USDOT, ITS JPO, August 13, 2015, FHWA-JPO-16-234http://ntl.bts.gov/lib/56000/56700/56759/FHWA-JPO-16-234 v1.pdf- content is no longer available.
"Dallas Integrated Corridor Management System Lessons Learned," presentation for ICM Deployers' Roundtable Webinar Series, Webinar #2, December 4, 2014 (presentation provided by the Volpe Center)
Ahmad Sadegh, Ph.D., "Dallas Integrated Corridor Management," September 15, 2014, http://www.its3csummit.com/uploads/8/9/7/2/8972455/tip franklin.pdf- content is no longer available.
"The I-80 Integrated Corridor Mobility (ICM) Project," presentation for ICM Roundtable Webinar, December 4, 2014 (presentation provided by the Volpe Center)
"I-80 SMART Corridor Project: TRAFFIC ADVISORIES," April 29, 2015, http://80smartcorridor.org/traffic-advisories/- content is no longer available.
Commissioner Polly Trottenberg, New York City Department of Transportation (NYCDOT), "USDOT Integrated Corridor Management (ICM) Deployment Planning Grant Process," presented by Assistant Commissioner Mike Marsico, P.E., NYCDOT, Division of Traffic & Planning, 2014 ITS-NY 21st Annual meeting, June 12, 2014 (provided by USDOT)
Integrated Corridor Management Transit Vehicle Real-time Data Demonstration: Dallas Case Study, FTA, December 2014, https://www.transit.dot.gov/sites/fta.dot.gov/files/FTA_Report_No._0077.pdf
USDOT ICM website, http://www.its.dot.gov/icms/- content is no longer available.
ICM Knowledgebase, http://www.its.dot.gov/icms/knowledgebase.htm- content is no longer available.
2014 Short course on ICM, https://www.youtube.com/watch?v=S18Ndlz8Xjk
8. Study Questions
1. Which of these is NOT a benefit of Integrated Corridor Management?
- Reduced fuel consumption
- Improved customer service
- Reduced travel time variability
- Better utilization of transit excess capacity
2. Which one of these device standards does not provide control and real time management?
- NTCIP Ramp Metering
- ATC Application Programming Interface (API)
- NTCIP Transportation Sensor System (TSS)
- NTCIP Dynamic Message Signs (DMS)
3. Which one of these standards is NOT used in the Dallas ICM system?
- Message Sets for External TMC to TMC Communication (MS/ETMCC)
- Transit Communication Interface Protocol (TCIP)
- 511 Dissemination Interface
- Traffic Management Data Dictionary (TMDD)
9. Icon Guide
The following icons are used throughout the module to visually indicate the corresponding learning concept listed out below, and/or to highlight a specific point in the training material.
1) Background information: General knowledge that is available elsewhere and is outside the module being presented. This will be used primarily in the beginning of slide set when reviewing information readers are expected to already know.
Example: Information on the standard.
2) Remember: Used when referencing something already discussed in the module that is necessary to recount.
Example: "Recall our discussion on [insert topic] back in Learning Objective 1..."
3) Refer to Student Supplement: Items or information that are further explained/detailed in the Student Supplement.
Example: Additional information on a standard, additional case studies or examples that don't fit into the PowerPoint itself, external resources, etc.
4) Example: Can be real-world (case study), hypothetical, a sample of a table, etc.