ITS Transit Standards Professional Capacity Building Program
Module 14 Part 1: Applying General Transit Feed Specification (GTFS) to Your Agency
HTML of the PowerPoint Presentation
(Note: This document has been converted from a PowerPoint presentation to 508-compliant HTML. The formatting has been adjusted for 508 compliance, but all the original text content is included, plus additional text descriptions for the images, photos and/or diagrams have been provided below.)
Slide 1:
(Extended Text Description: Welcome - Graphic image of introductory slide. A large dark blue rectangle with a wide, light grid pattern at the top half and bands of dark and lighter blue bands below. There is a white square ITS logo box with words "Standards ITS Training - Transit" in green and blue on the middle left side. The word "Welcome" in white is to the right of the logo. Under the logo box is the logo for the U.S. Department of Transportation, Office of the Assistant Secretary for Research and Technology.)
Slide 2:
Module: 14 Part 1
Applying General Transit Feed Specification (GTFS) to Your Agency
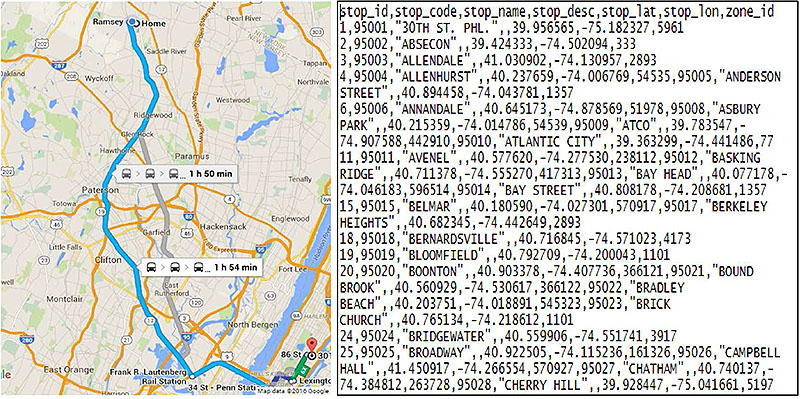
(Extended Text Description: Title slide contain a two part graphic for illustration purposes: The left part of the graphic contains a map of Northern New Jersey. A path in blue travels from the northern part of the map to the southern part of the map showing the map portion of a transit itinerary. There is a branching line in gray that separates and rejoins from this initial line. There is a while text box next to the blue line that has three train icons and states 1 h 50 min. There is a second white text box next to the blue line that has three train icons and states 1 h 54 min. The right part of the graphic is a text box showing an example stops.txt GTFS file in CSV (comma separated values) format.)
Slide 3:
Instructor

Scott Altman
Technical Staff
ConSysTec
Course Co-Developer: Bruce Eisenhart
Slide 4:
Learning Objectives
- Define the Scope of, Uses for, and Users of the GTFS Specification
- Apply the Steps for Translating Your Transit Source Data to GTFS files
- Improve GTFS Data Quality
- Illustrate how an Agency Implements GTFS
Slide 5:
Learning Objective 1
- Define the Scope, Uses, and Users of the GTFS specification
Slide 6:
What is the Background of GTFS?
A Transit Customer Story
- How would a transit customer unfamiliar with the system navigate?
- Past: route maps and timetables
- Present: transit trip planning applications
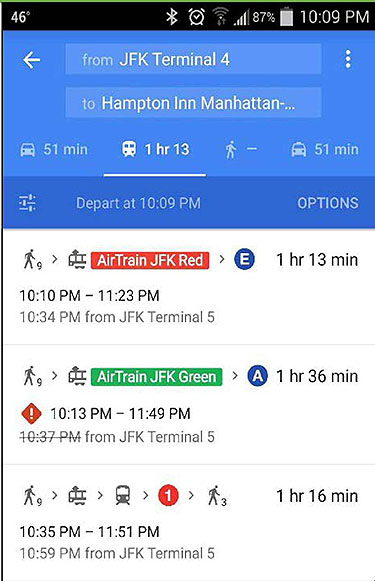
(Extended Text Description: The slide contains a graphic screenshot of the Google Maps application used on an Android Smartphone. The top part of the application, which has a medium blue background, has a box that reads from JFK Terminal 4. Below that box is a second box that reads to Hampton Inn Manhattan. Both of these boxes have lighter blue backgrounds. Below these boxes are a series of options a user may select from left to right. The first is a gray car icon with gray text reading 51 min to the right. The next icon shows a white train and has text to its right reading 1 hr 13. This option also has a white underline. The next icon shows a gray pedestrian and has a gray dashed line to its right. The final icon shows a gray taxicab and has gray test to the right reading 51 min. Below the row of options is a dark blue bar. On the left is an icon indicating a menu. In the center is text reading Depart at 10:09 PM. On the right is text reading OPTIONS. Below the dark blue section is a white section listing three transit itineraries. The first option has an icon depicting a pedestrian with a small number 9 to its right. An arrow then points to an icon of a tram with a red text box reading AirTrain JFK Red in white writing. An arrow then points to a white E enclosed in a blue circle. To the right is text reading 1 hr 13 min. Below is text reading 10:10 PM – 11:23 PM. Below is text in gray reading 10:34 PM from JFK Terminal 5. The second option is below the first option. The second option has an icon depicting a pedestrian with a small number 9 to its right. An arrow then points to an icon of a tram with a green text box reading AirTrain JFK Green in white writing. An arrow then points to a white A enclosed in a blue circle. To the right is text reading 1 hr 36 min. Below is a red diamond shaped icon with a white exclamation point. To the right of the icon is text reading 10:13PM – 11:49 PM. Below is text in gray reading 10:37 PM from JFK Terminal 5 with a line stuck through the 10:37 PM text/ The third option consists of a pedestrian icon with a small number 9 to the right. An arrow points to a tram icon to the right. An arrow then points to a train icon to the right. An arrow then points to a white number 1 in a red circle. An arrow then points to a pedestrian icon with a small number 3 to the right. To the right of the icons is text reading 1 hr 16 min. Below is text reading 10:35 PM – 11:51 PM. Below is gray text reading 10:49 PM from JFK Terminal 5.)
Source: Google Maps
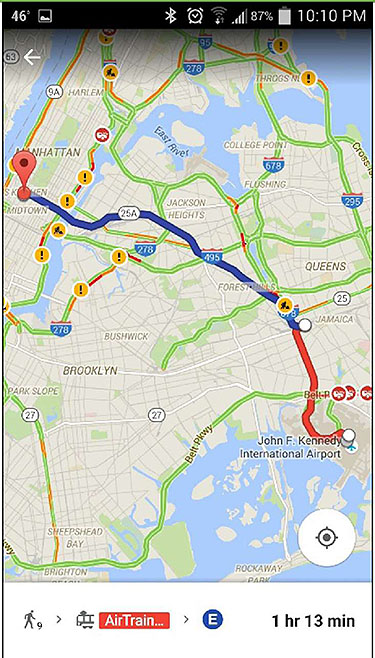
Slide 7:
What is the Background of GTFS?
A Transit Customer Story
- How would a transit customer unfamiliar with the system navigate?
- Past: route maps and timetables
- Present: transit trip planning applications
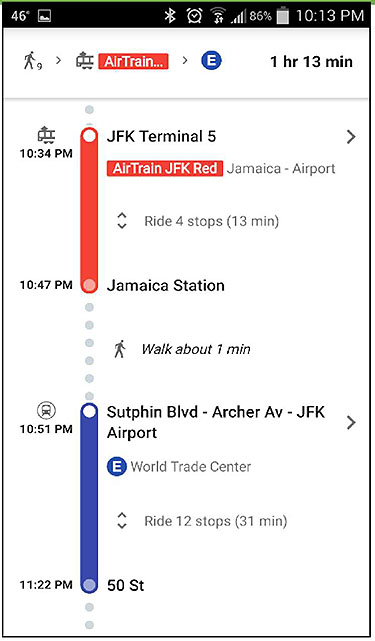
(Extended Text Description: The slide contains a graphic screenshot of the Google Maps application used on an Android Smartphone. The first line contains an icon depicting a pedestrian with a small number 9 to the right. To the right is an arrow pointing to an icon of a tram. To the right of the icon is a red box with the words AirTrain… in white text. To the right of the icon is an arrow. To the right of the arrow is a blue circle with the letter E in white writing. On the right of the line is bolded text reading 1 hr 13 min. There is a horizontal line below spanning the entire width of the application. The rest of the application screen is a diagram depicting a travel itinerary using public transit. The general layout of the diagram consists of times of each step listed on the left. The center element consists of a vertical line which changes texture at various points. The right has a textual description. Moving downwards from the top, the first part of the center line is a dotted line. After the dotted portion, it changes to a thick solid red line, with a white circle contained at the top and a gray circle contained at the bottom. After the red solid line, the line changes to a dotted line. After the dotted line, the line changes to a solid blue line, with a white circle contained at the time, and a gray circle contained at the bottom. After the blue solid line, the line changes to a dotted line for the remainder of the screen. To the left of the top of the red part of the line is an icon depicting a tram, with text reading 10:34 PM below it. To the left of the bottom of the red line is text reading 10:47 PM. To the left of the top of the blue line is an icon depicting a train in a circle, with text reading 10:51 PM below it. To the left of the bottom of the blue line is text reading 11:22 PM. To the right of the red line, the first line reads JFK Terminal 5. The second line consists of a red box with white text reading AirTrain JFK Red. After the text box is gray text reading Jamaica-Airport. The next line consists of a set of up and down arrows in gray followed by text reading Ride 4 stops (13 min). The final line to the right of the red line reads Jamaica Station. To the right of the second dotted part of the line is an icon depicting a pedestrian followed by text reading Walk about 1 min. To the right of the blue portion of the line are multiple lines of text. The first line reads Sutphin Blvd- Archer Av- JFK Airport. The second line consists of a blue circle with a white letter E. Following that on the same line is gray text reading World Trade Center. The next line consists of up and down arrows followed by gray text reading Ride 12 stops (31 min). The final line to the right of the blue portion of the vertical line reads 50 St.)
Source: Google Maps
Slide 8:
What is the Background of GTFS?
A Transit Customer Story
- How would a transit customer unfamiliar with the system navigate?
- Past: route maps and timetables
- Present: transit trip planning applications
(Extended Text Description: The slide contains a graphic screenshot of the Google Maps application used on an Android Smartphone. A trip depicting a transit trip is superimposed on the map. The trip is depicted by a series of polylines. The origin is represented by a white circle. The first polyline is red and travels from the origin on the southern part of the map to the first transfer point. The transfer origin of the second portion of the trip is also represented by a white circle. The second polyline is blue, and travels from starting point of this portion of the trip to the destination on the eastern part of the map. The destination is represented by a red place marker icon with a dark dot in the center. At the bottom of the application screen is a white bar. There is one line. The first part of the line is an icon depicting a pedestrian with a small number 9 in the lower right hand corner. To the right is an arrow. To the right is an icon depicting a tram with a red box to the left. The red box has white texting reading AirTrain…. To the right is an arrow. To the right is a blue circle with a white letter E. To the right is bolded text reading 1 hr 13 min.)
Source: Google Maps
Slide 9:
What is the Background of GTFS?
General Transit Feed Specification (GTFS)
- Commonly used specification for disseminating static transit data
- Set of rules describing format for sharing transit schedule information
- In a transit scheduling context, static means recurring, NOT unchanging
- NOT a standard, but treated as a de facto standard

Slide 10:
What is the Background of GTFS?
History of GTFS
- Started in 2005 by TriMet (Portland, OR) and Google
- Originally Google Transit Feed Specification
- First version released in 2006
- Original purpose: loading into Google Transit Trip Planner
- Multiple agencies included by 2006
- By 2010 hundreds of agencies
- Number of participating agencies now the thousands
- In 2010 became General Transit Feed Specification
Slide 11:
What is the Background of GTFS?
GTFS Coverage
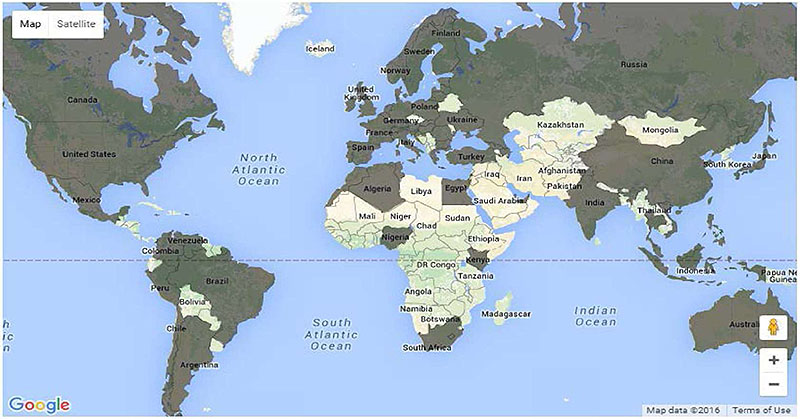
(Extended Text Description: This slide contains a graphic showing a map of the world. A portion of countries are shaded dark, indicating the existence of GTFS feeds within them. A portion of countries are shaded lightly, indicating the absences of GTFS feeds within them. The following countries are shaded dark and visibly labeled: Canada, United States, Mexico, Venezuela, Peru, Brazil, Chile, Argentina, United Kingdom, Norway, Sweden, Finland, Spain, France, Germany, Poland, Ukraine, Algeria, Turkey, Egypt, Kenya, Nigeria, South Africa, Russia, China, India, Japan, Indonesia, and Australia. Additional countries are shaded dark but unlabeled. The following countries are shaded lightly and visibly labeled: Bolivia, Iceland, Mali, Niger, Libya, Chad, Sudan, Ethiopia, DR Congo, Tanzania, Angola, Namibia, Botswana, Madagascar, Iraq, Iran, Afghanistan, Pakistan, Saudi Arabia, Kazakhstan, Mongolia, Thailand, South Korea, and Papua New Guinea.)
Dark = Countries with GTFS
Light = Countries without GTFS
Source: Google Maps

Slide 12:
What is the Background of GTFS?
GTFS Specification Lifecycle and Updates
- Specification maintained by Google
- Structured, but informal process
- Discussion of updates occurs in online discussion forum
-
GTFS update process offers flexibility
- Advantages
- Disadvantages
Slide 13:
What is the Background of GTFS?
GTFS Lifecycle and Update
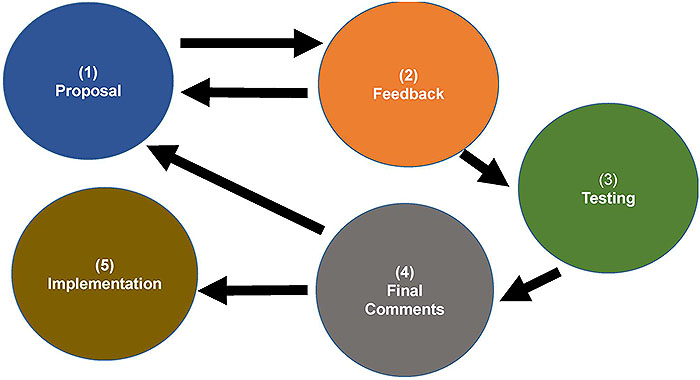
(Extended Text Description: This slide consists of a graphic showing the GTFS Lifecycle and Update. At the top left is a blue circle with text reading (1) Proposal. To the right of the blue circle is a black arrow leading to the right and a black arrow below that one leading to the left. To the right of the arrows is an orange circle that reads (2) Feedback. A black arrow leads from the circle down and to the right. This arrow points to a green circle with text reading (3) Testing. A black arrow leads from the circle down and to the left. This arrow leads to a gray circle with text that reads (4) Final Comments. A black arrow leads up and to the left back to the blue circle. A second arrow also leads straight to the left. This arrow leads to a brown-yellow circle with text that reads (5) Implementation.)

Slide 14:
Benefits and Uses of GTFS
Benefits
- Open
- Flexible
- Widely adopted
- Multiple options for implementation
- Enables delivery of schedule/route info to passengers
Slide 15:
Benefits and Uses of GTFS
Uses and Applications of GTFS
-
Downstream Software Applications Using GTFS
- Trip planning tools
- Input to real time information tools
- Other operations systems (e.g. Computer Aided Dispatch/ Automatic Vehicle Location (CAD/AVL), fare collection)
- Timetable generator tools
-
Transit Planning
- Input data to service coverage mapping
- Provides data for service evaluation (service frequency)
- Service planning (show gaps)
Slide 16:

Slide 17:
Question
Which of the following choices best describes the process for updates to the GTFS specification?
Answer Choices
- Formal balloting process by committee
- Discussion in an online forum
- Voting by every transit agency
- There is no process
Slide 18:
Review of Answers
 a) Formal balloting process by committee
Incorrect. There is no such committee that exists.
 b) Discussion in an online forum.
Correct! There is an online group where changes to the GTFS-specification are discussed before changes are officially implemented by Google.
c) Voting by every transit agency
Incorrect. There is no voting process.
d) There is no process
Incorrect. Despite the informal process, one does exist. If there was no process, changes would never occur.
Slide 19:
Learning Objective 2
- Apply the Steps for Translating Your Transit Source Data to GTFS Files
Slide 20:
Inputs Needed for GTFS
What Makes up a GTFS Feed?
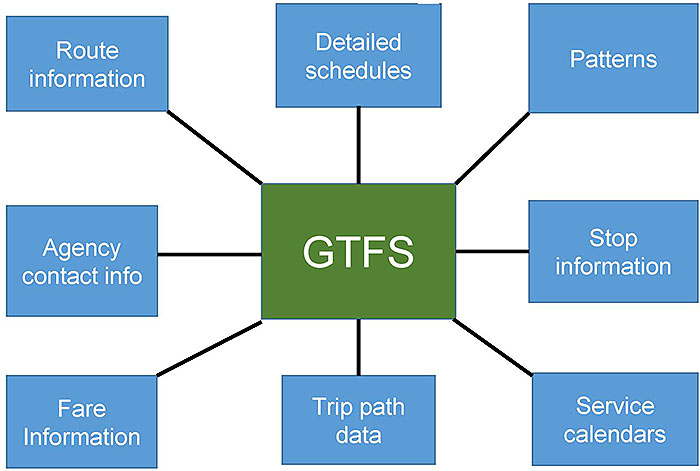
(Extended Text Description: At the center of this graphic is a green box with the letters GTFS in white. There are 8 light blue boxes with white text surrounding the green box each connected by a line. Starting with the box directly above the green box and moving in a clockwise direction they read: Detailed schedules, Patterns, Stop information, Service calendars, Trip path data, Fare Information, Agency contact info, and Route information.)
Slide 21:
Inputs Needed for GTFS
Transit Data Sources for GTFS
- Characteristics: Accurate, reliable, and consistent
-
Electronic Sources
- Scheduling Systems
- CAD/AVL Systems
-
Paper Sources
- Timetable
- Stop Lists
-
Agency Staff Input
- Scheduling /Planning/ Operations Staff
- Data collection staff
Slide 22:
GTFS Structure and Files
GTFS Structure
- GTFS feed is a series of zipped text files in CSV form (FictionalGTFS_Spring2016.zip)
- CSV = Comma Separated Values
- Header row shows fields in files
- Subsequent rows for each data entry
- Note that GTFS files saved as ".txt." despite being in the format of ".csv"
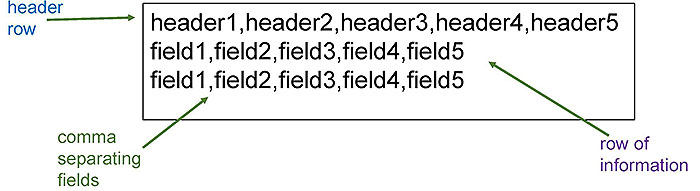
(Extended Text Description: This slide contains a graphic. There is a rectangular box with black text in CSV (comma separated values) format. The first line of text reads header1, header2, header3, header4, and header5. The second line of text reads field1, field2, field3, field4, field5. The third line of text reads field1, field2, field3, field4, field5. To the left of the box there is light blue text that reads "header row" with a green arrow pointing to the first line of the box. To the bottom left of the box there is green text reading "comma separating fields" with an arrow pointing to a comma on the third line of the box. To the bottom right of the box is purple text reading "row of information" with a green arrow pointing to the second line of the box.)
Slide 23:
GTFS Structure and Files
GTFS Structure
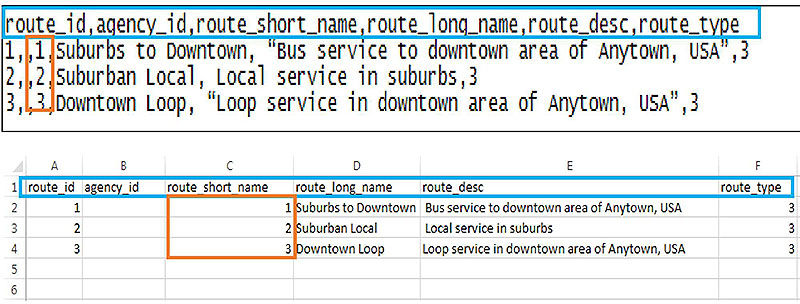
(Extended Text Description: This figure shows the relationship between a GTFS feed and an Excel table, showing corresponding data fields, highlighting the route_short_name data in both files. At the top or the slide is a screenshot of a GTFS feed in CSV (comma separated values) format. The rows contain the following content:
route_id, agency_id, route_short_name, route_long_name, route_desc, route_type
1,,1,Suburbs to Downtown, "Bus service to downtown area of Anytown, USA,"3
2,,2,Suburban Local, Local service in suburbs, 3
3,,3,Downtown Loop, "Loop service in downtown area of Anytown, USA", 3
A blue border surrounds the top line of the screenshot. An orange border surrounds the third fields on the second, third, and fourth lines. The second graphic on the slide is a screenshot of a Microsoft Excel table. The table contains the following content:
| A | B | C | D | E | F | |
|---|---|---|---|---|---|---|
| 1 | route_id | agency_id | route_short_name | route_long_name | route_desc | route_type |
| 2 | 1 | 1 | Suburbs to Downtown | Bust service to downtown area of Anytown, USA | 3 | |
| 3 | 2 | 2 | Suburban Local | Local service in suburbs | 3 | |
| 4 | 3 | 3 | Downtown Loop | Loop service in downtown area of Anytown, USA | 3 | |
| 5 | ||||||
| 6 |
Rows 5 and 6 are blank. A blue border surrounds row 1 of the screenshot. An orange border surrounds rows 2, 3, and 4 of column C, showing the corresponding data with the previous related CSV file.)

Slide 24:
GTFS Structure and Files
GTFS Structure
-
GTFS differs in structure from ITS transit standards
- No XML or ASN.1 files
- Does not follow request/response pattern, rather downloaded as a zipped file from a fixed web location
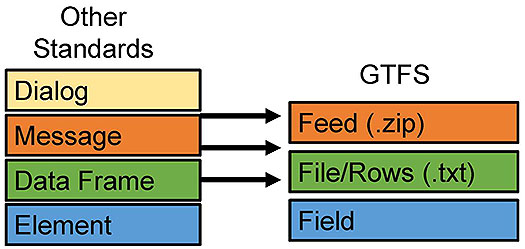
(Extended Text Description: This graphic contains two columns of boxes. The left column has a label on top that reads Other Standards. Moving downward, the first box is yellow and reads Dialog. The second box is orange and reads Message. The third box is green and reads Data Frame. The fourth box is blue and reads Element. The right column has three boxes. The top of the column is opposite the top of the second box on the left. On the right column, there is a label on top that reads GTFS. Moving downward, the first box is orange and reads Feed (.zip). The second box is green and reads File/Rows (.txt). The third box is blue and reads Field. Between the columns there are three arrows pointing right. One connects the two orange boxes with each other, one connects the two green boxes with each other, and one connects the two blue boxes with each other.)
Slide 25:
GTFS Structure and Files
GTFS Files
| agency.txt | Required |
| stops.txt | Required |
| routes.txt | Required |
| trips.txt | Required |
| stop_times.txt | Required |
| calendar.txt | Required (if no calendar_dates.txt) |
| calendar_dates.txt | Required (if no calendar.txt) |
| fare_attributes.txt | Optional |
| fare_rules.txt | Optional |
| shapes.txt | Optional |
| frequencies.txt | Optional |
| transfers/txt | Optional |
| feed_info.txt | Optional |
Slide 26:
GTFS Structure and Files
GTFS Data Types
| Data Type | Example |
|---|---|
| String | Grand Central Terminal |
| Numeric | 71.02648 or 5.50 |
| Integer | 1 |
| Date (YYYYMMDD) | 20160425 |
| Time (24 hour clock- HH:MM:SS) | 23:10:00 |
| Enumerated (restricted) | 0 or en |
| URL | http://www.ite.org |
| Hex Color | #FFFFFF or #000000 |
Slide 27:
GTFS Structure and Files
agency.txt
- Mandatory file: describes basic agency and contact information
| Field | Required/Optional | Type |
|---|---|---|
| agency_id | Optional | string |
| agency_name | Required | string |
| agency_url | Required | URL |
| agency_timezone | Required | enumerated |
| agency_lang | Optional | enumerated |
| agency_phone | Optional | string |
| agency_fare_url | Optional | URL |
| agency_email | Optional | string |
Slide 28:
GTFS Structure and Files
agency.txt
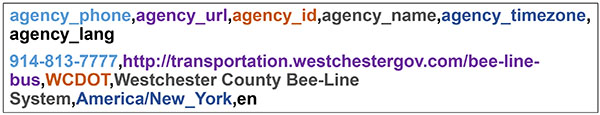
(Extended Text Description: This figure contains CSV (comma separated values) text that has been colored to indicate corresponding text fields, so that each line of the file shows the related fields in the same colors; i.e.: the first field of each line of text is colored the same way, the second field of each line of text is colored the same way, and so forth. The text of the file is shown below:
agency_phone,agency_url,agency_id,agency_name,agency_timezone, agency_lang
914-813-7777,http://transportation.westchestergov.com/bee-line-bus,WCDOT,Westchester County Bee-Line System,America/New_York,en
Source: Westchester County BeeLine System
Slide 29:
GTFS Structure and Files
stops.txt
- Mandatory file: directory of stops
- Part 1 of 2:
| Field | Required/Optional | Type |
|---|---|---|
| stop_id | Required | string |
| stop_code | Optional | string |
| stop_name | Required | string |
| stop_desc | Optional | string |
| stop_lat | Required | numeric |
| stop_lon | Required | numeric |
Slide 30:
GTFS Structure and Files
stops.txt
- Mandatory file: describes basic agency and contact information
- Part 2 of 2:
| Field | Required/Optional | Type |
|---|---|---|
| zone_id | Optional | String |
| stop_url | Optional | URL |
| location_type | Optional |
0: stop 1: station with multiple stops |
| parent_station | Optional | String |
| stop_timezone | Optional | Enumerated (code) |
| wheelchair_boarding | Optional |
0: unknown 1: available 2: unavailable |
Slide 31:
GTFS Structure and Files
stops.txt
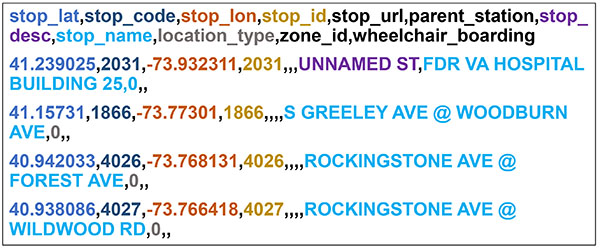
(Extended Text Description: This figure contains CSV (comma separated values) text that has been colored to indicate corresponding text fields, so that each line of the file shows the related fields in the same colors; i.e.: the first field of each line of text is colored the same way, the second field of each line of text is colored the same way, and so forth. The text of the file is shown below:
stop_lat,stop_code,stop_lon,stop_id,stop_url,parent_station,stop_ desc,stop_name,location_type,zone_id,wheelchair_boarding
41.239025,2031,-73.932311,2031,,,UNNAMED ST,FDR VA HOSPITAL BUILDING 25,0,,
41.15731,1866,-73.77301,1866,,�S GREELEY AVE @ WOODBURN AVE,0,,
40.942033.4026, -73.768131,4026,,,,ROCKINGSTONE AVE @ FOREST AVE,0,,
40.938086.4027, -73.766418,4027,,,,ROCKINGSTONE AVE @ WILDWOOD RD,0,,
Source: Westchester County BeeLine System
Slide 32:
GTFS Structure and Files
routes.txt
- Mandatory file: describes details about each route in the system
| Field | Required/ Optional | Type |
|---|---|---|
| route_id | required | string |
| agency_id | optional | string |
| route_short_name | required | string |
| route_long_name | required | string |
| route_desc | optional | string |
| route_type | required | See list to right |
| route_url | optional | URL |
| route_color | optional | hex color |
| route_text_color | optional | hex color |
route_type
0: street car/light rail
1: subway
2: rail
3: bus
4: ferry
5: cable car
6: gondola
7: funicular
Slide 33:
GTFS Structure and Files
routes.txt
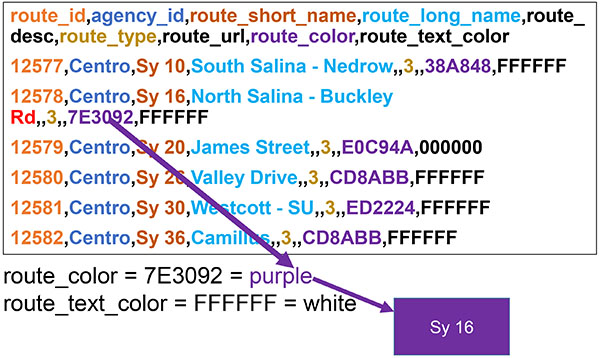
(Extended Text Description: This figure contains CSV (comma separated values) text that has been colored to indicate corresponding text fields, so that each line of the file shows the related fields in the same colors; i.e.: the first field of each line of text is colored the same way, the second field of each line of text is colored the same way, and so forth. The text of the file is shown below:
route_id,agency_id,route_short_name,route_long_name,route_desc,route_type,route_url,route_color,route_text_color
12577,Centro,Sy10,South Salina -Nedrow,,3,,38A848,FFFFFF
12578,Centro,Sy16,North Salina -Buckley Rd,,3,,7E3092,FFFFFF
12579,Centro,Sy 20,James Street,,3,,E0C94A,000000
12580,Centro,Sy26,Valley Drive,,3,,CD8ABB,FFFFFF
12581,Centro,Sy30,Westcott -SU,,3,,ED2224,FFFFFF
12582,Centro,Sy36,Camillus,,3,,CD8ABB,FFFFFF
route_color = 7E3092 = purple
route_text_color = FFFFFF = white
Additionally, there is an arrow coming from the GTFS example that reads 7E3092 (which is colored purple) to the word purple near the bottom. A second arrow comes from the word purple to a purple box with white text that reads Sy 16.)
Source: Centro
Slide 34:
GTFS Structure and Files
trips.txt
- Mandatory file: describes details about each trip in the system
| Field | Required/Optional | Type |
|---|---|---|
| route_id | required | string |
| service_id | required | string |
| trip_id | required | string |
| trip_headsign | optional | string |
| trip_short_name | optional | string |
| direction_id | optional | 0 or 1 |
| block_id | optional | string |
| shape_id | optional | string |
| wheelchair_accessible | optional | See list to right |
| bikes_allowed | optional | See list to right |
wheelchair_accessible
0: unknown
1: yes
2: no
bikes_allowed
0: unknown
1: yes
2: no
Slide 35:
GTFS Structure and Files
trips.txt
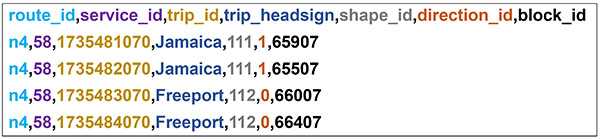
(Extended Text Description: This figure contains CSV (comma separated values) text that has been colored to indicate corresponding text fields, so that each line of the file shows the related fields in the same colors; i.e.: the first field of each line of text is colored the same way, the second field of each line of text is colored the same way, and so forth. The text of the file is shown below:
route_id,service_id,trip_id,trip_headsign,shape_id,direction_id,block_id
n4,58,1735481070,Jamaica,111,1,65907
n4,58,1735482070,Jamaica,111,1,65507
n4,58,1735483070,Freeport,112,0,66007
n4,58,1735484070,Freeport,112,0,66407

Source: Openclipart
Slide 36:
GTFS Structure and Files
stop_times.txt
- Mandatory file: describes stops on each trip
- Part 1 of 2:
| Field | Required/Optional | Type |
|---|---|---|
| trip_id | required | string |
| arrival_time | required | time |
| departure_time | required | time |
| stop_id | required | string |
| stop_sequence | required | integer |
| stop_headsign | optional | string |
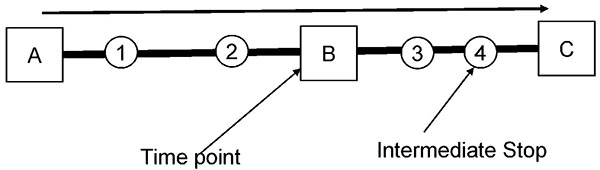
(Extended Text Description: This slide contains a graphic at the bottom. The top of this graphic contains a long thin line with an arrowhead to the right. Below that line is a much thicker line. The line is interrupted by the following shapes spaced approximately evenly moving from left to right: a square with the letter A, a circle with the number 1, a circle with the number 2, a square with the letter B, a circle with the number 3, a circle with the number 4, a square with the letter C. The boxes with A and C cap the ends of the line.)
Slide 37:
GTFS Structure and Files
stop_times.txt
- Mandatory file: describes stops on each trip
- Part 2 of 2:
| Field | Required/ Optional | Type |
|---|---|---|
| pickup_type | optional |
0: regularly scheduled 1: no pickup off available 2: must phone agency 3: must coordinate with driver |
| drop_off_type | optional |
0: regularly scheduled 1: no drop off available 2: must phone agency 3: must coordinate with driver |
| shape_dist_traveled | optional | numeric |
| timepoint | optional |
empty: exact 1: approximate 2: exact |
Slide 38:
GTFS Structure and Files
stop_times.txt

(Extended Text Description: This figure contains CSV (comma separated values) text that has been colored to indicate corresponding text fields, so that each line of the file shows the related fields in the same colors; i.e.: the first field of each line of text is colored the same way, the second field of each line of text is colored the same way, and so forth. The text of the file is shown below:
trip_id,arrival_time,departure_time,stop_id,stop_sequence
8810,06:00:00,06:00:00,92719,1
8810,06:05:00,06:05:00,92720,2
8810,06:10:00,06:10:00,92721,3
Source: Ulster County Area Transit
Slide 39:
GTFS Structure and Files
stop_times.txt
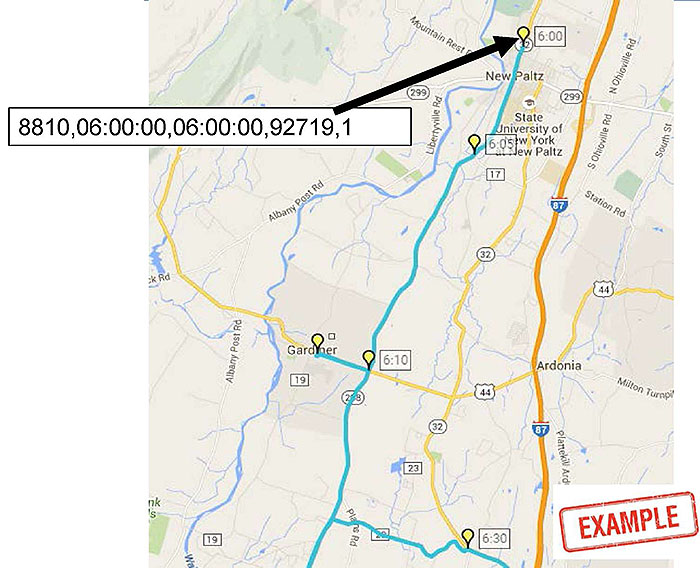
(Extended Text Description: This side contains a map of a region of New York State with transit service. There is a blue line denoting a portion of a transit trip with five stops shown along the trip. Each stop is represented by a yellow place marker. Each stop has a label to the right showing the time of the stop. The labels are as follows in sequential order 6:00, 6:05, 6:10, blank, and 6:30. To the left of the diagram is label with one line of text that reads 8810,06:00:00,06:00:00,92719,1. A black arrow leads from this label to the stop labeled 6:00. At the bottom right of the slide is a red rectangle with the word EXAMPLE in red and all caps.)
Source: Google Maps/ Ulster County Area Transit
Slide 40:
GTFS Structure and Files
calendar.txt
- Mandatory file (if no calendar_dates.txt): describes service calendars in GTFS
| Field | Required/Optional | Type |
|---|---|---|
| service_id | required | 0 or 1 |
| Monday | required | 0 or 1 |
| Tuesday | required | 0 or 1 |
| Wednesday | required | 0 or 1 |
| Thursday | required | 0 or 1 |
| Friday | required | 0 or 1 |
| Saturday | required | 0 or 1 |
| Sunday | required | 0 or 1 |
| start_date | required | 0 or 1 |
| end_date | required | 0 or 1 |
Slide 41:
GTFS Structure and Files
calendar.txt
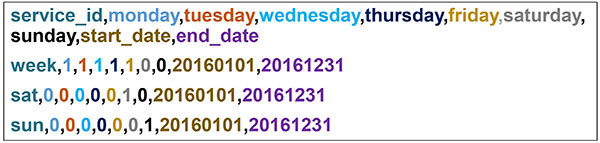
(Extended Text Description: This figure contains CSV (comma separated values) text that has been colored to indicate corresponding text fields, so that each line of the file shows the related fields in the same colors; i.e.: the first field of each line of text is colored the same way, the second field of each line of text is colored the same way, and so forth. The text of the file is shown below:
service_id,monday,tuesday,rednesday,thursday,friday saturday, sunday,start_d ate,end_date
week,1,1,1,1,1,0,0,20160101,20161231
sat,0,0,0,0,0,1,0,20160101,20161231
sun,0,0,0,0,0,0,1,20160101,20161231
Slide 42:
GTFS Structure and Files
calendar_dates.txt
- Mandatory file (if no calendar.txt): describes service calendar exceptions in GTFS
| Field | Required/Optional | Type |
|---|---|---|
| service_id | required | string |
| date | required | date |
| exception_type | required |
1: service added 2: service removed |
Slide 43:
GTFS Structure and Files
calendar_dates.txt
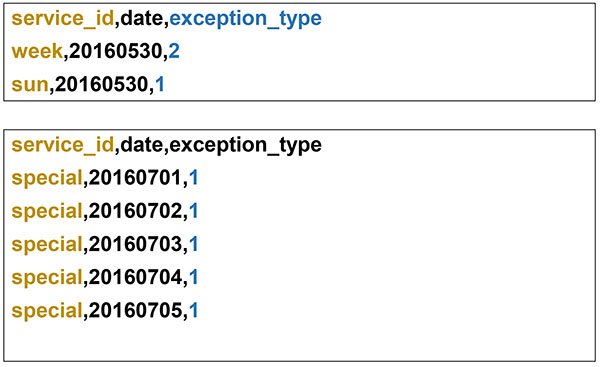
(Extended Text Description: This figure contains CSV (comma separated values) text that has been colored to indicate corresponding text fields, so that each line of the file shows the related fields in the same colors; i.e.: the first field of each line of text is colored the same way, the second field of each line of text is colored the same way, and so forth. The text of the file is shown below:
service_id,date,exception_type
week,20160530,2
sun,20160530,1service_id,date,exception_type
special,20160701,1
special,20160702,1
special,20160703,1
special,20160704,1
special,20160705,1
Slide 44:
GTFS Structure and Files
fare_attributes.txt
- Optional file: describes specific fare instances for an agency
| Field | Required/Optional | Type |
|---|---|---|
| fare_id | required | string |
| price | required | numeric |
| currency_type | required | enumerated |
| payment_method | required |
0: paid on board 1: paid before boarding |
| transfers | required |
0: no transfers included 1: one transfer included 2: two transfers included |
| transfer_duration | required | integer (seconds) |
Slide 45:
GTFS Structure and Files
fare_attributes.txt
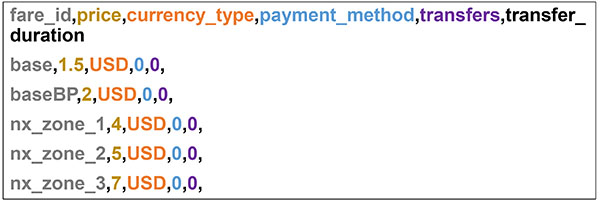
(Extended Text Description: This figure contains CSV (comma separated values) text that has been colored to indicate corresponding text fields, so that each line of the file shows the related fields in the same colors; i.e.: the first field of each line of text is colored the same way, the second field of each line of text is colored the same way, and so forth. The text of the file is shown below:
fare_id,price,currency_type,payment_method,transfers,transfer_ duration
base,1.5,USD,0,0,
baseBP,2,USD,0,0,
nx_zone_1,4,USD,0,0,
nx_zone_2,5,USD,0,0,
nx_zone_3,7,USD,0,0,
Source: Capital District Transportation Authority
Slide 46:
GTFS Structure and Files
fare_rules.txt
- Optional file: describes rules for when each fare is used
| Field | Required/Optional | Type |
|---|---|---|
| fare_id | required | string |
| route_id | optional | string |
| origin_id | optional | string |
| destination_id | optional | string |
| contains_id | optional | string |
Slide 47:
GTFS Structure and Files
fare_rules.txt
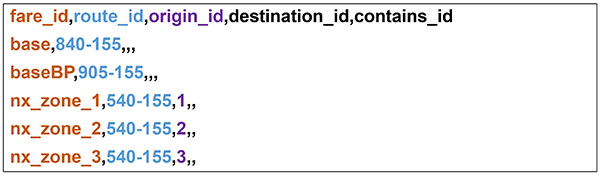
(Extended Text Description: This figure contains CSV (comma separated values) text that has been colored to indicate corresponding text fields, so that each line of the file shows the related fields in the same colors; i.e.: the first field of each line of text is colored the same way, the second field of each line of text is colored the same way, and so forth. The text of the file is shown below:
fare_id,route_id,origin_id,destination_id,contains_id
base,840-155,,,
baseBP,905-155,,,
nx_zone_1,540-155,1,,
nx_zone_2,540-155,2,,
nx_zone_3,540-155,3,,
Source: Capital District Transportation Authority
Slide 48:
GTFS Structure and Files
shapes.txt
- Optional file: describes path of a transit vehicle
| Field | Required/Optional | Type |
|---|---|---|
| shape_id | required | string |
| shape_pt_lat | required | numeric |
| shape_pt_lon | required | numeric |
| shape_pt_sequence | required | numeric |
| shape_dist_traveled | optional | numeric |
Slide 49:
GTFS Structure and Files
shapes.txt
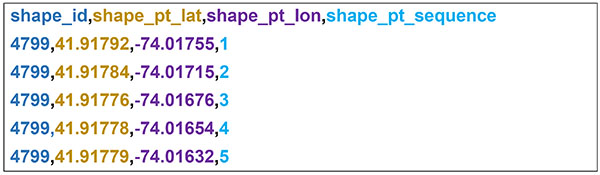
(Extended Text Description: This figure contains CSV (comma separated values) text that has been colored to indicate corresponding text fields, so that each line of the file shows the related fields in the same colors; i.e.: the first field of each line of text is colored the same way, the second field of each line of text is colored the same way, and so forth. The text of the file is shown below:
shape_id,shape_pt_lat,shape_pt_lon,shape_pt_sequence
4799,41.91792,-74.01755,1
4799,41.91784,-74.01715,2
4799,41.91776,-74.01676,3
4799.41.91778, -74.01654,4
4799.41.91779, -74.01632,5
Source: Ulster County Area Transit
Slide 50:
GTFS Structure and Files
shapes.txt
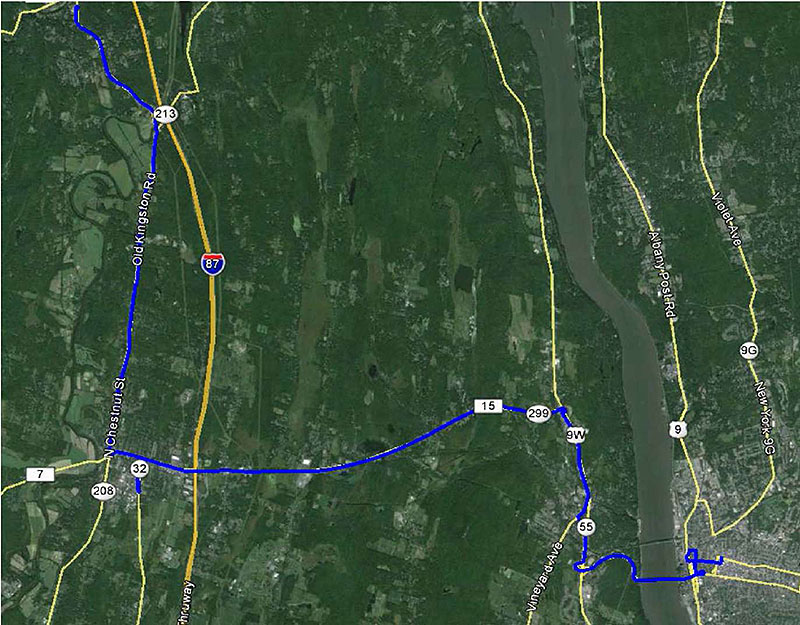
Source: Ulster County Area Transit /Google Earth
Slide 51:
GTFS Structure and Files
frequencies.txt
- Optional file: describes path of a transit vehicle
| Field | Required/Optional | Type |
|---|---|---|
| trip_id | required | string |
| start_time | required | time |
| end_time | required | time |
| headway_secs | required | integer (seconds) |
| exact_times | optional |
0: trips not exact 1: trips exact |
Slide 52:
GTFS Structure and Files
frequencies.txt
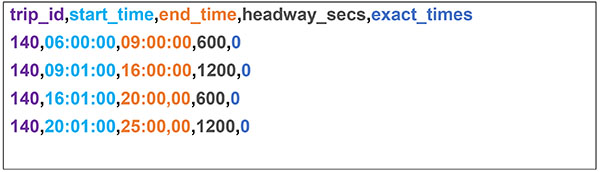
(Extended Text Description: This figure contains CSV (comma separated values) text that has been colored to indicate corresponding text fields, so that each line of the file shows the related fields in the same colors; i.e.: the first field of each line of text is colored the same way, the second field of each line of text is colored the same way, and so forth. The text of the file is shown below:
trip_id,start_time,end_time,headway_secs,exact_times
140,06:00:00,09:00:00,600,0
140,09:01:00,16:00:00,1200,0
140,16:01:00,20:00,00,600,0
140,20:01:00,25:00,00,1200,0
Slide 53:
GTFS Structure and Files
transfers.txt
- Optional file: describes an off-transit transfer between trips at arriving at one stop and departing from another
| Field | Required/Optional | Type |
|---|---|---|
| from_stop_id | required | string |
| to_stop_id | required | string |
| transfer_type | required |
0 /empty: recommended transfer point 1: timed transfer 2: minimum transfer required 3: no transfer possible |
| min_transfer_time | optional | integer (seconds) |
Slide 54:
GTFS Structure and Files
transfers.txt
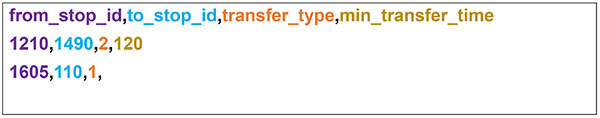
(Extended Text Description: This figure contains CSV (comma separated values) text that has been colored to indicate corresponding text fields, so that each line of the file shows the related fields in the same colors; i.e.: the first field of each line of text is colored the same way, the second field of each line of text is colored the same way, and so forth. The text of the file is shown below:
from_stop_id,to_stop_id,transfer_type,min_transfer_time
1210,1490,2,120
1605,110,1,
Slide 55:
GTFS Structure and Files
feed_info.txt
- Optional file: describes data about feed production, but no customer facing information
| Field | Required/Optional | Type |
|---|---|---|
| feed_publisher_name | required | string |
| feed_publisher_url | required | URL |
| feed_lang | required | enumerated |
| feed_start_date | optional | date |
| feed_end_date | optional | date |
| feed_version | optional | string |
Slide 56:
GTFS Structure and Files
feed_info.txt
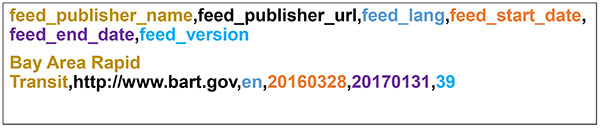
(Extended Text Description: This figure contains CSV (comma separated values) text that has been colored to indicate corresponding text fields, so that each line of the file shows the related fields in the same colors; i.e.: the first field of each line of text is colored the same way, the second field of each line of text is colored the same way, and so forth. The text of the file is shown below:
feed_publisher_name,feed_publisher_url,feed_lang,feed_start_date, feed_end_d ate,feed_version
Bay Area Rapid Transit,http://www.bart.gov,en,20160328,20170131,39
Source: Bay Area Rapid Transit
Slide 57:
Translating Source Data to GTFS
Tools for GTFS Creation and Editing
- Manual Feed Creation
- Custom Software
- Schedule System Export
- Off the Shelf (e.g. National RTAP GTFS Builder)

Slide 58:
Translating Source Data to GTFS
National RTAP GTFS Builder
http://nationalrtap.org/supportcenter/Builder-Apps/GTFS-Builder- content is no longer available.
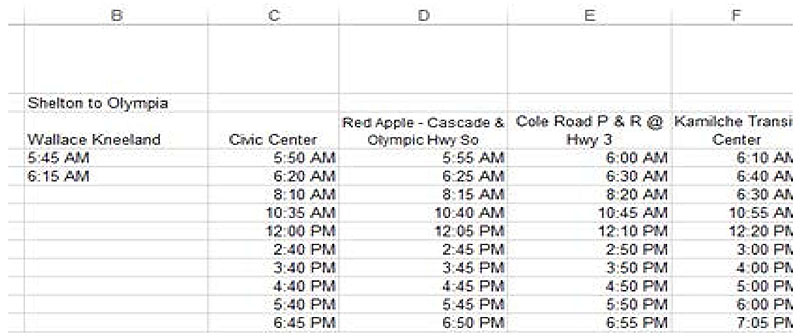
(Extended Text Description: This slide contains a graphic showing a screenshot of the National RTAP GTFS Builder tool. The screen shown contains a spreadsheet. Five columns are visible. The table contains the following data:
| B | C | D | E | F |
|---|---|---|---|---|
| Shelton to Olympia | ||||
| Wallace Kneeland | Civic Center | Red apple - Cascade & Olympic Hwy So | Cole Road P & R @ Hwy 3 | Kamilche Transit Center |
| 5:45 AM | 5:50 AM | 5:55 AM | 6:00 AM | 6:10 AM |
| 6:15 AM | 6:20 AM | 6:25 AM | 6:30 AM | 6:40 AM |
| 8:10 AM | 8:15 AM | 8:20 AM | 6:30 AM | |
| 10:35 AM | 10:40 AM | 10:45 AM | 10:55 AM | |
| 12:00 PM | 12:05 PM | 12:10 PM | 12:20 PM | |
| 2:40 PM | 2:45 PM | 2:50 PM | 3:00 PM | |
| 3:40 PM | 3:45 PM | 3:50 PM | 4:00 PM | |
| 4:40 PM | 4:45 PM | 4:50 PM | 5:00 PM | |
| 5:40 PM | 5:45 PM | 5:50 PM | 6:00 PM | |
| 6:45 PM | 6:50 PM | 6:55 PM | 7:05 PM |
Source: National RTAP Center/ USDOT
Slide 59:
Special Cases in GTFS
Special Cases
-
My service calendars don't follow traditional schedules
(weekday, weekend, Saturday, Sunday, etc.)- Build by type 1 exception in calendar_dates.txt
-
I don't have exact times for intermediate stops between time points:
- Omit them, they can be interpolated by downstream applications
-
I have flex-route service, how do I account for this?
- There is a working group exploring this, but there is no consensus on the best approach
Slide 60:
Use of Trial Parameters
Extending GTFS
- GTFS feeds can be extended with extra files or fields in existing files
- Extending feeds does not mean that the new files or feeds will be universally accepted
- Prior to changes to the GTFS specification, a feed must be extended to validate the change
-
Example (hypothetical)
- Field added to stops.txt to show whether a shelter is available at a stop ("shelter").
- File added to describe parking facilities at stops ("parking.txt").
Slide 61:

Slide 62:
Question
Which of the following areas is NOT described by the GTFS specification?
Answer Choices
- Stop Locations
- Transit Trip Stop Times
- Fare Information
- Historical Ridership Data
Slide 63:
Review of Answers
a) Stop locations
Incorrect. This is covered in stops.txt
b) Transit trip stop times
Incorrect. This is covered in stops_times.txt
c) Fare information
Incorrect. This is covered in fare_attributes.txt and fare_rules.txt
d) Historical Ridership Data
Correct! Historical ridership data is not included in the GTFS specification. An agency could extend their GTFS if needed.
Slide 64:
Question
Which of the following is NOT a tool that can be used to produce GTFS feeds?
Answer Choices
- Pencil and paper
- Scheduling software add-ons
- National RTAP GTFS Editor
- Open source software
Slide 65:
Review of Answers
a) Pencil and paper
Correct! Pencil and paper does not create electronic files.
b) Scheduling software add-ons
Incorrect. Many scheduling software systems do provide this capability.
c) National RTAP GTFS Builder
Incorrect. This can be used to create GTFS.
d) Open source software
Incorrect. There are open source tools for editing GTFS.
Slide 66:
Learning Objective 3
- Improve GTFS Data Quality
Slide 67:
Testing GTFS Files
Testing GTFS Files and GTFS Validation Tools
-
Testing GTFS is necessary
- Verify GTFS conforms to the specification
- Verify GTFS appropriately reflects the agency
- Download tools for testing GTFS at: https://developers.google.com/transit/tools
Slide 68:
Testing GTFS Files
GTFS Validator Tool
-
Common Errors (not an exhaustive list):
- Invalid value (value) in field departure_time. The departure time at this stop (stop_id) is before the arrival time (arrival_time).
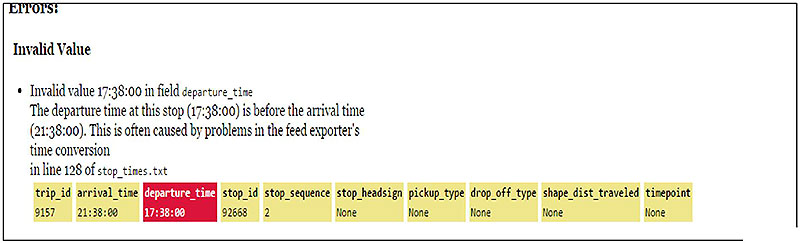
(Extended Text Description: This slide contains a graphic which is a screenshot of the Google GTFS Feed Validator Tool. Much of the graphic is text. The top line says Errors:. Below that is a bolded line that says Invalid Value. Below that is a bullet with text that reads Invalid value 17:38:00 in field departure time. The next line reads, The departure time at this stop (17:38:00) is before the arrival time (21:38:00). The next line reads This is often caused by problems in the feed exporter's time conversion. The next line reads in line 128 of stop_times.txt. Below the text is a series of ten boxes. All boxes are yellow with black text except for the third box which is red with white text. Text in each box reads from left to right: trip_id 9157, arrival_time 21:39:00, departure_time 17:38:00, stop_id 92688, stop_sequence 2, stop_headsign None, pickup_type None, drop_off_type None, shape_dist_traveled None, timepoint None.)
Source: Google GTFS Feed Validator
Slide 69:
Testing GTFS Files
GTFS Validator Tool
-
Common Warnings (not an exhaustive list):
- Invalid value (value) in field route_short_name. route_long_name shouldn't contain the route_short_name value, as both fields are often displayed side-by-side.
- High speed travel detected.
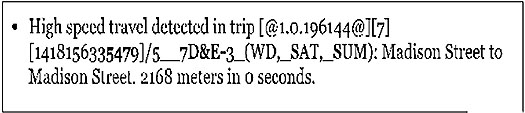
(Extended Text Description: This slide contains a graphic showing a screenshot warning produced by the GTFS Feed Validator Tool. The screenshot is entirely text based. There is a bullet with test that reads High speed travel detected in trip [@1.0.196144@][7][1418156335479/5__7D&E-3_(WD,_SAT,_SUM): Madison Street to Madison Street. 2158 meters in 0 seconds.)
Source: Google GTFS Feed Validator
Slide 70:
Testing GTFS Files
GTFS Schedule Viewer Tool
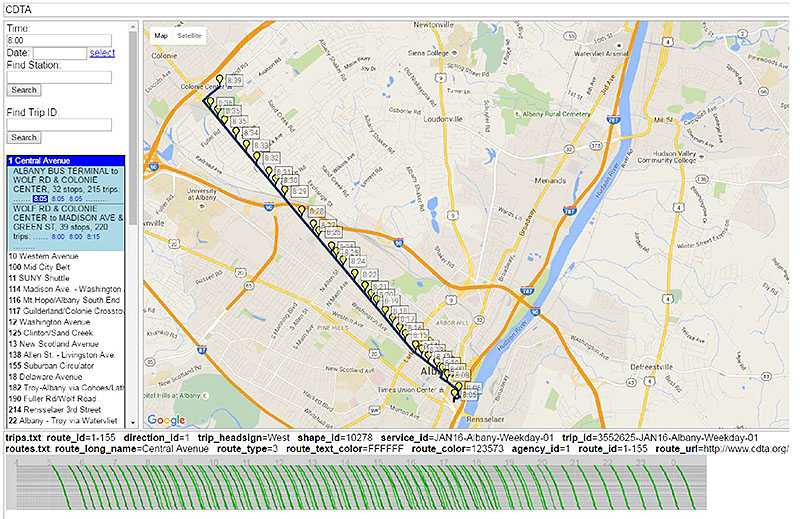
(Extended Text Description: This slide contains a graphic which is a screenshot of the GTFS Schedule Viewer Tool. At the very top of the screen is a bar which states CDTA towards the left. The central part of the screenshot consists of a map of the Albany, NY region. We see a black line traveling along a series of roadways representing a transit trip. For the duration of this line are a series of yellow place markers with labels to the right, representing each stop on the trip and the associated times. To the left of the map is an interactive menu that allows users of the tool to select the trip. There is a form field for time, with 8:00 filled in. Below that is a blank form field for date and a button that a user can press to see a pop up calendar. Below that is a blank form field with a label Find Station and a search button below it. Below that is a blank form field with a label Find Trip ID and a search button below it. Below that is a list of routes on the system. The first route, 1 Central Avenue is selected and highlighted in blue. A menu is expanded blow that with a light blue background. The top of the menu has a label ALBANY BUS TERMINAL TO WOLF RD & COLONIE CENTER. 32 stops. 215 trips. Below that is a list of start times for three trips all reading 8:05, 8:05, and 8:0) respectively. The first 8:05 trip is selected and therefore highlighted in a dark blue background. Below this pattern is a second pattern with a label WOLF RD & COLONIE CENTER TO MADISON AVE & GREEN ST. 39 stops. 220 trips. Times for trips are listed as 8:00, 8:00, and 8:15. None of them are highlighted. Below this is a list of remaining routes contained within the GTFS feed. Below the menu and map is a bar with two lines of text providing information about the selected trip. The first line reads trips.txt route_id=1-155 direction_id=1 trip_headsign=West shape_id=10278 service_id=JAN16-Albany-Weekday-01 trip_id=3552625- JAN16-Albany-Weekday-01. The second line reads routes.txt route_long_name=Central Avenue route_type=3 route_text_color=FFFFFF route_color=123573 agency_id=1 route_id=1-155 route_url=http://www.cdta.org/. Below the label is a graph with time represented by the horizontal access and distance from the origin represented along the vertical access. A series of green lines shows the progression of each trip on the selected pattern throughout the day.)
Source: Google GTFS Schedule Viewer
Slide 71:
Describing Data Quality Through Metadata and Versioning GTFS files
GTFS and Schedule Periods
- GTFS Merge Tool
- https://github.com/google/transitfeed/wiki/Merge
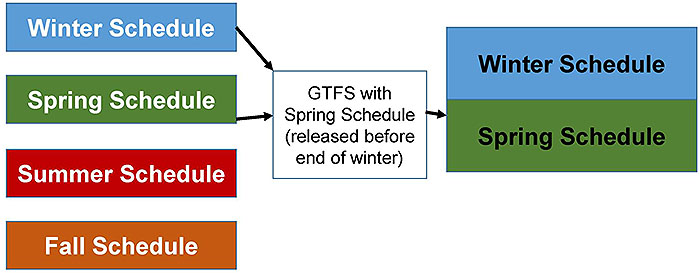
(Extended Text Description: The slide contains a graphic. On the left of the graphic there are four boxes with a space between each box. The first with white text. The first has a light blue background and is labeled Winter Schedule. The second has a green background and is labeled Spring Schedule. The third has a red background and is labeled Summer Schedule. The fourth has an orange background and is labeled Fall Schedule. An arrow leads from the light blue and green boxes to a white box in the middle with text reading GTFS with Spring Schedule (released before end of winter). That text box has an arrow leading to a set of boxes with black text. The top box is light blue and reads Winter Schedule. The bottom box is green and reads Spring Schedule. There is no space between the boxes.)
Slide 72:
Describing Data Quality Through Metadata and Versioning GTFS files
GTFS Merging
-
Feed_info.txt
- Feed_start_date and Feed_end_date
- Version
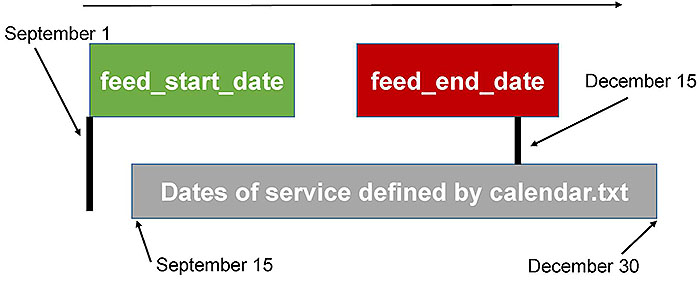
(Extended Text Description: This slide contains a graphic. At the top of the graph is a thin arrow pointing left. Below the arrow on the left is a green box with white text reading feed_start_date. A black vertical line extends down from the lower left corner of the box. To the left of the vertical line is a label that reads September 1 with an arrow pointing to the line. To the right of the green box, but separated by a space, there is a red box with white text reading feed_end_date. There is a black vertical line extending from the bottom of the box downwards, just to the left of the lower right corner. This line does not extend as far down as the vertical line extending from the green box. To the right of this second vertical line is a label that reads December 15 with an arrow pointing to the line. A short distance below both boxes is a gray box that extends horizontally from slightly to the right of the line extending off the green box past the rightmost point of the red box. The top of the gray box is perpendicular to the line extending from the red box. The gray box has white text that reads Dates of service defined by calendar.txt. Below the gray box is a label that reads September 15 with an arrow pointing to the lower left corner of the box and a second label that reads December 30 with an arrow pointing to the lower right corner of the box.)
Slide 73:
Using Use Cases to Understand Data
Use Cases that Describe GTFS Data
- High quality data must be useful data
- Know your downstream users
- Trip Planner- mandatory files, shapes.txt
- Fare calculator- fare_attributes.txt, fare_rules.txt
- Customers who bike to transit- bicycles_allowed in trips.txt
- Customers who require wheelchair accessibility-wheelchairs_boarding in stops.txt and trips.txt

(Extended Text Description: This slide contains a graphic. On the left is a blue box with white text reading Customer Mobile Device. To the right of that are two arrows. The topmost arrow points right and has a label that reads Itinerary Request. The bottommost arrow points left and has a label that reads Itinerary Response. To the right of the arrows is an orange box with white text that reads Trip Planner. To the right of that is a left pointing arrow that has a label reading GTFS. To the right of that is a green box with white text that reads Agency.)
Slide 74:
Improving Data Quality Through Data Management Practices
GTFS Best Practices
- Google provides a list of best practices
-
High quality data:
- Route_color and route_text color should be contrasting
- Use parent stations with child stops
- Ensure shapes.txt is accurate
- Route_long_name should not contain route_short_name
- Test data
- Keep data up to date
- https://maps.google.com/help/maps/mapcontent/transit/bestpractices.html
Slide 75:

Slide 76:
Question
Why is it important to test GTFS feeds?
Answer Choices
- Ensure data is accurate and conforms to the specification
- Ensure customers use trip planners
- Agencies can change schedules on the fly
- Because testing requires no effort
Slide 77:
Review of Answers
a) Ensure data is accurate and conforms to the specification
Correct! Without testing data, it is not possible to know whether it can be used and that it conforms to the specification.
b) Ensure customers use trip planners
Incorrect. This is a side effect of well tested data, but not the main intent.
c) Agencies can change schedules on the fly
Incorrect. Schedules that change on the fly must still be tested.
d) Because testing requires no effort
Incorrect. Testing does require effort, but still must be done.
Slide 78:
Learning Objective 4
- Illustrate how an Agency Implements GTFS
Slide 79:
GTFS Lifecycle Requirements and Strategies
Lifecycle of a GTFS Feed
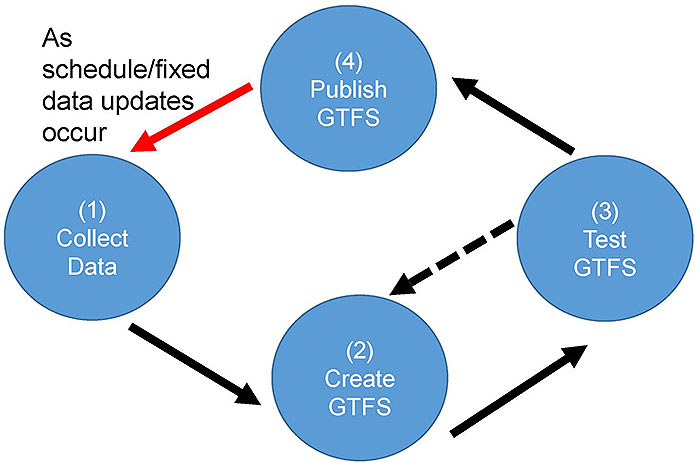
(Extended Text Description: This slide contains a graphic. At the left is a blue circle with white text reading (1) Collect Data. From this circle a solid black arrow points down and to the right to another blue circle with white text reading (2) Create GTFS. From this circle a solid black arrow points up and to the right to another blue circle with white text that reads (3) Test GTFS. A dashed black arrow points from this circle back to the second circle. A solid black arrow also points from the third circle up and to the left to a fourth circle with white text that reads (4) Publish GTFS. From this circle, a solid red arrow points down and to the left back to the first circle. The red arrow has a label that reads "As schedule/fixed data updates occur.")
Slide 80:
GTFS Lifecycle Requirements and Strategies
GTFS Feed Lifecycle Requirements and Strategy
-
Requirements
- Update GTFS as frequently as schedules are updated
- Design implementation lifecycle to work with the agency's processes
- Don't forget to test
-
Strategy
- Leverage existing agency systems and processes
- Leave sufficient time to publish schedules
Slide 81:
Procurement Language for Generating
GTFS
Procurement Language
- Use systems engineering process
-
User needs
- Ex. Agency staff need to be able to export schedule information in a common format
-
Requirements
- Ex: The system shall export a GTFS feed which at minimum includes the following files: agency.txt, stops.txt, routes.txt, trips.txt, stop_times.txt, calendar.txt, calendar_dates.txt, shapes.txt, fare_attributes.txt and fare_rules.txt
Slide 82:
Making GTFS Feed Files Available for Internal and External Applications
Providing GTFS Data
- Reside in a static location
- Unrestricted vs restricted access
- Notify users of new data
- Make data available to users
Slide 83:
Describe the Use of Data by Downstream Users
Applications Using GTFS
-
Customer Facing Applications
- Trip planning tools, timetable generators, etc.
-
Transportation Planning/Analysis
- Archive schedule data, input to planning models as a reference of the transit network
-
Other Transit Agency Applications
- CAD/AVL, Fare collection
- GTFS-realtime
- National Transit Map
Slide 84:

Slide 85:
Case Study
Westchester County BeeLine System, NY
- Began creating GTFS over 6 years ago
- Before GTFS used proprietary format
- Exported from scheduling system
- Primary downstream user is 511NY, who in turn makes it available to other developers
- Issues
- Lessons learned
Slide 86:

Slide 87:
Question
How should GTFS feeds be made available to downstream users?
Answer Choices
- GTFS should not be made public
- Written on a CD and mailed
- Printed on paper
- Fixed location on the web
Slide 88:
Review of Answers
a) GTFS should not be made public
Incorrect GTFS is intended to be made available to downstream users.
b) Written on a CD and mailed
Incorrect GTFS This method is not efficient
c) Printed on paper
Incorrect This method is not efficient or usable.
d) Fixed location on the web
Correct! GTFS should be made available to downstream users by placing it at a fixed and accessible location.
Slide 89:
Module Summary
What We Have Learned
- Used for disseminating static transit schedule data.
- Feed consists of a series of zipped text files that define aspects of fixed transit schedule data.
- GTFS feed must conform to the GTFS specification and contains accurate data.
- GTFS feed is integrated into a transit agency's existing processes.
This module taught us about how GTFS feeds are created and used.
Slide 90:
Thank you for completing this module.
Feedback
Please use the Feedback link below to provide us with your thoughts and comments about the value of the training.
Thank you!