ITS Transit Standards Professional Capacity Building Program
Module 14 Part 2: Applying GTFS-realtime to Your Agency
HTML of the PowerPoint Presentation
(Note: This document has been converted from a PowerPoint presentation to 508-compliant HTML. The formatting has been adjusted for 508 compliance, but all the original text content is included, plus additional text descriptions for the images, photos and/or diagrams have been provided below.)
Slide 1:
(Extended Text Description: Welcome - Graphic image of introductory slide. A large dark blue rectangle with a wide, light grid pattern at the top half and bands of dark and lighter blue bands below. There is a white square ITS logo box with words "Standards ITS Training - Transit" in green and blue on the middle left side. The word "Welcome" in white is to the right of the logo. Under the logo box is the logo for the U.S. Department of Transportation, Office of the Assistant Secretary for Research and Technology.)
Slide 2:
Module 14 Part 2: Applying GTFS-realtime to your Agency
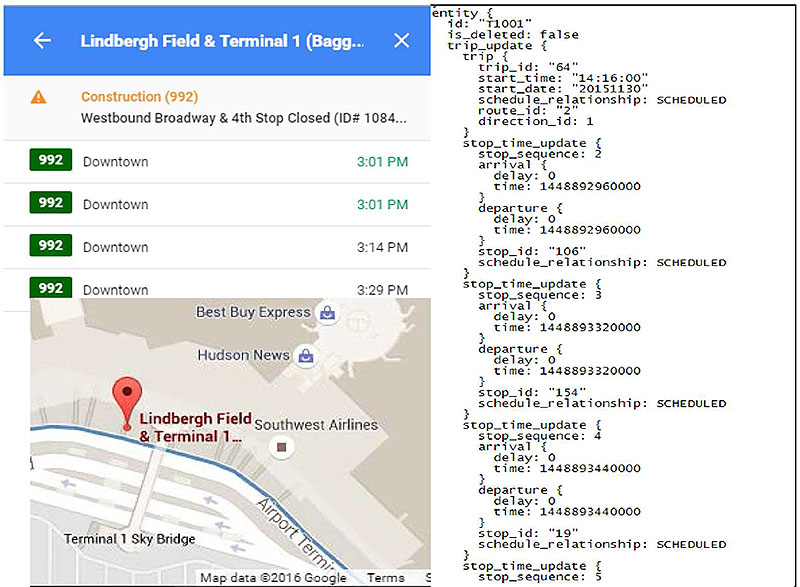
(Extended Text Description: Title slide contain a three graphics which are all touching. Two graphics are stacked on top of each other on the left side. The third graphic is on the right. The top left graphic is a screenshot of Google Maps Transit showing upcoming bus departures for a specific stop. The stop name is on a blue bar on top. The text Lindbergh Field & Terminal 1(Bagg.. is visible. A left pointing arrow is on the left of the text and an x is on the right. Below that is a white screen. The first line has an orange caution triangle icon on the left. There is orange text to the right of that states Construction (992). Below that line is black text which reads Westbound Broadway & 4th Stop Closed (ID# 1084... Below that are four lines each separated by a solid line. On each line there is a green box with white text that reads 992. To the right of that on each line is black text that reads Downtown. To the right of that is a time. The first two lines have times in green text which both read 3:01 PM. The third and fourth lines have black text that read 3:14 PM and 3:29 PM respectively. The bottom left graphic is a screenshot of Google Maps Transit. A map of an airport terminal and surrounding roadways are visible. There is a blue line on the roadway in front of the airport terminal. A red place marker icon is on the terminal with red text reading Lindbergh Field & Terminal 1...
The right graphic is a screenshot of a GTFS-realtime feed, which reads as follows:
entity {
id: T1001
is_deleted: false
trip_update {
trip {
trip_id: 64
start_time: 14:16:00
start_date: 20151130
schedule_relationship: SCHEDULED
route_id: 2
direction_id: 1
}
stop_time_update {
stop_sequence: 2
arrival {
delay: 0
time: 1448892960000
}
departure {
delay: 0
time: 144889260000
}
stop_id: 106
schedule_relationshop: SCHEDULED
}
stop_time_update {
stop_sequence: 3
arrival {
delay: 0
time: 144889320000
}
departure {
delay: 0
time: 1448893320000
}
stop_id: 154
schedule_relationshop: SCHEDULED
stop_time_update {
stop_sequence: 4
arrival {
delay: 0
time: 1448893440000
}
departure {
delay: 0
time: 1448893440000
}
stop_id: 19
schedule_relationshop: SCHEDULED
stop_time_update {
stop_sequence: 5
Slide 3:
Instructor

Scott Altman
Technical Staff
ConSysTec
Course Co-Developer: Bruce Eisenhart
Slide 4:
Learning Objectives
- Define the scope, uses for, and users of the GTFS-realtime specification
- Apply transit source applications to GTFS-realtime
- Implementation of GTFS-realtime
Slide 5:
Learning Objective 1
- Define the scope, uses for, and users of the GTFS-realtime specification
Slide 6:
Background of GTFS-realtime
User Story
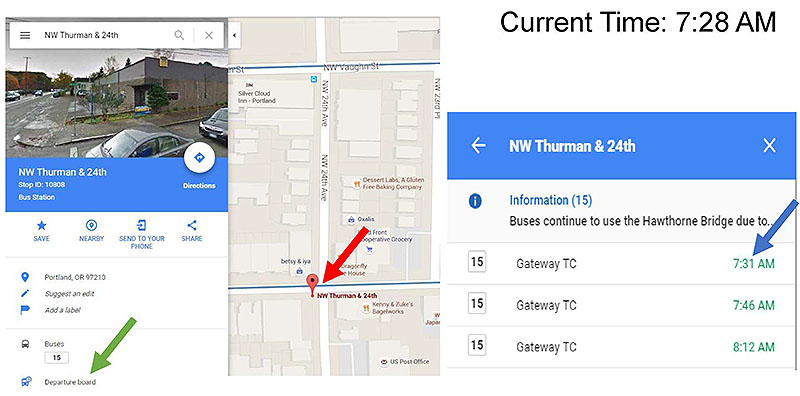
(Extended Text Description: This slide contains two screenshots. The leftmost screenshot shows Google Maps. This screenshot contains two panels. The left panel contains a search bar at the top with text reading NW Thurman & 24th. Below that is a photograph of the corner. Below that is a blue bar with multiple lines of text. The first line of text reads NW Thurman & 24th. The second line of text reads Stop ID: 10808. The third line reads Bus Station. To the top right of the blue bar is a white circle with a blue diamond shaped icon in the middle containing a right facing arrow. Below the circle is text reading Directions. Below the blue bar is a series of four icons form left to right, all colored blue with blue text below. The first icon is a star with text below reading SAVE. The second is a circle with a place marker in the middle and text below reading NEARBY. The third is a mobile phone with a right pointing arrow and text below reading SEND TO YOURPHONE. The fourth is a series of two intersecting lines resembling a less than sign with a circle at the ends of the lines and the intersection point and text below reading SHARE. Below this are a series of lines each containing an icon and text to the right. The first line has a blue place marker icon with text reading Portland, OR 97210. The next line has a blue pencil with italic text reading Suggest an edit. The next line has a blue flag with italic text below reading Add a label. A solid horizontal line appears before the next line. The next line has a black bus icon and text reading Buses. Below that text is a rectangular box with text containing the number 15 within it. The next line has a blue bus icon with a clock icon in the corner and text reading Departure Board. A green arrow points to this text. The right panel of the screenshot is a street map. Two horizontal streets and two vertical streets are visible. Blue lines appear to transverse the horizontal streets. At the bottom left corner of the intersection closest to the bottom left is a red place marker icon with text reading NW Thurman & 24th. A red arrow points to this intersection as well. The rightmost screenshot shows a list of upcoming departures to a stop. At the top is a blue bar with white text reading NW Thurman & 24th. To the left is a left pointing arrow and to the right is a x. Below the blue bar is a gray bar. To the left is a blue circle with a white i. To the right is blue text reading Information (15). The next line says Buses continue to use the Hawthorne Bridge due to… Below the gray bar is a white section with three lines separated by solid horizontal lines. All lines have a rectangle with text reading 15 followed by text reading Gateway TC followed by a time. The times are green and read 7:31 AM, 7:46 AM, and 8:12 AM respectively. There is a blue arrow pointing to the 7:31 AM time.)
Source: Google Maps

Slide 7:
Background of GTFS-realtime
Overview
- Real time version of the General Transit Feed Specification (GTFS)
- Launched in 2011- 6 cities initially
- Maintained by Google
- Specification, not a standard
-
Information/Feed Types Included
- Trip Update- When will the vehicle arrive/depart?
- Vehicle Position- Where is the vehicle?
- Alerts-Are any planned or unplanned events affecting service?

Slide 8:
Background of GTFS-realtime
What GTFS-realtime is and is not
-
GTFS-realtime is:
- Format for sharing real-time transit information
- Set of rules for encoding such data
-
GTFS-realtime is not:
- Software that provides real-time information
- Software that uses real-time information
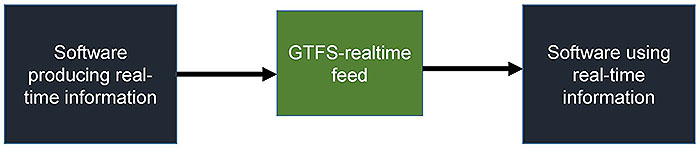
(Extended Text Description: The slide contains a graphic with three boxes arranged horizontally, left to right. The first box is dark blue and has white text reading "Software producing real-time information". A black line with an arrow pointing to the right points to the middle box which is green and has white text reading "GTFS-realtime feed". This box is smaller in height than the other two boxes. A black line with an arrow leads to the final box which is dark blue and has white text reading "Software using real-time information".)
Slide 9:
Background of GTFS-realtime
Specification Update Process
- Specification maintained by Google
- No formal standardization process
- Focuses on online discussion forum
- Advantages and Disadvantages to this process
Slide 10:
Background of GTFS-realtime
Specification Update Process
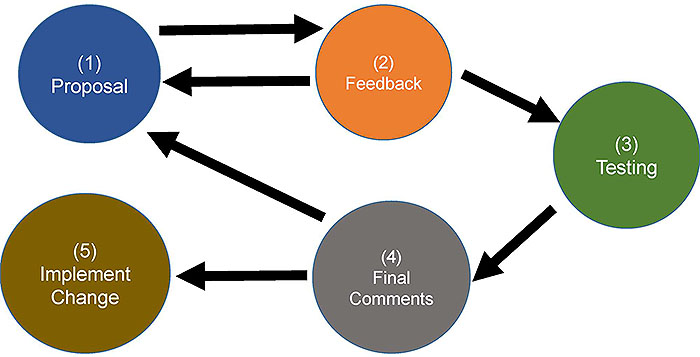
(Extended Text Description: This slide contains a graphic. At the top left is a blue circle with white text reading (1) Proposal. A black horizontal line with an arrow at the right leads out from the blue circle, and a second black horizontal line with an arrow at the left leads into the blue circle below the first arrow. To the right of the arrows is an orange circle with white text reading (2) Feedback. To the right of the orange circle a black line with an arrow at the end points down and to the right. The arrow points to a green circle with white text that reads (3) Testing. To the left of the green circle a black line with an arrow at the left points down and to the left. The arrow points to a gray circle with white text that reads (4) Final Comments. To the left of the gray circle are two black lines with arrows at the left. The first leads up and to the left to the blue circle mentioned previously. The second line out of the gray circle leads to a gold circle with white text reading (5) Implement Change.)

Slide 11:
Background of GTFS-realtime
Alternatives to GTFS-realtime
-
Transit Communications Interface Profiles (TCIP)
- American Public Transportation Association (APTA)
- ITS Transit Standards Modules 3 and 4
-
Service Interface for Real Time Information (SIRI)
- European Committee for Standardization (CEN)
- Several deployments in the United States
Slide 12:
Benefits and Uses of GTFS-realtime
Uses and Users
-
Uses
- Customer facing information
- Performance Measurement
-
Using the three feed types
- Trip Update
- Vehicle Position
- Alerts
-
Users
- 3rd Party Developers
- Agency Staff, Consultants, and Systems
Slide 13:
Benefits and Uses of GTFS-realtime
GTFS-realtime and the National ITS Architecture
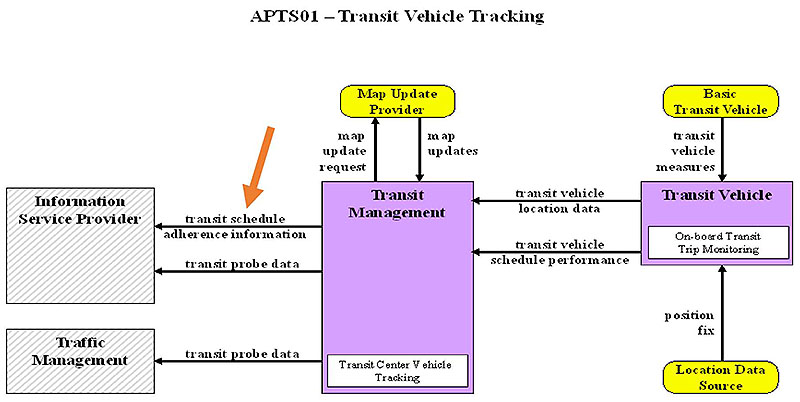
(Extended Text Description: This slide contains a graphic. At the top center of the graphic is a title APTS01 – Transit Vehicle Tracking. The center of the graphic contains a purple box with a title at the upper center reading Transit Management. At the bottom of the box is a white box with text reading Transit Center Vehicle Tracking. To the left of this box are two boxes stacked on top of each other with a space between. The top box has a title reading Information Service Provider. Two arrows flow from the Transit Management box, the top arrow reads transit schedule adherence information and the bottom arrow reads transit probe data. A large orange arrow points to the first of these arrows flowing between boxes. The second box to the left of the Transit Management box reads Traffic Management. A single arrow flows into this box from the Transit Management box reading transit probe data. Above the Transit Management Box is a yellow box entitled Map Update Provider. An arrow flows into this box from the Transit Management box reading map update request and an arrow follows from this box to the Transit Management box reading map updates. To the right of the Transit Management box is a purple box entitled Transit Vehicle. This box contains a white box within it with text reading On-board Transit Trip Monitoring. Two arrows flow from the Transit Vehicle box into the Transit Management box. The top arrow reads transit vehicle location data and the bottom arrow reads transit vehicle schedule performance. There is a yellow box above the Transit Vehicle box entitled Basic Transit Vehicle with an arrow leading down into the Transit Vehicle box reading transit vehicle measures. There is a yellow box below the Transit Vehicle box reading Location Data Source with an arrow leading into the Transit Vehicle box reading position fix.)
Source: USDOT/National ITS Architecture
Slide 14:
Benefits and Uses of GTFS-realtime
GTFS-realtime and the National ITS Architecture
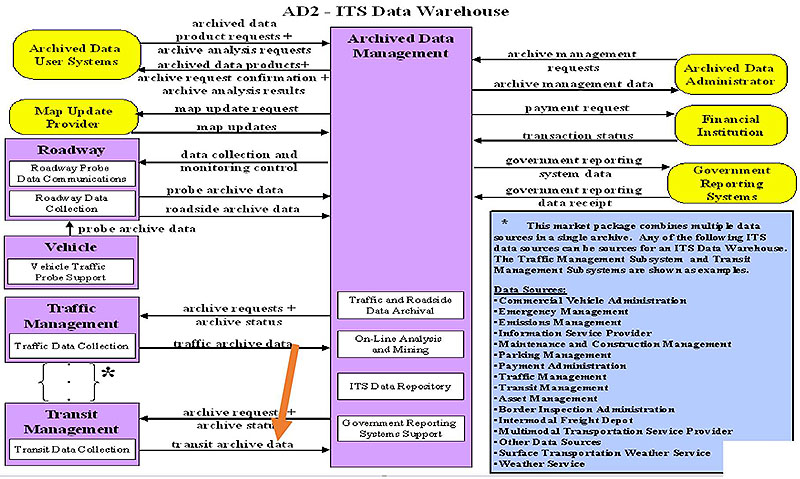
(Extended Text Description: This slide contains a graphic. At the top center is a title AD2- ITS Data Warehouse. At the center is a vertically oriented purple rectangular box with the title Archived Data Management. Towards the bottom of the box are four whit rectangular boxes with text reading Traffic and Roadside Data Archival, On-Line Analysis and Mining, ITS Data Repository, and Government Reporting Systems Support. To the left of the center box, the following boxes appear from top to bottom. A yellow box entitled Archived Data User Systems. A yellow box entitled Map Update Provider. A purple box entitled Roadway. This box contains two white rectangular boxes entitled Roadway Probe Data Communications and Roadway Data Collection. A purple box entitled Vehicle. This box contains a white rectangular box entitled Vehicle Traffic Probe Support. A purple box entitled Traffic Management. This box contains a white rectangular box entitled Traffic Data Collection. A purple box entitled Transit Management. This box contains a white box entitled Transit Data Collection. Between the Traffic Management and Transit Management boxes are two brackets with 3 vertically oriented dots. An asterisk appears to the right of the brackets. To the right of the center box, three yellow boxes appear, entitled from top to bottom: Archived Data Administrator, Financial Institution, and Government Reporting Systems. Flows are black lines with an arrowhead on the end adjacent to the recipient end of the flow. The following flows exist in this diagram between boxes:
-
Archived Data User Systems to Archived Data Management: archived data product requests + archive analysis requests
-
Archived Data Management to Archived Data User Systems: archived data products + archive request confirmation + archive analysis results
-
Archived Data Management to Map Update Provider: map update request
-
Map Update Provider to Archived Data Management: map updates
-
Archived Data Management to Roadway: data collection and monitoring control
-
Roadway to Archived Data Management: probe archive data
-
Roadway to Archived Data Management: roadside archive data
-
Vehicle to Roadway: probe archive data
-
Archived Data Management to Traffic Management: archive requests + archive status
-
Traffic Management to Archived Data Management: traffic archive data
-
Archived Data Management to Transit Management: archive request + archive status
-
Transit Management to Archived Data Management: transit archive data. (A large orange arrow points to this flow.)
-
Archived Data Administrator to Archived Data Management: archive management requests
-
Archived Data Management to Archived Data Administrator: archive management data
-
Archived Data Management to Financial Institution: payment request
-
Financial Institution to Archived Data Management: transaction status
-
Archived Data Management to Government Reporting Systems: government reporting system data
-
Government Reporting Systems to Archived Data Management: government reporting data receipt.
At the bottom right of the graphic is a blue box with the following text: This market package combines multiple data sources to a single archive. Any of the following ITS data sources can be sources for an ITS Data Warehouse. The Traffic Management Subsystem and Transit Management Subsystems are shown as examples. The next line had the words Data Sources underlined, followed by the following list, with each item appearing on a separate line: Commercial Vehicle Administration, Emergency Management, Emissions Management, Information Service Provider, Maintenance and Construction Management, Parking Management, Payment Administration, Traffic Management, Transit Management Asset Management, Border Inspection Administration, Intermodal Freight Depot, Multimodal Transportation Service Provider, Other Data Sources, Surface Transportation Weather Service, and Weather Service.)
Source: USDOT/ National ITS Architecture

Slide 15:
Benefits and Uses of GTFS-realtime
Benefits of Implementing GTFS-realtime
- Provide real time information to customers
- Required data inputs often available
- Open source tools available
- Becoming widely-accepted and deployed
Slide 16:
Target Devices for Real Time Information
Applications
- Customer applications
- Smartphone and desktop
- Electronic signage
- Performance analysis tools
- Google Maps Transit
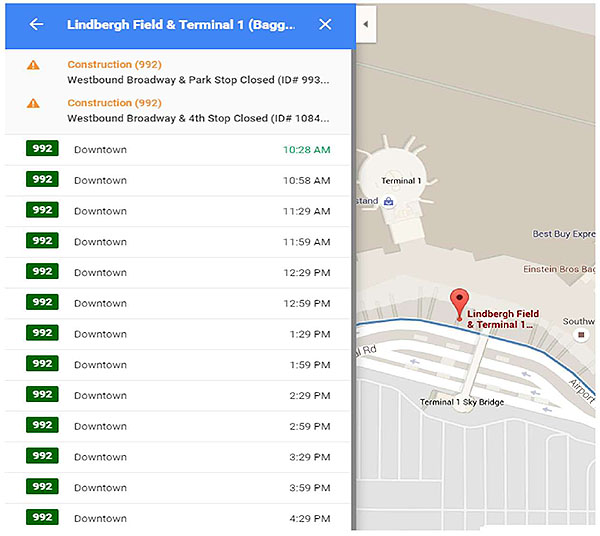
(Extended Text Description: This slide contains a graphic. There are two panels of the graphic. The top consist of a blue bar with white text that reads Lindbergh Field & Terminal 1 (Bagg… There is a left facing arrow to the left of the text and an x to the right. Below that is a section with a white background. The first line has a caution icon which consists of an orange triangle with a white exclamation point. To the right of the icon is orange text that reads Construction (992). The next line contains black test that reads Westbound Broadway & park Stop Closed (ID# 993… The next line has a caution icon which consists of an orange triangle with a white exclamation point. To the right is orange text that reads Construction (992). The next line has black text that reads Westbound Broadway & 4th Stop Closed (ID# 1084… The next thirteen lines follow a consistent pattern. Each line starts with a green box with white text reading 992. To the right is black text reading Downtown. To the right is a time, which is green for the first line and black for all remaining lines. The times read as follows from top to bottom 10:28 AM, 10:58 AM, 11:29 AM, 11:59 AM, 12:29 PM, 12:59 PM, 1:29 PM, 1:59 PM, 2:29 PM, 2:59 PM, 3:29 PM, 3:59 PM, 4:29 PM. The right panel consists of a map of an airport terminal and surrounding roadways. The roadway immediately adjacent to the terminal has a blue line. At one point adjacent to this roadway is a red place marker with text reading Lindbergh Field & Terminal 1… At the top on the left of this panel is a small white box with a left facing arrowhead.)
Source: Google Maps
Slide 17:

Slide 18:
Question
Which of the following groups may participate in developing the GTFS-realtime specification?
Answer Choices
- Transit Agency Staff
- Planning Tool Users
- Smartphone Application Developers
- All of the Above
Slide 19:
Review of Answers
 a) Transit Agency Staff
Incorrect. This is only one group that may participate.
b) Planning Tool Users
Incorrect. This is only one group that may participate.
c) Smartphone Application Developers
Incorrect. This is only one group that may participate.
 d) All of the Above
Correct! Anyone who can claim involvement with GTFS-realtime may participate.
Slide 20:
Learning Objective 2
- Apply transit source applications to GTFS-realtime
Slide 21:
Data Necessary to Create a GTFS-realtime Feed
Data Types
-
Three feed types in GTFS-realtime:
- Trip Update
- Vehicle Position
- Alerts
-
Why is this information important?
- It answers key questions about the current status of transit service

Slide 22:
Data Necessary to Create a GTFS-realtime Feed
Trip Update
- WHEN will Trip/Vehicle A arrive at location X?
- WHAT is the delay of the trip?
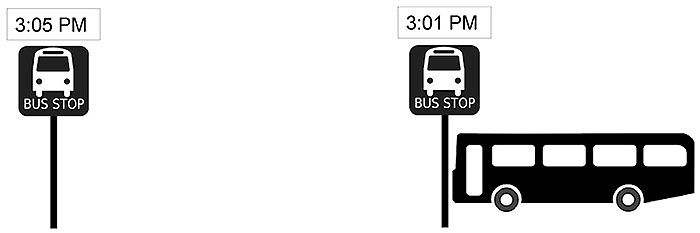
(Extended Text Description: This slide contains a graphic. The graphic depicts two bus stop signs, which each have a bus icon and text reading BUS STOP below. Each sign is mounted on a pole. Above the leftmost sign is a rectangular box with text reading 3:05 PM. Above the rightmost sign is a rectangular box reading 3:01 PM. To the right of the rightmost sign is a bus, which during animation moves to a position just to the right of the leftmost sign.)
Source: https://openclipart.org
Slide 23:
Data Necessary to Create a GTFS-realtime Feed
Vehicle Position
- WHERE is vehicle B right now?
-
To answer this need, we ask:
- WHAT are the GPS coordinates of the vehicle? OR
- WHAT stop is the vehicle en route to/approaching/physically stopped at?
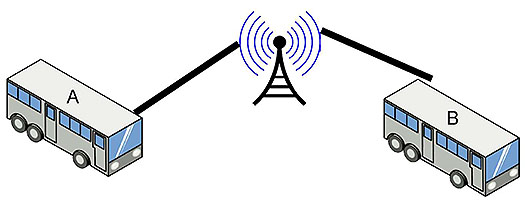
(Extended Text Description: This slide contains two buses, which have labels on top. The bus on the left has a label A and the bus on the right has a label B. Between the two buses is a radio antenna with semicircular blue lines emitting out of either side denoting a broadcasting antenna. A black line connects the top of each bus to the antenna.)
Source: https://openclipart.org
Slide 24:
Data Necessary to Create a GTFS-realtime Feed
Alert
- WHAT is happening?
- WHERE is it happening?
- WHEN is it happening?
- HOW does this affect service?
Source: https://openclipart.org
Slide 25:
Data Necessary to Create a GTFS-realtime Feed
GTFS-realtime Data Sources
- Computer Aided Dispatch (CAD)
- Automatic Vehicle Location (AVL)
- Incident Management Systems (IMS)
- Existing Data Feeds
- Reference Data (GTFS)
Slide 26:
Issues with Providing Stop Time Update (ETA) Data
Predicting Estimated Time of Arrival
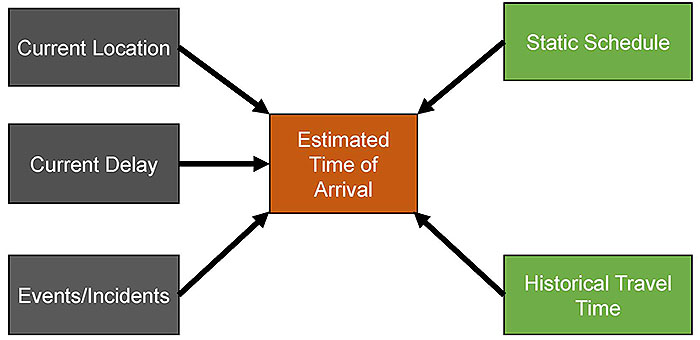
(Extended Text Description: This slide contains a graphic. On the left there are three gray boxes moving top to bottom with a space between each one, each containing text. The top box says Current Location, the next box says Current Delay, and the bottom box says Events/Incidents. Each of these three boxes has a line with arrow emitting from the right side of the box leading to an orange box in the center with text reading Estimated Time of Arrival. At the right are two green boxes with text, one above the other with a space between. The top box says Static Schedule and the bottom box says Historical Travel Time. A black line with an arrow emits from the left side of these boxes leading to the orange box at the center.)
Slide 27:
Issues with Providing Stop Time Update (ETA) Data
ETA Issues
- Stop Time Updates disseminate predicted arrival/departure times
- Predictions depend on data available
- Data should only be shown if it is reliable
- High reliability = high confidence in accuracy
- Current delay may be a better field to display
Source: Google Maps
Slide 28:
GTFS-realtime Content and Structure
Protocol Buffers
- GTFS-realtime is encoded in Protocol Buffer format
- "Binary String"- Not human readable
- Must translate into a text format to appear readable
- ".proto" files define the structure
Slide 29:
GTFS-realtime Content and Structure
Protocol Buffers
entity {
id: "V1001"
is_deleted: false
vehicle {
trip {
trip_id: "121"
start_time: "15:23:00"
start_date: "20160512"
schedule_relationship: SCHEDULED
route_id: "2"
direction_id: 1
}
current_stop_sequence: 19
current_status: IN_TRANSIT_TO
timestamp: 1463080565700
stop_id: "96"
}
}
Source: TRANSCOM
Slide 30:
GTFS-realtime Content and Structure
Organization of a GTFS-realtime Feed
- GTFS-realtime is a series of messages
- Messages contain fields
-
Fields may be
- Another message
- Single value
- Does not support request/response
- Broadcast messages
- Can be extended
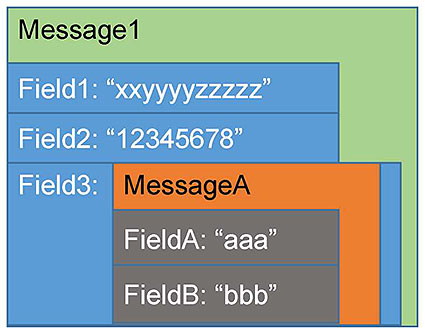
(Extended Text Description: This slide contains a graphic. The graphic consists of multiple layers superimposed on other layers, so full layers are not entirely visible. The back layer is a green rectangle with the text Message1 in black writing on the top left. Below the text is a blue rectangle with text Field1: xxyyyyzzzzz. Which stops short of the right edge of the green layer, so that some green is visible to the right. There is a second blue rectangle of the same width with white text Field2: 12345678. Below that is a larger blue blocks slightly wider than the first two and with a height extending to the bottom of the green layer. On the left it contains white text Field3. To the right obscuring part of the blue rectangle is an orange layer, with black text at the top reading MessageA. Below the text, but within the orange box are two gray rectangle boxes stacked on top of each other and consuming the rest of the height of the orange box. The first box has white text reading FieldA: aaa. The second box has white text reading FieldB: bbb. The width of the gray boxes stops short of the end of the orange box.)
Slide 31:
GTFS-realtime Content and Structure
GTFS-realtime Field Details
- Message
- Series of fields
- Type of fields
- Required, Optional, Repeated
- Description
- POSIX TIME- Seconds since Jan 1, 1970
- Experimental
POSIX
12:00:00 AM on January 1, 2016 EST
1464104462 sec since 12:00 AM January 1, 1970 GMT
Slide 32:
GTFS-realtime Content and Structure
GTFS-realtime Data Types
| Data Type | Example |
|---|---|
| message |
departure{ time: 8432342345 } |
| enum | SCHEDULED |
| string | "express1" |
| uint32, uint64 | 120 |
| int32, int64 | -20 |
| float/double | 57.4232425 |
| bool | true |
Slide 33:
GTFS-realtime Content and Structure
GTFS-realtime Specification Structure
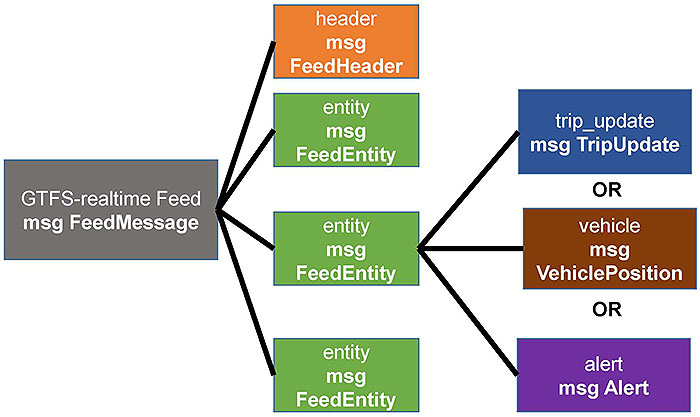
(Extended Text Description: This slide contains a graphic. At the left is a gray box with normal text reading GTFS-realtime Feed and bolded text below that reading msg FeedMessage. Black lines lead out of the gray box to the right, each going to one of four parallel boxes in the center. The top box is orange with normal text reading header and bolded text below that reading msg FeedHeader. Moving downward, the remaining three boxes are green with normal text reading entity and bolded text below that reading msg FeedEntitiy. Three black line extend out of the second green box, each leading to a series of parallel boxes on the right. These boxes move top to bottom with the word OR appearing between the first two and last two boxes. The top box is blue with normal text reading trip_update and bolded text below that reading msg TripUpdate. The second box is brown with normal text reading vehicle and bolded text below that reading msg VehiclePosition. The final box is purple with normal text reading alert and bolded text below that reading msg Alert. All text is white in this graphic.)
Slide 34:
GTFS-realtime Content and Structure
FeedMessage
| Field | Required/Optional | Type |
|---|---|---|
| header | required | msg FeedHeader |
| entity | repeated | msg FeedEntity |
Slide 35:
GTFS-realtime Content and Structure
FeedMessage
header{
gtfs_realtime_version: "1"
timestamp: 1461619328
}
entity {
id: "351"
trip_update {
trip {
route_id: "2"
}
stop_time_update {
departure {
delay: 0
time: 1461619440
}
stop_id: "68"
}
vehicle {
label: "351"
}
}
}
Source: TRANSCOM
Slide 36:
GTFS-realtime Content and Structure
FeedHeader
| Field | Required/Optional | Type |
|---|---|---|
| gtfs_realtime_version | required | string |
| incrementality | optional |
enum Incrementality: FULLJDATASET DIFFERENTIAL |
| timestamp | integer | uint64 |
header {
gtfs_realtime_version: "1.0"
incrementality: FULL_DATASET
timestamp: 1463080565700
}
Source: TRANSCOM
Slide 37:
GTFS-realtime Content and Structure
FeedEntity
| Field | Required/Optional | Type |
|---|---|---|
| id | required | sting |
| is_deleted | optional | bool |
| trip_update | optional | msg TripUpdate |
| vehicle | optional | msg VehiclePosition |
| alert | optional | msg Alert |
Slide 38:
GTFS-realtime Content and Structure
FeedEntity
entity {
id: "V1001"
is_deleted: false
vehicle {
trip {
trip_id: "121"
start_time: "15:23:00"
start_date: "20160512"
schedule_relationship: SCHEDULED
route_id: "2"
direction_id: 1
}
current_stop_sequence: 19
current_status: IN_TRANSIT_TO
timestamp: 1463080565700
stop_id: "96"
}
}
Source: TRANSCOM
Slide 39:
GTFS-realtime Content and Structure
TripUpdate
| Field | Required/Optional | Type |
|---|---|---|
| trip | required | msg TripDescriptor |
| vehicle | optional | msg VehicleDescriptor |
| stop_time_update | repeated | msg StopTimeUpdate |
| timestamp | optional | uint64 |
| delay | optional | int32 |
Slide 40:
GTFS-realtime Content and Structure
TripUpdate
trip_update {
trip {
trip_id: "058450_1..N02R"
start_date: "20151104"
route_id: "1"
}
stop_time_update {
arrival {
time: 1446651757
}
departure {
time: 1446652057
}
stop_id: "103N"
}
stop_time_update {
arrival {
time: 1446652147
}
stop_id: "101N"
}
}
Source: NYCT
Slide 41:
GTFS-realtime Content and Structure
TripDescriptor
| Field | Required/Optional | Type |
|---|---|---|
| trip_id* | optional | string |
| route_id* | optional | string |
| direction_id* | optional | uint32 (0 or 1) |
| start_time | optional | string (not POSIX time) |
| start_date | optional | string |
| schedule_relationship | optional |
enum ScheduleRelationship SCHEDULED UNSCHEDULED ADDED CANCELLED |
Values in fields with asterisk (*) should match corresponding GTFS feed exactly
Slide 42:
GTFS-realtime Content and Structure
TripDescriptor
trip {
trip_id: "121"
start_time: "15:23:00"
start_date: "20160512"
schedule_relationship: SCHEDULED
route_id: "2"
direction_id: 1
}
Source: TRANSCOM
Slide 43:
GTFS-realtime Content and Structure
StopTimeUpdate
| Field | Required/Optional | Type |
|---|---|---|
| stop_sequence* | optional | uint32 |
| stop_id* | optional | string |
| arrival | optional | msg StopTimeEvent |
| departure | optional | msg StopTimeEvent |
| schedule_relationship | optional |
enum ScheduleRelationship SCHEDULED SKIPPED NOJDATA |
Values in fields with asterisk (*) should match corresponding GTFS feed exactly
Slide 44:
GTFS-realtime Content and Structure
StopTimeUpdate
stop_time_update {
stop_sequence: 20
arrival {
delay: 0
time: 1463066580000
}
departure {
delay: 0
time: 1463066580000
}
stop_id: "34"
schedule_relationship: SCHEDULED
}
Source: TRANSCOM
Slide 45:
GTFS-realtime Content and Structure
StopTimeEvent
| Field | Required/Optional | Type |
|---|---|---|
| delay | optional | int32 |
| time | optional | int64 |
| uncertainty | optional | int32 |
departure {
delay: 0
time: 1463066580000
}
Source: TRANSCOM
Slide 46:
GTFS-realtime Content and Structure
VehiclePosition
| Field | Required/Optional | Type |
|---|---|---|
| trip | optional | msg TripDescriptor |
| vehicle | optional | msg VehicleDescriptor |
| position | optional | msg Position |
| current_stop_sequence* | optional | uint32 |
| stop_id* | optional | string |
| current_status | optional |
enum VehicleStopStatus INCOMING_AT STOPPED_AT IN_TRANSIT_TO |
| timestamp | optional | uint64 |
Values in fields with asterisk (*) should match corresponding GTFS feed exactly
Slide 47:
GTFS-realtime Content and Structure
VehiclePosition
| Field | Required / Optional | Type |
|---|---|---|
| congestion_level | optional |
enum CongestionLevel UNKNOWN_CONGESTION_LEVEL RUNNING_SMOOTHLY STOP_AND_GO CONGESTION SEVERE_CONGESTION |
| occupancy_status | optional |
enum OccupancyStatus EMPTY MANY_SEATS_AVAILABLE FEW_SEATS_AVAILABLE STANDING_ROOM_ONLY CRUSHED_STANDING_ROOM_ONLY FULL NOT_ACCEPTING_PASSENGERS |
Slide 48:
GTFS-realtime Content and Structure
VehiclePosition
vehicle {
trip {
trip_id: "30118425" start_date: "20160516"
route_id: "1"
direction_id: 1
}
position {
latitude: 42.3722686768
longitude: -71.1155471802
bearing: 220.0
}
current_stop_sequence: 4
current_status: STOPPED_AT
timestamp: 1463433348
stop_id: "2167"
vehicle {
id: "y2294"
label: "2294"
}
}
Source: MBTA
Slide 49:
GTFS-realtime Content and Structure
VehicleDescriptor
| Field | Required / Optional | Type |
|---|---|---|
| id | optional | string |
| label | optional | string |
| license_plate | optional | string |
vehicle {
id: "y2294"
label: "2294"
}
Source: MBTA
Slide 50:
GTFS-realtime Content and Structure
Position
| Field | Required / Optional | Type |
|---|---|---|
| latitude | required | float |
| longitude | required | float |
| bearing | optional | float (0-360) |
| odometer | optional | double |
| speed | optional | float |
position {
latitude: 42.3722686768
longitude: -71.1155471802
bearing: 220.0
}
Source: MBTA
Slide 51:
GTFS-realtime Content and Structure
Alert
| Field | Required / Optional | Type |
|---|---|---|
| active_period | repeated | msg TimeRange |
| informed_entity | repeated | msg EntitySelector |
| cause | optional | enum Cause |
| effect | optional | enum Effect |
| url | optional | msg TranslatedString |
| header_text | optional | msg TranslatedString |
| description_text | optional | msg TranslatedString |
Slide 52:
GTFS-realtime Content and Structure
Alert
| enum Cause | enum Effect |
|---|---|
| UNKNOWN_CAUSE | NO_SERVICE |
| OTHER_CAUSE | REDUCED_SERVICE |
| TECHNICAL PROBLEM | SIGNIFICANT_DELAYS |
| STRIKE | DETOUR |
| DEMONSTRATION | ADDITIONAL_SERVICE |
| ACCIDENT | MODIFIED_SERVICE |
| HOLIDAY | OTHER_EFFECT |
| WEATHER | UNKNOWN_EFFECT |
| MAINTENANCE | STOP_MOVED |
| CONSTRUCTION | |
| POLICE_ACTIVITY | |
| MEDICAL_EMERGENCY |
Slide 53:
GTFS-realtime Content and Structure
Alert
alert {
active_period {
start: 1464020433
end: 1464035632
}
informed_entity {
agency_id: "1"
route_id: "36"
route_type: 3
}
cause: TECHNICAL_PROBLEM
effect: OTHER_EFFECT
header_text {
translation {
text: "Moderate Route 36 delay"
language: "en"
}
}
description_text {
translation {
text: "Route 36 experiencing moderate delays due to disabled bus."
language: "en"
}
}
}
Source: MBTA
Slide 54:
GTFS-realtime Content and Structure
TimeRange
| Field | Required / Optional | Type |
|---|---|---|
| start | optional | uint64 |
| end | optional | uint64 |
active_period {
start: 1464020433
end:1464035632
}
active_period {
start: 1464020433
}
active_period {
end:1464035632
}
Source: MBTA
Slide 55:
GTFS-realtime Content and Structure
EntitySelector
| Field | Required / Optional | Type |
|---|---|---|
| agency_id* | optional | string |
| route_id* | optional | string |
| route_type* | optional | integer |
| trip | optional | msg TripDescriptor |
| stop_id* | optional | string |
Values in fields with asterisk (*) should match corresponding GTFS feed exactly
informed_entity {
agency_id: "1"
route_id: "36"
route_type: 3
}
Source: MBTA
Slide 56:
GTFS-realtime Content and Structure
TranslatedString
| Field | Required / Optional | Type |
|---|---|---|
| translation | repeated | msg Translation |
description_text {
translation {
text: "Route 36 experiencing moderate delays due to disabled bus."
language: "en"
}
}
Source: MBTA
Slide 57:
GTFS-realtime Content and Structure
Translation
| Field | Required / Optional | Type |
|---|---|---|
| text | required | string |
| language** | optional | string |
** acceptable codes for languages can be found at https://www.loc.gov/standards/iso639-2/php/code list.php
translation {
text: "Route 43 experiencing minor delays due to traffic."
language: "en"
}
Source: MBTA
Slide 58:
Translating Source Application Data to GTFS-realtime files
Data Translation Process
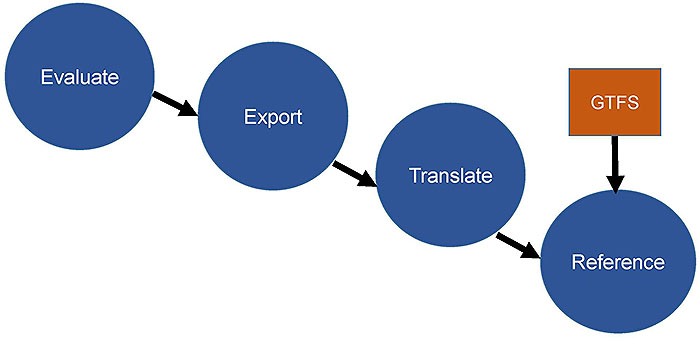
(Extended Text Description: The slide contains a graphic. At the top left is a blue circle with white text reading Evaluate. A black arrow leads from this circle down and to the right to another blue circle with white text reading Export. A black arrow leads from this circle down and to the right to another blue circle with white text reading Translate. A black arrow leads from this circle down and to the right to another blue circle with white text reading Reference. There is an orange box directly above this box with white text reading GTFS. A black arrow leads from the orange box to the blue circle directly below it.)
Slide 59:
Related Tools for GTFS-realtime
Tools
- No commonly used stand-alone off-the-shelf tools exist
- Open source tools can be integrated with other software
- CAD/AVL systems can include necessary software
- Custom software may be required

Slide 60:

Slide 61:
Question
Which of the following formats is used for encoding a GTFS-realtime feed?
Answer Choices
- Extensible Markup Language (XML)
- JavaScript Object Notation (JSON)
- Protocol Buffers
- Comma Separated Values (CSV)
Slide 62:
Review of Answers
a) Extensible Markup Language (XML)
Incorrect. GTFS-realtime files are not encoded in XML.
b) Javascript Object Notation (JSON)
Incorrect. GTFS-realtime files are not encoded in JSON.
c) Protocol Buffers
Correct! Protocol Buffers are the format used for GTFS-realtime.
d) Comma Separated Values (CSV)
Incorrect. GTFS-realtime files are not encoded in CSV.
Slide 63:
Question
Which of the following is NOT a way to show location in GTFS-realtime
Answer Choices
- Latitude/Longitude
- Stop sequence on a trip
- Stop identifier
- Distance to destination
Slide 64:
Review of Answers
a) Latitude and Longitude
Incorrect. The field's latitude and longitude are used for this.
b) Stop sequence on a trip
Incorrect. The field current_stop_sequence is used for this.
c) Stop identifier
Incorrect. The field stop_id is used for this.
d) Distance to destination
Correct! There is no field for this in GTFS-realtime.
Slide 65:
Learning Objective 3
- Implementation of GTFS-realtime
Slide 66:
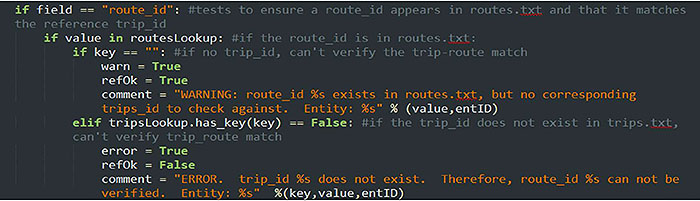
Testing GTFS-realtime Files and GTFS-realtime Validation Tools
-
Why is testing important?
- Need to ensure high quality data
-
Types of Testing
- Specification Conformance
- Is the data Accurate?
- Appropriate references
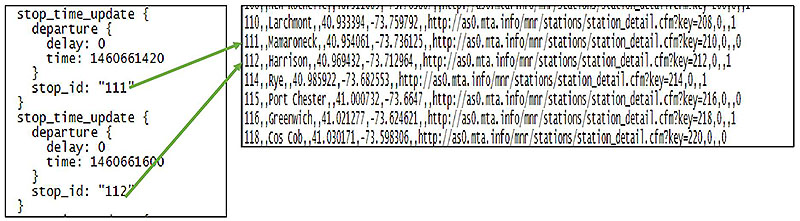
(Extended Text Description: This slide contains a graphic. At the left of the graphic is a screenshot from a GTFS-realtime feed, which reads as follows:
stop_time_update {
departure{
delay: 0
time: 1460661420
}
stop_id: "111"
}
stop_time_update{
departure{
delay: 0
time: 1460661600
}
stop_id: "112"
}
To the right is a screenshot from a GTFS feed, reading:
110,,Larchmont,,40.933394,-73.759792,,http://as0.mta.info/mnr/stations/station_detail.cfm?key=208,0,,1
111,,Mamaroneck,,40.954061,-73.736125,,http://as0.mta.info/mnr/stations/station_detail.cfm?key=210,0,,0
112,,Harrison,,40.969432,-73.712964,,http://as0.mta.info/mnr/stations/station_detail.cfm?key=212,0,,1
114,,Rye,,40.985922,-73.682553,,http://as0.mta.info/mnr/stations/station_detail.cfm?key=214,0,,1
115,,Port Chester,,41.000732,-73.6647,,http://as0.mta.info/mnr/stations/station_detail.cfm?key=216,0,,0
116,,Greenwich,,41.021277,-73.624621,,http://as0.mta.info/mnr/stations/station_detail.cfm?key=218,0,,1
118,,Cos Cob,,41.030171,-73.598306,,http://as0.mta.info/mnr/stations/station_detail.cfm?key=220,0,,0
There are two green arrows linking the two diagrams. One travels from stop_id: 111 in the left diagram to the 111 in the right diagram. One travels from stop_id: 112 in the left diagram to the 112 in the right diagram.)
Source: Metro North Railroad
Slide 67:
Testing GTFS-realtime Files and GTFS-realtime Validation Tools
- No off-the-shelf GTFS-realtime testing tools, some open source tools in development
- Testing typically built into production tools or consumption tools
- Google's open source software modules provide rudimentary testing
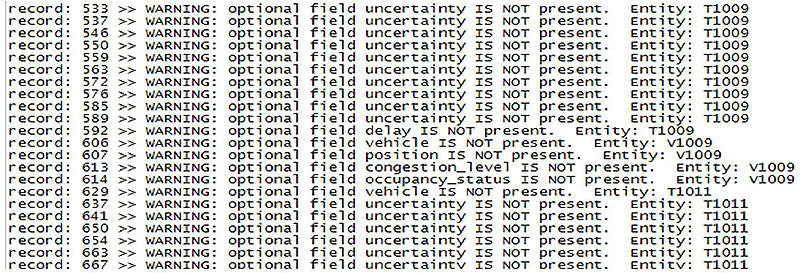
(Extended Text Description: This slide contains a graphic, which is a screenshot of a text file. The file reads as follows:
record: 533 >> WARNING: optional field uncertainty IS NOT present. Entity: T1009
record: 537 >> WARNING: optional field uncertainty IS NOT present. Entity: T1009
record: 546 >> WARNING: optional field uncertainty IS NOT present. Entity: T1009
record: 550 >> WARNING: optional field uncertainty IS NOT present. Entity: T1009
record: 559 >> WARNING: optional field uncertainty IS NOT present. Entity: T1009
record: 563 >> WARNING: optional field uncertainty IS NOT present. Entity: T1009
record: 572 >> WARNING: optional field uncertainty IS NOT present. Entity: T1009
record: 576 >> WARNING: optional field uncertainty IS NOT present. Entity: T1009
record: 585 >> WARNING: optional field uncertainty IS NOT present. Entity: T1009
record: 589>> WARNING: optional field uncertainty IS NOT present. Entity: T1009
record: 592>> WARNING: optional field delay IS NOT present. Entity: T1009
record: 606>> WARNING: optional field vehicle IS NOT present. Entity: V1009
record: 607>> WARNING: optional field position IS NOT present. Entity: V1009
record: 613>> WARNING: optional field congestion_level IS NOT present. Entity: V1009
record: 614>> WARNING: optional field occupany_status IS NOT present. Entity: V1009
record: 629>> WARNING: optional field vehicle IS NOT present. Entity: T1011
record: 637 >> WARNING: optional field uncertainty IS NOT present. Entity: T1011
record: 641 >> WARNING: optional field uncertainty IS NOT present. Entity: T1011
record: 650 >> WARNING: optional field uncertainty IS NOT present. Entity: T1011
record: 654 >> WARNING: optional field uncertainty IS NOT present. Entity: T1011
record: 663 >> WARNING: optional field uncertainty IS NOT present. Entity: T1011
record: 667 >> WARNING: optional field uncertainty IS NOT present. Entity: T1011
Slide 68:
How an Agency Implements GTFS-realtime
Implementation Checklist
- Determine need for real time information
- Inventory existing systems and data
- Determine feasibility
- Procure and/or Develop
- Produce and provide data
Slide 69:
How an Agency Implements GTFS-realtime
Should GTFS-realtime be implemented?
-
Established need: Identify usage
- Will customers benefit from real-time information?
- Will archiving real-time information be useful?
- Do downstream applications exist?
-
Determine feasibility
- Can existing systems be leveraged?
- Does funding exist for procurement if needed?
- Can a system that produces GTFS-realtime feeds be maintained?
- Is GTFS-realtime the correct format to use?
Slide 70:
How an Agency Implements GTFS-realtime
Procurement
- Use Systems Engineering Process
-
User needs
- Ex. Downstream users need to receive trip update information
-
Functional Requirements
- Ex. The system shall export a G TFS-realtime feed containing the TripUpdate, VehiclePosition, and Alert messages
-
Performance Requirements
- Ex. The system shall provide an updated GTFS-realtime feed every 30 seconds
Slide 71:
How an Agency Implements GTFS-realtime
Data Lifecycle Requirements and Strategies
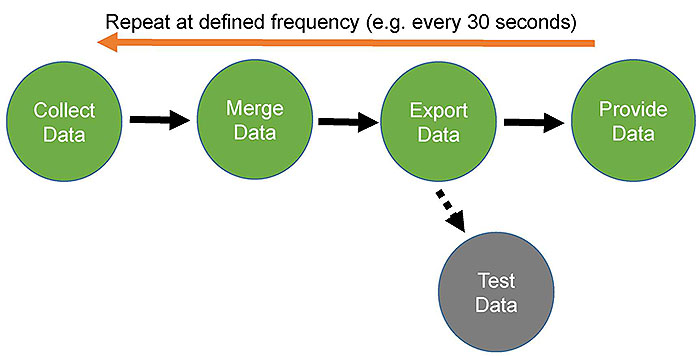
(Extended Text Description: The slide contains a graphic with green circles in a horizontal line, from left to right. All circles have white text. The first green circle has text reading Collect Data. A solid black right-facing arrow leads to the next green circle with text reading Merge Data. A solid black right-facing arrow leads to the next green circle with text reading Export Data. A solid black right-facing arrow leads to the next green circle with text reading Provide Data. From the Export Data circle, a dashed black line leads down and to the right to a gray circle with white text reading Test Data. At the top of the graphic is a long orange left-facing horizontal arrow, with a label reading Repeat at defined frequency (e.g. every 30 seconds).)
Slide 72:
How an Agency Implements GTFS-realtime
Making Data Accessible
- Fixed location
- Agencies define Application Programming Interface (API) for requests
- Typically HTTP request
- Access often must be granted
- Need to make static GTFS accessible
Slide 73:

Slide 74:
Agency Case Study
TRANSCOM
- TRANSCOM (NY/NJ/CT Metro Region)
- 16 member agencies
- Consolidating real time transit data
- Providing GTFS-realtime
- Data provided to downstream users
- Developing transit dashboard
Slide 75:
Agency Case Study
TRANSCOM
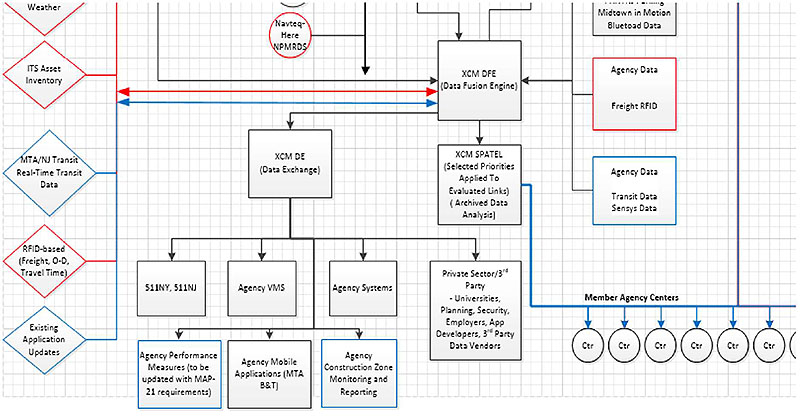
(Extended Text Description: This slide contains a graphic. This a screenshot showing a subset of a diagram. On the left of the diagram are vertically arranged diamond shapes with text in them and a short line moving horizontally to the right from the apex of the diamond. Moving from top to bottom: Only the bottom of the first shape is visible, which is outlined in red, and has the text Weather visible. The next is outlined in red and has the text ITS Asset Inventory. The next is outlined in blue and contains the text MTA/NJ Transit Real-Time Transit Data. The next is outlined in red and contains the text RFID-based (Freight, O-D, Travel Time). The next is outlined in blue and contains the text Existing Application Updates. A vertical line connects all of these shapes. Two parallel horizontal lines, one red and one blue, with arrows on each end, move to the right to a black box entitled XCM DFE (Data Fusion Engine). Data is flowing in via lines from a series of boxes. Visible boxes, which are located to the right, read Midtown in Motion, Bluetoad Data, Agency Data, Freight RFID (outlined in red), and Agency Data, Transit Data, Sensys Data (outlined in blue). Data flows out of the XCM DFE box to a box entitled XCM DE (Data Exchange). Data flows from this box to 7 boxes, 511NY, 511NJ, Agency VMS, Agency Systems, Private Sector/3rd Party- Universities, Planning, Security, Employers, App Developers, 3rd Party Data Vendors, Agency Performance Measures (to be updated with MAP-21 requirements) (outlined in blue), Agency Mobile Applications (MTA B&T), Agency Construction Zone Monitoring and Reporting (outlined in blue). Data also flows out of the XCM DFE box to a box entitled XCM SPATEL (Selected Priorities Applied to Evaluated Links) (Archived Data Analysis). Data then flows from this box via a blue line to a series of circles with the text Ctr in them. Six full circles and part of one more are visible. A label next to the line says Member Agency Centers. A second vertical line leads to this line with no clear path. Also visible at the top of the diagram is a red circle with text reading Navteq HERE NPMRDS. And lines connecting to it following no clear path.)
Source: TRANSCOM /ConSysTec
Slide 76:
Agency Case Study
TRANSCOM
-
Feeds
- NJ Transit Rail (Year 1)- Custom XML
- NJ Transit Bus (Year 2)- Custom XML
- MTA NYCT Subway (Year 2)- GTFS-realtime
- MTA Long Island Rail Road (Year 2)- GTFS-realtime
- MTA Metro North Railroad (Year 2)- GTFS-realtime
- MTA NYCT Bus (Year 3)- SIRI
-
Lessons learned
- Document the meaning of the data
- Understand the meaning of data when integrating multiple sources
Slide 77:

Slide 78:
Question
Which of the following methods is most commonly used to access GTFS-realtime feeds?
Answer Choices
- FTP
- HTTP
- Telephone
Slide 79:
Review of Answers
a) Email
Incorrect. Email is too slow.
b) FTP
Incorrect. FTP is not typically used.
c) HTTP
Correct! HTTP is commonly used to share GTFS-realtime feeds.
d) Telephone
Incorrect. This is not an electronic format.
Slide 80:
Module Summary
What We Have Learned
- The background of the GTFS-realtime specification, its benefits and its uses.
- How GTFS-realtime feeds are structured, the content of the feeds, and how the feeds are created.
- How agencies test and implement GTFS-realtime feeds.
This module taught us about the GTFS-realtime specification and how it can be used.
Slide 81:
Thank you for completing this module.
Feedback
Please use the Feedback link below to provide us with your thoughts and comments about the value of the training.
Thank you!