Module 14 Part 2: Applying GTFS-realtime to Your Agency
Student Supplement
(Note: This document has been converted from the Student Supplement to 508-compliant HTML. The formatting has been adjusted for 508 compliance, but all the original text content is included, plus additional text descriptions for the images, photos and/or diagrams have been provided below.)
Module 14 Part 2: Applying GTFS-realtime to Your Agency
Table of Contents
Module Description - 2
Introduction/Purpose - 2
Samples/Examples - 2
Case Studies - 12
Glossary - 12
References - 14
Study Questions - 14
Icon Guide - 15
1. Module Description
This module will teach students about the GTFS-realtime specification. There are three sections of the module. In the first part, students will learn about the history of the GTFS-realtime specification, the process for updating the specification, and the benefits and uses. In the second part, students will learn about what data is needed for a GTFS-realtime feed, the structure of GTFS-realtime feeds, the content of a GTFS-realtime feeds, and tools for working with the specification. In the third and final part, students will learn about how agencies implement GTFS-realtime, including testing, data lifecycle, procurement, and providing the data to downstream users.
2. Introduction/Purpose
The purpose of Part 2 is to discuss GTFS-realtime. As an extension of GTFS, the General Transit Feed Specification Realtime (GTFS- realtime) is a data feed specification that allows public transportation agencies to provide real-time updates about their fleet. The GTFS specification is an open data format for public transportation schedules and associated geographic information. GTFS-realtime was designed around ease of implementation, good interoperability, and a focus on passenger information. This module aims to assist transit agencies in applying the open and accessible GTFS-realtime specification.
GTFS-realtime requires information from various sources to generate quality real time information including GTFS. This module provides an overview of GTFS-realtime specification, discussion of the scope, application of how to implement it, and uses of the specifications including how an agency would implement GTFS-realtime. Additionally, this module will describe downstream uses of GTFS-realtime feeds.
3. Samples/Examples
3.1. Sample Procurement Language
The following is an example of procurement language that could be used for a GTFS-realtime procurement. The language shown here is for a hypothetical procurement to protect the integrity of agency procurement processes. In the scenario, the agency is procuring a CAD/AVL system, and wishes to create a GTFS-realtime feed as part of this. The requirements consist of both functional and performance requirements. Please note that only language related to the need to export a GTFS-realtime feed is shown. The language shown does not cover other systems that are needed to produce GTFS-realtime (such as the CAD/AVL system) or any applications that use the GTFS-realtime feed. The language here is representative and may not cover all conditions and requirements needed for a procurement.
3.1.1. Functional Requirements
- The system shall produce a GTFS-realtime feed consisting of the TripUpdate, VehiclePosition, and Alert messages types. All mandatory fields shall be included.
- The GTFS-realtime feed shall be encoded in the Protocol Buffer format.
- The GTFS-realtime feed shall reference the static GTFS feed for the service period in which the GTFS-realtime feed is generated.
- The GTFS-realtime feed shall include the location of each transit vehicle based on AVL data.
- The GTFS-realtime feed shall include the next stop of each transit vehicle based on aggregated CAD and AVL data.
- The GTFS-realtime feed shall include Estimated Time of Arrival departure and arrival predictions based on aggregated CAD and AVL data for all trips that are currently operational, departing their origin within 5 minutes, or arrived at their destination within 5 minutes.
- The GTFS-realtime feed shall incorporate incident and event data from the agency's incident management system for active or planned events.
- The GTFS-realtime feed shall be extended to include real time parking information based on data received from the agency's parking management system. This shall include an identifier for the parking lot, the number of spaces available, and a text status message.
- GTFS-realtime feed shall be verified to conform to the GTFS-realtime specification prior to being provided to downstream users.
- The GTFS-realtime feed shall be verified to comply with the custom extensions made to the GTFS-realtime specification for parking information.
- GTFS-realtime shall be automatically verified for accuracy against data in the CAD/AVL system prior to being provided to downstream users.
- The GTFS-realtime feed shall be published in a fixed location on the agency's website which is accessible by a published URL.
- The GTFS-realtime feed shall be provided to downstream users who submit an HTTP GET request.
- The GTFS-realtime feed shall require users accessing the data to submit a key provided by the agency as part of the HTTP Get Request.
3.1.2. Performance Requirements
- The GTFS-realtime feed shall be published and made accessible to downstream users every 30 seconds.
- The GTFS-realtime feed shall not incorporate any data based on CAD/AVL data that is more than 120 seconds old.
3.2. Selected Graphics from the Module
Slide 13: National ITS Architecture- Transit Vehicle Tracking
This graphic shows National ITS Architecture service package "APTS01- Transit Vehicle Tracking." The service package shows a generic representation of the flow of data related to transit vehicle tracking. The orange arrow highlights the flow where the GTFS-realtime specification might be selected. In this service package, this is the flow of transit schedule adherence information from a transit management center to an information service provider.
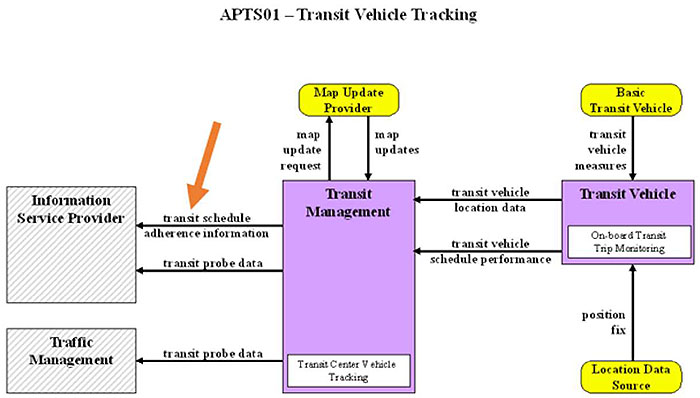
(Extended Text Description: This slide contains a graphic. At the top center of the graphic is a title APTS01 – Transit Vehicle Tracking. The center of the graphic contains a purple box with a title at the upper center reading Transit Management. At the bottom of the box is a white box with text reading Transit Center Vehicle Tracking. To the left of this box are two boxes stacked on top of each other with a space between. The top box has a title reading Information Service Provider. Two arrows flow from the Transit Management box, the top arrow reads transit schedule adherence information and the bottom arrow reads transit probe data. A large orange arrow points to the first of these arrows flowing between boxes. The second box to the left of the Transit Management box reads Traffic Management. A single arrow flows into this box from the Transit Management box reading transit probe data. Above the Transit Management Box is a yellow box entitled Map Update Provider. An arrow flows into this box from the Transit Management box reading map update request and an arrow follows from this box to the Transit Management box reading map updates. To the right of the Transit Management box is a purple box entitled Transit Vehicle. This box contains a white box within it with text reading On-board Transit Trip Monitoring. Two arrows flow from the Transit Vehicle box into the Transit Management box. The top arrow reads transit vehicle location data and the bottom arrow reads transit vehicle schedule performance. There is a yellow box above the Transit Vehicle box entitled Basic Transit Vehicle with an arrow leading down into the Transit Vehicle box reading transit vehicle measures. There is a yellow box below the Transit Vehicle box reading Location Data Source with an arrow leading into the Transit Vehicle box reading position fix.)
Source: USDOT/National ITS Architecture
Slide 14: National ITS Architecture- ITS Data Warehouse
This graphic shows National ITS Architecture service package "AD2- ITS Data Warehouse." This service package shows a generic representation of the data flows related to archiving a wide variety of ITS data. The key flow of interest where GTFS-realtime may play a role is highlighted by the orange arrow, which shows transit archive data flowing from a transit management center to a data archiving system.
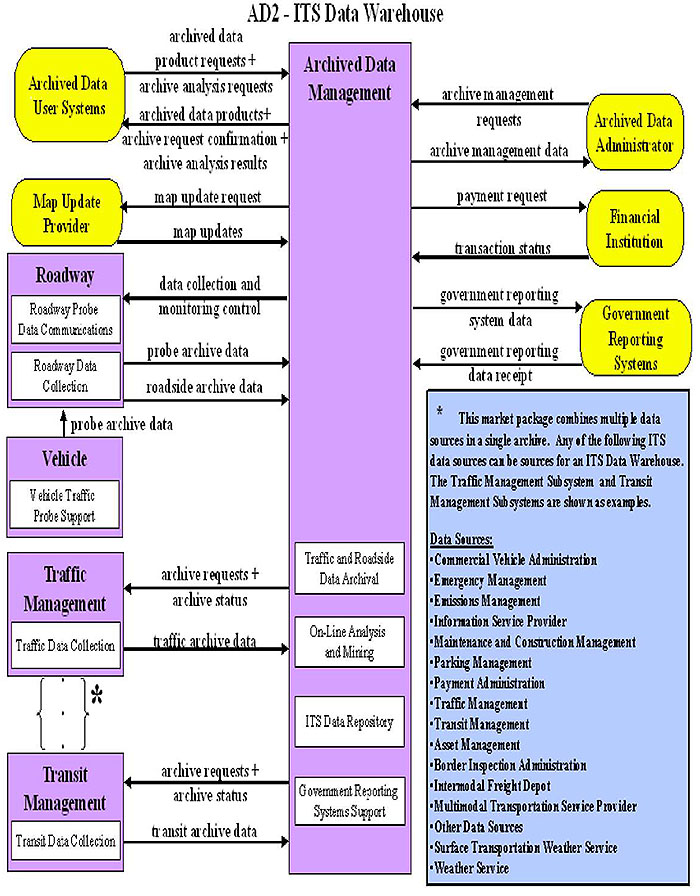
(Extended Text Description: This slide contains a graphic. At the top center is a title AD2- ITS Data Warehouse. At the center is a vertically oriented purple rectangular box with the title Archived Data Management. Towards the bottom of the box are four whit rectangular boxes with text reading Traffic and Roadside Data Archival, On-Line Analysis and Mining, ITS Data Repository, and Government Reporting Systems Support. To the left of the center box, the following boxes appear from top to bottom. A yellow box entitled Archived Data User Systems. A yellow box entitled Map Update Provider. A purple box entitled Roadway. This box contains two white rectangular boxes entitled Roadway Probe Data Communications and Roadway Data Collection. A purple box entitled Vehicle. This box contains a white rectangular box entitled Vehicle Traffic Probe Support. A purple box entitled Traffic Management. This box contains a white rectangular box entitled Traffic Data Collection. A purple box entitled Transit Management. This box contains a white box entitled Transit Data Collection. Between the Traffic Management and Transit Management boxes are two brackets with 3 vertically oriented dots. An asterisk appears to the right of the brackets. To the right of the center box, three yellow boxes appear, entitled from top to bottom: Archived Data Administrator, Financial Institution, and Government Reporting Systems. Flows are black lines with an arrowhead on the end adjacent to the recipient end of the flow. The following flows exist in this diagram between boxes:
-
Archived Data User Systems to Archived Data Management: archived data product requests + archive analysis requests
-
Archived Data Management to Archived Data User Systems: archived data products + archive request confirmation + archive analysis results
-
Archived Data Management to Map Update Provider: map update request
-
Map Update Provider to Archived Data Management: map updates
-
Archived Data Management to Roadway: data collection and monitoring control
-
Roadway to Archived Data Management: probe archive data
-
Roadway to Archived Data Management: roadside archive data
-
Vehicle to Roadway: probe archive data
-
Archived Data Management to Traffic Management: archive requests + archive status
-
Traffic Management to Archived Data Management: traffic archive data
-
Archived Data Management to Transit Management: archive request + archive status
-
Transit Management to Archived Data Management: transit archive data. (A large orange arrow points to this flow.)
-
Archived Data Administrator to Archived Data Management: archive management requests
-
Archived Data Management to Archived Data Administrator: archive management data
-
Archived Data Management to Financial Institution: payment request
-
Financial Institution to Archived Data Management: transaction status
-
Archived Data Management to Government Reporting Systems: government reporting system data
-
Government Reporting Systems to Archived Data Management: government reporting data receipt.
At the bottom right of the graphic is a blue box with the following text: This market package combines multiple data sources to a single archive. Any of the following ITS data sources can be sources for an ITS Data Warehouse. The Traffic Management Subsystem and Transit Management Subsystems are shown as examples. The next line had the words Data Sources underlined, followed by the following list, with each item appearing on a separate line: Commercial Vehicle Administration, Emergency Management, Emissions Management, Information Service Provider, Maintenance and Construction Management, Parking Management, Payment Administration, Traffic Management, Transit Management Asset Management, Border Inspection Administration, Intermodal Freight Depot, Multimodal Transportation Service Provider, Other Data Sources, Surface Transportation Weather Service, and Weather Service.)
Source: USDOT/ National ITS Architecture
Slide 16: Real Time Information on Google Maps
This slide shows an application using the GTFS-realtime specification. On the left we see a list of transit trips, showing the arrival times to a specific stop. The first trip's time is green, because the GTFS-realtime feed for this agency is saying that it is on time. At the top of the left are also service alerts affecting the stop. On the right we see a map showing the stop.
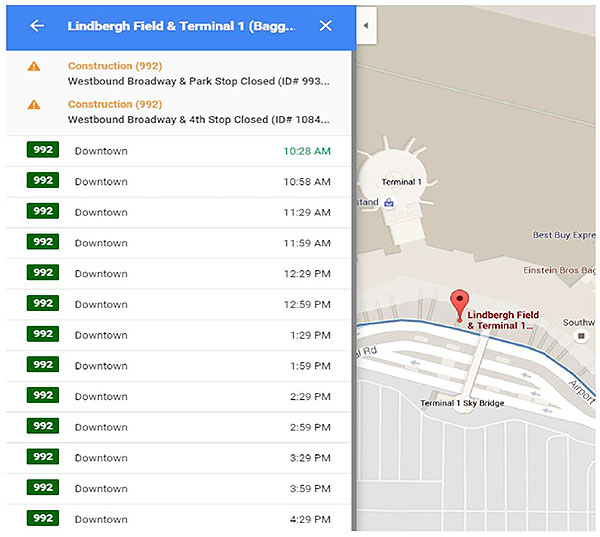
(Extended Text Description: This slide contains a graphic. There are two panels of the graphic. The top consist of a blue bar with white text that reads Lindbergh Field & Terminal 1 (Bagg… There is a left facing arrow to the left of the text and an x to the right. Below that is a section with a white background. The first line has a caution icon which consists of an orange triangle with a white exclamation point. To the right of the icon is orange text that reads Construction (992). The next line contains black test that reads Westbound Broadway & park Stop Closed (ID# 993… The next line has a caution icon which consists of an orange triangle with a white exclamation point. To the right is orange text that reads Construction (992). The next line has black text that reads Westbound Broadway & 4th Stop Closed (ID# 1084… The next thirteen lines follow a consistent pattern. Each line starts with a green box with white text reading 992. To the right is black text reading Downtown. To the right is a time, which is green for the first line and black for all remaining lines. The times read as follows from top to bottom 10:28 AM, 10:58 AM, 11:29 AM, 11:59 AM, 12:29 PM, 12:59 PM, 1:29 PM, 1:59 PM, 2:29 PM, 2:59 PM, 3:29 PM, 3:59 PM, 4:29 PM. The right panel consists of a map of an airport terminal and surrounding roadways. The roadway immediately adjacent to the terminal has a blue line. At one point adjacent to this roadway is a red place marker with text reading Lindbergh Field & Terminal 1… At the top on the left of this panel is a small white box with a left facing arrowhead.)
Source: Google Maps
Slide 40: TripUpdate Message
This graphic shows an example of the TripUpdate GTFS-realtime message.
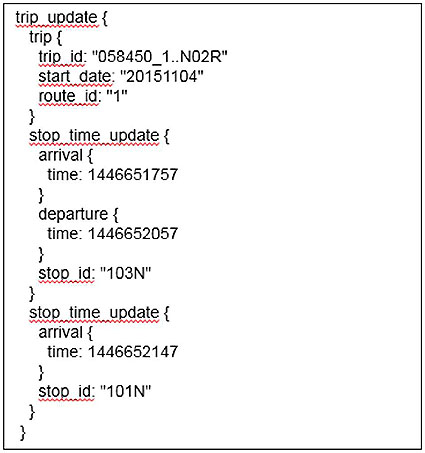
(Extended Text Description: This graphic is a screenshot of the following text:
trip_update {
trip {
trip_id: 058450_1..N02R
start_date: 20151104
route_id: 1
}
stop_time_update {
arrival {
time: 1446651757
}
departure {
time: 1446652057
}
stop_id: 103N
}
stop_time_update {
arrival {
time: 1446652147
}
stop_id: 101N
}
}
Source: New York City Transit
Slide 48: VehiclePosition Message
This graphic shows an example of the VehiclePosition Message
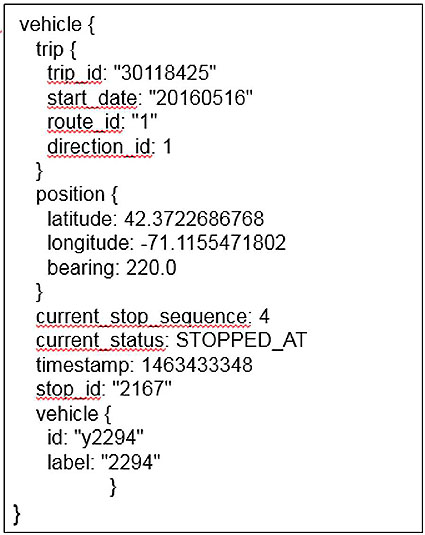
(Extended Text Description: This graphic is a screenshot of the following text:
vehicle {
trip {
trip_id: 30118425
start_date: 20160516
route_id: 1
direction_id: 1
}
position {
latitude: 42.3722686768
longitude: -71.1155471802
bearing: 220.0
}
current_stop_sequence: 4
current_status: STOPPED_AT
timestamp: 1463433348
stop_id: 2167
vehicle {
id: y2294
label: 2294
}
}
Source: MBTA
Slide 53: Alert Message
This graphic shows an example of the Alert message.
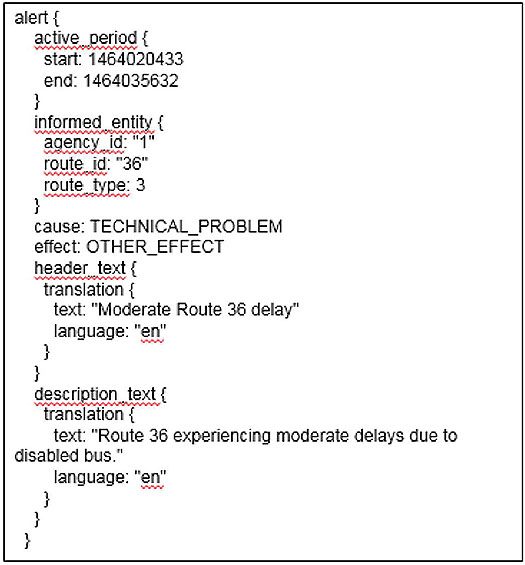
(Extended Text Description: This graphic is a screenshot of the following text:
alert {
active_period {
start: 1464020433
end: 1464035632
}
informed_entity {
agency_id: 1
route_id: 36
route_type: 3
}
cause: TECHNICAL_PROBLEM
effect: OTHER_EFFECT
header_text {
translation {
text: Moderate Route 36 delay
language: en
}
}
description_text {
translation {
text: Route 36 experiencing moderate delays due to disabled bus.
language: en
}
}
}
Source: MBTA
Slide 59: Open Source Software
This graphic is a screenshot of the software code for open source software which tests GTFS-realtime feeds for conformance to the GTFS-realtime specification. This software utilizes open source software tools provided by Google.
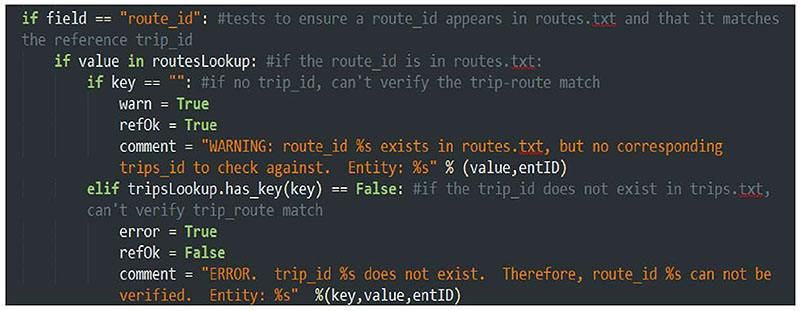
Source: ConSysTec
Slide 66: Referencing Static GTFS in GTFS-realtime
This graphic shows one link between GTFS-realtime feeds and a static GTFS feed. An example is shown of two stop_id values in GTFS-realtime which reference stop entries in the stops.txt file of the static GTFS feed.
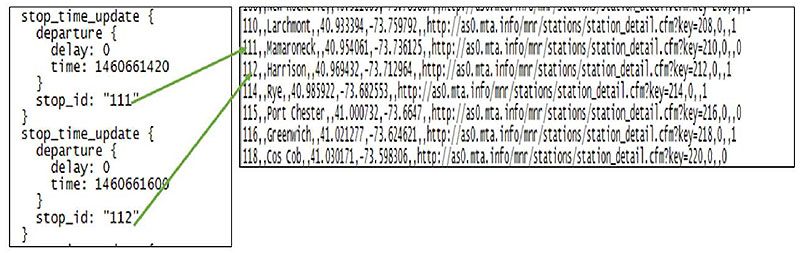
(Extended Text Description: This slide contains a graphic. At the left of the graphic is a screenshot from a GTFS-realtime feed, which reads as follows:
stop_time_update {
departure{
delay: 0
time: 1460661420
}
stop_id: "111"
}
stop_time_update{
departure{
delay: 0
time: 1460661600
}
stop_id: "112"
}
To the right is a screenshot from a GTFS feed, reading:
110,,Larchmont,,40.933394,-73.759792,,http://as0.mta.info/mnr/stations/station_detail.cfm?key=208,0,,1
111,,Mamaroneck,,40.954061,-73.736125,,http://as0.mta.info/mnr/stations/station_detail.cfm?key=210,0,,0
112,,Harrison,,40.969432,-73.712964,,http://as0.mta.info/mnr/stations/station_detail.cfm?key=212,0,,1
114,,Rye,,40.985922,-73.682553,,http://as0.mta.info/mnr/stations/station_detail.cfm?key=214,0,,1
115,,Port Chester,,41.000732,-73.6647,,http://as0.mta.info/mnr/stations/station_detail.cfm?key=216,0,,0
116,,Greenwich,,41.021277,-73.624621,,http://as0.mta.info/mnr/stations/station_detail.cfm?key=218,0,,1
118,,Cos Cob,,41.030171,-73.598306,,http://as0.mta.info/mnr/stations/station_detail.cfm?key=220,0,,0
There are two green arrows linking the two diagrams. One travels from stop_id: 111 in the left diagram to the 111 in the right diagram. One travels from stop_id: 112 in the left diagram to the 112 in the right diagram.)
Source: Metro North Railroad
Slide 67: GTFS-realtime Warnings
This graphic shows validation results from a custom tool that tests GTFS-realtime feeds for conformance to the GTFS-realtime specification.
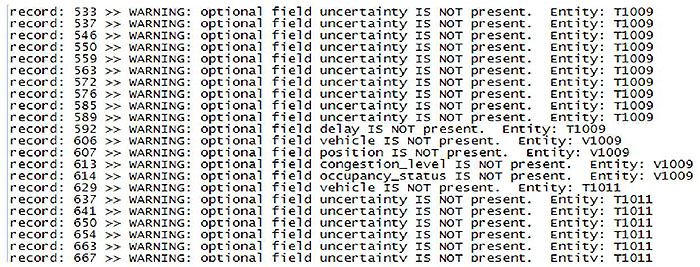
(Extended Text Description: This slide contains a graphic, which is a screenshot of a text file. The file reads as follows:
record: 533 >> WARNING: optional field uncertainty IS NOT present. Entity: T1009
record: 537 >> WARNING: optional field uncertainty IS NOT present. Entity: T1009
record: 546 >> WARNING: optional field uncertainty IS NOT present. Entity: T1009
record: 550 >> WARNING: optional field uncertainty IS NOT present. Entity: T1009
record: 559 >> WARNING: optional field uncertainty IS NOT present. Entity: T1009
record: 563 >> WARNING: optional field uncertainty IS NOT present. Entity: T1009
record: 572 >> WARNING: optional field uncertainty IS NOT present. Entity: T1009
record: 576 >> WARNING: optional field uncertainty IS NOT present. Entity: T1009
record: 585 >> WARNING: optional field uncertainty IS NOT present. Entity: T1009
record: 589>> WARNING: optional field uncertainty IS NOT present. Entity: T1009
record: 592>> WARNING: optional field delay IS NOT present. Entity: T1009
record: 606>> WARNING: optional field vehicle IS NOT present. Entity: V1009
record: 607>> WARNING: optional field position IS NOT present. Entity: V1009
record: 613>> WARNING: optional field congestion_level IS NOT present. Entity: V1009
record: 614>> WARNING: optional field occupany_status IS NOT present. Entity: V1009
record: 629>> WARNING: optional field vehicle IS NOT present. Entity: T1011
record: 637 >> WARNING: optional field uncertainty IS NOT present. Entity: T1011
record: 641 >> WARNING: optional field uncertainty IS NOT present. Entity: T1011
record: 650 >> WARNING: optional field uncertainty IS NOT present. Entity: T1011
record: 654 >> WARNING: optional field uncertainty IS NOT present. Entity: T1011
record: 663 >> WARNING: optional field uncertainty IS NOT present. Entity: T1011
record: 667 >> WARNING: optional field uncertainty IS NOT present. Entity: T1011
Source: ConSysTec
Slide 75: TRANSCOM Software Architecture
This graphic shows a portion of the software architecture for TRANSCOM's GTFS-realtime feed. Real-time data is aggregated from multiple transit agencies in the Data Fusion Engine (DFE) and sent to the Data Exchange (DE) where it is released as a GTFS-realtime feed to downstream system that use it.
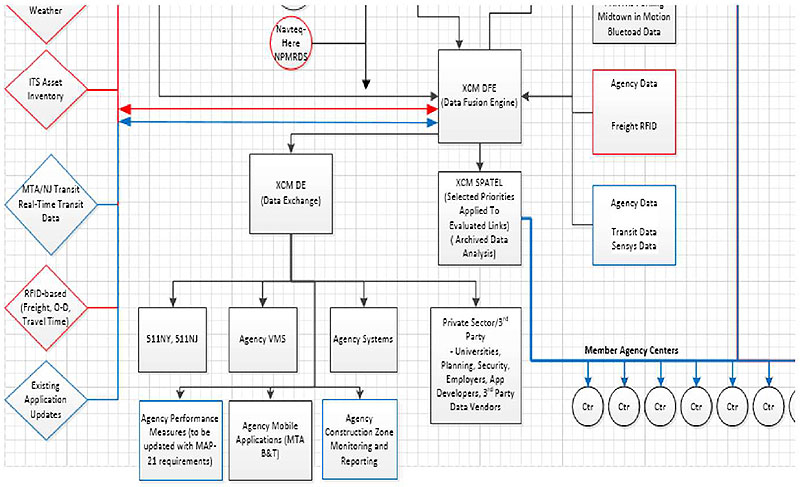
(Extended Text Description: This slide contains a graphic. This a screenshot showing a subset of a diagram. On the left of the diagram are vertically arranged diamond shapes with text in them and a short line moving horizontally to the right from the apex of the diamond. Moving from top to bottom: Only the bottom of the first shape is visible, which is outlined in red, and has the text Weather visible. The next is outlined in red and has the text ITS Asset Inventory. The next is outlined in blue and contains the text MTA/NJ Transit Real-Time Transit Data. The next is outlined in red and contains the text RFID-based (Freight, O-D, Travel Time). The next is outlined in blue and contains the text Existing Application Updates. A vertical line connects all of these shapes. Two parallel horizontal lines, one red and one blue, with arrows on each end, move to the right to a black box entitled XCM DFE (Data Fusion Engine). Data is flowing in via lines from a series of boxes. Visible boxes, which are located to the right, read Midtown in Motion, Bluetoad Data, Agency Data, Freight RFID (outlined in red), and Agency Data, Transit Data, Sensys Data (outlined in blue). Data flows out of the XCM DFE box to a box entitled XCM DE (Data Exchange). Data flows from this box to 7 boxes, 511NY, 511NJ, Agency VMS, Agency Systems, Private Sector/3rd Party- Universities, Planning, Security, Employers, App Developers, 3rd Party Data Vendors, Agency Performance Measures (to be updated with MAP-21 requirements) (outlined in blue), Agency Mobile Applications (MTA B&T), Agency Construction Zone Monitoring and Reporting (outlined in blue). Data also flows out of the XCM DFE box to a box entitled XCM SPATEL (Selected Priorities Applied to Evaluated Links) (Archived Data Analysis). Data then flows from this box via a blue line to a series of circles with the text Ctr in them. Six full circles and part of one more are visible. A label next to the line says Member Agency Centers. A second vertical line leads to this line with no clear path. Also visible at the top of the diagram is a red circle with text reading Navteq HERE NPMRDS. And lines connecting to it following no clear path.)
Source: TRANSCOM, Developed by ConSysTec
4. Case Studies
4.1. Additional Case Study: MBTA-realtime Performance API
The Massachusetts Bay Transportation Authority (MBTA) based in the Boston, MA region uses GTFS-realtime as an input to its MBTA-performance system. GTFS-realtime data contains detailed information about the movement of all transit vehicles. For each trip, the arrival and departure times at each stop are recorded. The MBTA-performance tool uses this data to calculate a variety of performance metrics, including travel time, dwell time, headway, and passenger wait time.
Once data is aggregated into performance metrics, it is made available via an Application Programming Interface (API) to consumers who might need the data. Data is available for current operations (within the past hour) or historical periods that may be determined by the user.
There are many uses for performance data. Dispatchers can monitor performance data and make more informed adjustments to service to account for current conditions than if this data was not present. Service planners can also use this data as an input to the scheduling process.
The real time API documentation is available at:
http://realtime.mbta.com/Portal/Content/Documents/MBTA-realtime Performance APIDocumentation v0 9 1 2016-04-14 public.pdf- content is no longer available.
MBTA also has a dashboard that the public can use to see the metrics provided by the API. This can be found at https://www.mbtabackontrack.com/performance/.
5. Glossary
| Term | Definition |
|---|---|
| Agency Specification | A document that has been prepared by an agency to define requirements for a subject item or process when procured by the agency. |
| Alert | Message describing an event or incident. |
| Automatic Vehicle Location (AVL) | System for tracking real time location of transit vehicles. |
| Binary String | A method of encoding data that consists of a series of 0's and 1's. This must decoded to be interpreted. |
| Comma Separated Value (CSV) | Format for encoding data that uses text files and commas to separate fields. |
| Compliance | A condition that exists when an item meets all of the requirements of an agency specification. |
| Computer Aided Dispatch (CAD) | System for automatically dispatching transit vehicles. |
| Concept of Operations | A document that describes the purpose for a system project, including a description of the current and proposed system, as well as key user needs that the new system is required to address. |
| Conformance | A condition that exists when an item meets all of the mandatory requirements as defined by a standard. It can be measured on the standard as a whole, which means that it meets all mandatory (and applicable conditional) requirements of the standard or on a feature level (i.e., it conforms to feature X as defined in section X.X.X), which means that it meets all mandatory (and applicable conditional) requirements of the feature. |
| Estimated Time of Arrival (ETA) | A prediction of the time that a transit vehicle will arrive at a specific point. |
| Extensible Markup Language (XML) | Format for encoding data. |
| General Transit Feed Specification (GTFS) | Specification used to describe fixed/static transit data such as schedules and the geographic transit network. |
| GTFS-realtime | Extension of the GTFS specification used to disseminate real-time transit information. Includes trip updates, vehicle positions, and transit alerts. |
| File Transfer Protocol (FTP) | Application layer protocol for sending data over the internet. |
| Header | Part of a GTFS-realtime message which identifies the feed and provides metadata, or details that describe the message. The header does not contain any data related to the main content of the feed. |
| Entity | The part of the GTFS-realtime feed that provides the primary information being describe. Each update (trip update, vehicle position, alert) is a separate entity. |
| Hypertext Transfer Protocol (HTTP) | Application layer protocol for sending/receiving information over the internet. |
| Incident Management System (IMS) | Software system that logs transportation incidents/events and facilitates sharing of incident information/events among agencies. |
| Incrementality | Describes whether a feed update should overwrite all previous data from the same feed. |
| Intelligent Transportation System (ITS) Architecture | A representation of the intelligent transportation systems for a region showing the systems and the flows between them. |
| JavaScript Object Notation (JSON) | Format for encoding data. |
| Open Source Software | Software where the code used to write the software is freely available and may be freely reused by other software applications in accordance with the license provided by the software. |
| Protocol Buffers | Format for storing data that uses serialized binary strings (a series of 0's and 1's). |
6. References
GTFS-realtime Specification: https://developers.google.com/transit/gtfs-realtime/
GTFS Specification: https://developers.google.com/transit/gtfs/
Protocol Buffer Specification: https://developers.google.com/protocol-buffers/
Language Codes for language field: https://www.loc.gov/standards/iso639-2/php/code list.php
7. Study Questions
The quiz/poll questions and answer choices as presented in the PowerPoint slide to allow students to either follow along with the recording or refer to the quiz at a later date in the supplement.
1. Which of the following groups may participate in developing the GTFS-realtime specification?
- Transit Agency Staff
- Planning Tool Users
- Smartphone Application Developers
- All of the Above
2. Which of the following formats is GTFS-realtime encoded in?
- Extensible Markup Language (XML)
- JavaScript Object Notation (JSON)
- Protocol Buffers
- Comma Separated Values (CSV)
3. Which of the following is NOT a way to show location in GTFS-realtime?
- Latitude/Longitude
- Stop sequence on a trip
- Stop identifier
- Distance to destination
4. Which of the following methods is most commonly used to access GTFS-realtime feeds?
- FTP
- HTTP
- Telephone
8. Icon Guide
The following icons are used throughout the module to visually indicate the corresponding learning concept listed out below, and/or to highlight a specific point in the training material.
1) Background information: General knowledge that is available elsewhere and is outside the module being presented. This will be used primarily in the beginning of slide set when reviewing information readers are expected to already know.
Example: Information on the standard.
2) Tools/Applications: An industry-specific item a person would use to accomplish a specific task, and applying that tool to fit your need.
Example: Systems engineering, specifications, test documentation, etc. A systems engineering approach to developing an ATC procurement specification.
3) Remember: Used when referencing something already discussed in the module that is necessary to recount.
Example: "Recall our discussion on [insert topic] back in Learning Objective 1..."
4) Refer to Student Supplement: Items or information that are further explained/detailed in the Student Supplement.
Example: Additional information on a standard, additional case studies or examples that don't fit into the PowerPoint itself, external resources, etc.
5) Example: Can be real-world (case study), hypothetical, a sample of a table, etc.
6) Checklist: Use to indicate a process that is being laid out sequentially. Example: Process to write test plans to verify standard requirements.