ITS Transit Standards Professional Capacity Building Program
Module 16: An Introduction to Transit Enterprise Architecture and its Benefits
HTML of the PowerPoint Presentation
(Note: This document has been converted from a PowerPoint presentation to 508-compliant HTML. The formatting has been adjusted for 508 compliance, but all the original text content is included, plus additional text descriptions for the images, photos and/or diagrams have been provided below.)
Slide 1:
(Extended Text Description: Welcome - Graphic image of introductory slide. A large dark blue rectangle with a wide, light grid pattern at the top half and bands of dark and lighter blue bands below. There is a white square ITS logo box with words "Standards ITS Training - Transit" in green and blue on the middle left side. The word "Welcome" in white is to the right of the logo. Under the logo box is the logo for the U.S. Department of Transportation, Office of the Assistant Secretary for Research and Technology.)
Slide 2:
Module 16
An Introduction to Transit Enterprise Architecture and its Benefits
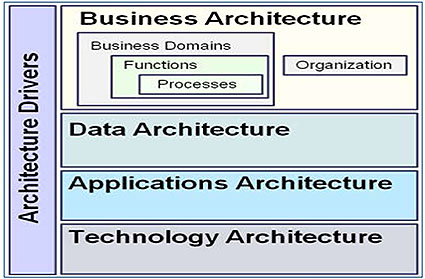
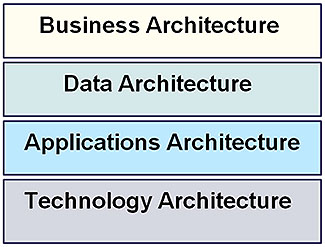
(Extended Text Description: Title slide contains an image of the titles of the four layers of the Enterprise Architecture, Business, Data, Applications and Technology stacked on top of each other, each within a box. There is an additional box vertically up the left side that is labeled Architecture Drivers.)
Slide 3:
Instructor
Nancy Neuerburg
Senior Technical Staff
Consensus Systems Technologies
Slide 4:
Learning Objectives
- Define an Enterprise Architecture (EA)
- Review the benefits to a transit organization of having an Enterprise Architecture
- Describe the general process for creating a transit Enterprise Architecture
- Articulate how use of EA principles can benefit a transit agency
Slide 5:
Learning Objective 1
Define an Enterprise Architecture (EA)
Slide 6:
View from 10,000 feet
What does a Transit Enterprise Architecture (EA) do?
-
Creates efficiencies by providing managers and staff visibility into the overall relationships among their enterprise's
- People and processes
- Data
- Applications
- Technologies
- Performance
- An EA can be designed to answer a wide range of questions that often stress transit managers and staff
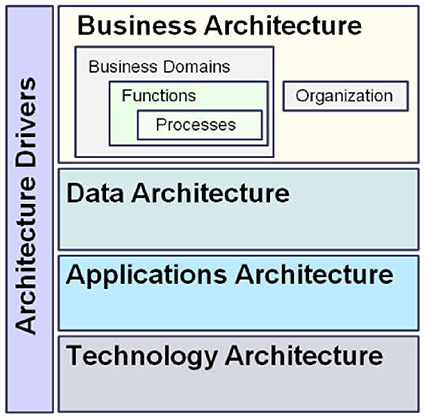
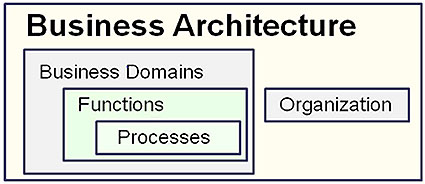
(Extended Text Description: The titles of the four layers of the Enterprise Architecture, Business, Data, Applications and Technology are each in a box, with the boxes stacked on top of each other. An additional box is located vertically up the left side of the stack, which is labeled Architecture Drivers. Inside the Business Architecture box on the left, are three nested boxes, titled Business Domain, Functions and Processes. Inside the Business Architecture box on the right, is a box titled Organization.)
Slide 7:
View from 10,000 feet
What is an enterprise?
-
"Any collection of organizations that has a common set of goals"
- The Open Group
- It is a transit agency for this presentation
What is architecture?
-
"The fundamental organization of a system, embodied in its components, their relationships to each other and the environment, and the principles governing its design and evolution."
- ISO/IEC 42010:2007
How is better visibility into transit achieved?
- By storing information about the enterprise in an architecture repository software tool that has analysis and display capabilities
Slide 8:
EA Layers
Architecture Layers Commonly Seen in Transit EAs
Slide 9:
EA Layers
Business Architecture (BA)
-
The BA is an organized view of the business, usually including:
- A hierarchical and mutually exclusive representation of the business functions and processes
- A representation of the organizational structure
- Connections and work flows
- Roles and responsibilities that control the business
Slide 10:
EA Layers
Partial Business Architecture Summary of Functions View
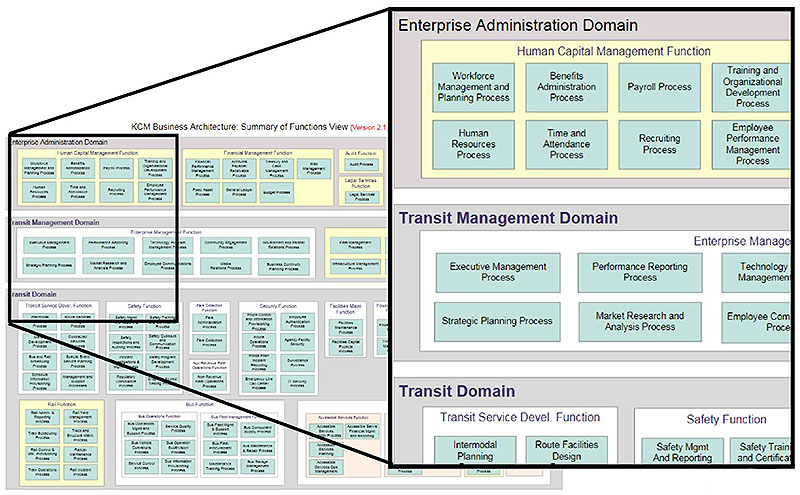
(Extended Text Description: Author's relevant description: This slide shows a number of text boxes that are a partial representation of a Summary View of the Business Architecture (BA) developed at King County Metro. The upper left corner of the image is expanded so part of the text can be read. The expanded view show that the Functions and Processes in the BA were grouped into three Domains, the Enterprise Administration Domain, Transit Management Domain, and Transit Domain.)
Slide 11:
EA Layers
Transit Business Architecture Can Be Extended
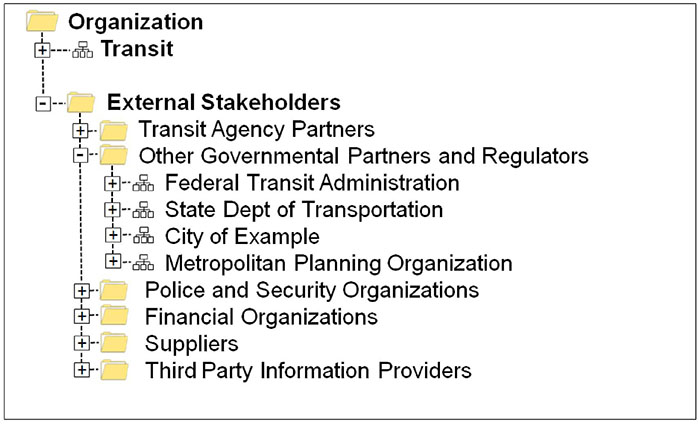
(Extended Text Description: This text slide shows a hierarchical listing of part of an Organization with Transit and External Stakeholders shown under Organization. The External Stakeholders are further expanded below to show examples, such as Transit Agency Partners and other Governmental Partners and Regulators, which is further expanded to show examples such as the Federal Transit Administration, State Dept. of Transportation, City of Example and Metropolitan Planning Organization. External Stakeholders also includes Police and Security Organizations, Financial Organizations, Suppliers and Third Party Information Providers.)
Slide 12:
EA Layers
Extended BA: External Stakeholders
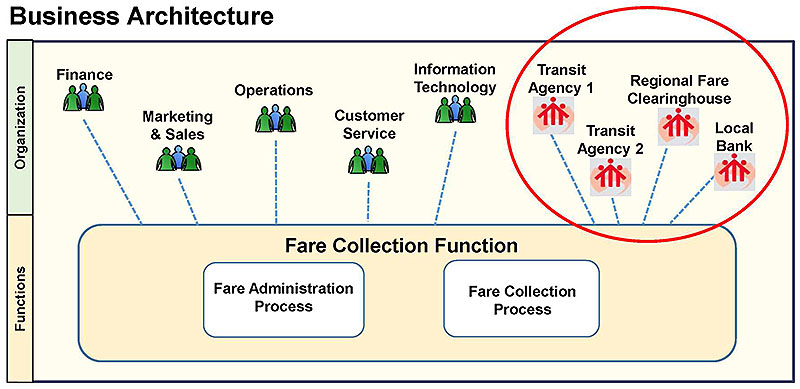
(Extended Text Description: Author's relevant description: This slide shows how elements of an extended Business Architecture might be represented graphically to identify key external stakeholders. At the top of the graphic, some of the key stakeholders involved in the Fare Collection Function are represented, such a Finance, Marketing, Customer Service. The external stakeholders (Transit Agencies 1 and 2, Regional Fare Clearinghouse, Local Bank) are highlighted within a red circle. Each of the stakeholders are linked to a Fare Collection Function box with two nested boxes inside that are titled Fare Administration Process and Fare Collection Process.)
Slide 13:
EA Layers
Data or Information Architecture
-
The Data Architecture (DA) describes the data and data structures used by a business and its applications. It may include:
- The meaning and relationships of information categories
- Answers related to how the data is stored and managed
- Information on data integration within the organization
- Supporting information about interfaces
- Common DA Components
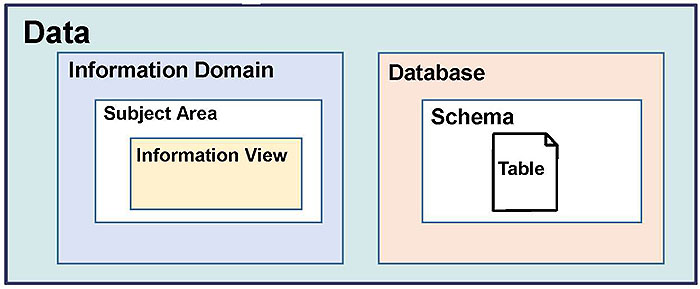
(Extended Text Description: The bottom of the slide has a box titled Data and within it are two nested sets of boxes. On the left, the nested boxes are titled Information Domain, Subject Area and Information View. On the right side of the diagram, the nested boxes are titled Database, Schema and Table.)
Slide 14:
EA Layers
Examples of Components in a Data Architecture
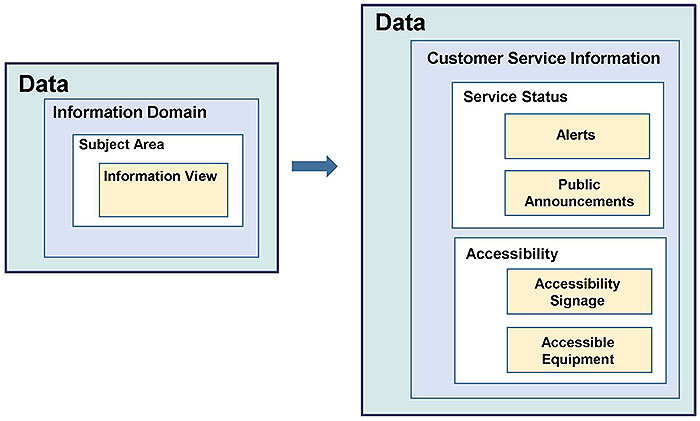
(Extended Text Description: This slide has two sets nested boxes side-by-side, both labeled Data, separated by an arrow. The left set, marked Data, cascades, each in a separate nested box, Information Domain, then Subject Area, then Information View. The arrow points from the left general set of boxes to the right nested set of boxes, which is a specific example. The right set of boxes marked Data, then has a large box inside it labeled Customer Service Information which has two additional sets of cascaded boxes, the first marked Service Status and the other Accessibility. The Service Status box contains two stacked boxes labeled Alerts and Public Announcements. The Accessibility box contains two stacked boxes labeled Accessibility Signage and Accessible Equipment.)
Slide 15:
EA Layers
Applications Architecture (AA)
- The Application Architecture describes the applications and software services needed to support the operation of an enterprise such as transit.
- Common components of the AA
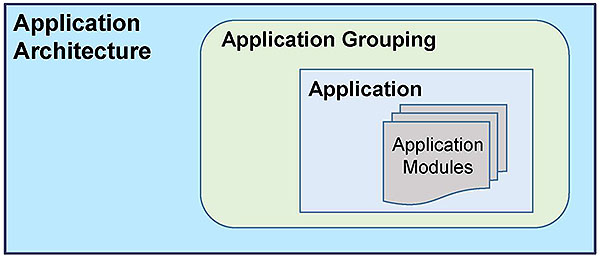
(Extended Text Description: This slide contains another set of nested boxes, with the outer box labeled Application Architecture, which contains Application Grouping, which contains Application, which contains an image with a series of overlapping stacked forms labeled Application Modules implying there may be more than one module.)
Slide 16:
EA Layers
AA Components and Summary Views
-
Application Groupings support analysis and visualization
- Can show redundancies
- Need for standardization
-
Examples of groupings that help transit with common issues
- Customer-facing application
- Reporting tools
- On-board vehicle functionality
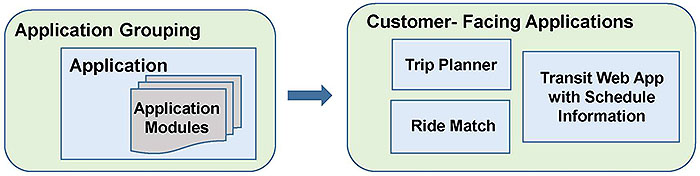
(Extended Text Description: On the bottom of this slide is a graphic that expands on the Application Grouping set of nested boxes from the previous slide #15. The generic Application Grouping box is repeated from slide 16 on the left with an arrow pointing to the right to a specific example. The right-hand example box is labeled Customer - Facing Applications and contains three boxes that are titled Trip Planner, Ride Match, and Transit Web App with Schedule Information.)
Slide 17:
EA Layers
Technology Architecture (TA)
- The transit Technology Architecture captures, at a high level, the technology infrastructure components that are required to support the data and applications of an organization
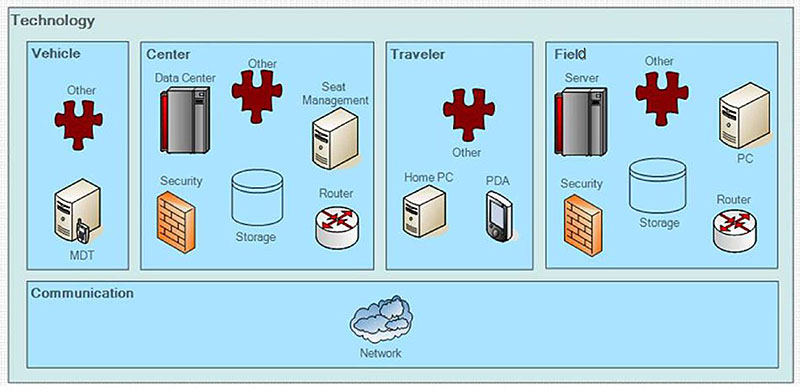
(Extended Text Description: This slide has a large box labeled Technology which contains four boxes, each containing labeled graphical images. The first of the four boxes is labeled Vehicle and contains a puzzle piece shaped graphic labeled Other and a computer shaped graphed labeled MDT for Mobile Date Terminal. The second box is labeled Center and contains six graphical images: a computer graphic labeled Data Center, a puzzle piece shaped graphic labeled Other, a computer shaped graphic labeled Seat Management, a brick wall labeled Security, a drum graphic labeled Storage, and a graphic labeled Router. The third box is labeled Traveler and contains three graphical images, a computer graphic labeled Home PC, a puzzle piece shaped graphic labeled Other, and a hand held device labeled PDA (for Personal Data Assistant). The fourth box is labeled Field and contains the same six graphical images as the one labeled Center: a computer graphic labeled Data Center, a puzzle piece shaped graphic labeled Other, a computer shaped graphed labeled Seat Management, a brick wall labeled Security, a drum graphic labeled Storage, and a graphic labeled Router. The last box is labeled Communication and had a single graphic of clouds labeled Network.)
Slide 18:
EA Layers
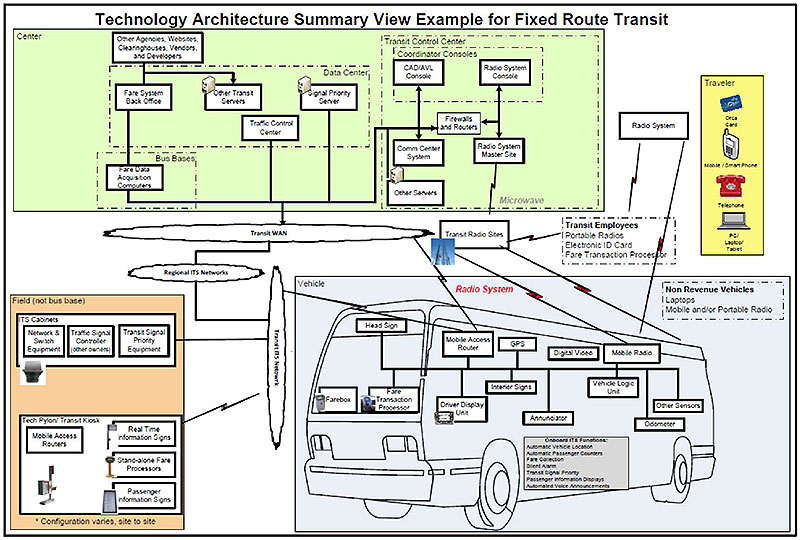
(Extended Text Description: This slide is labeled Technology Architecture Summary View Example for Fixed Route Transit. It has four primary boxes representing, from the National ITS Architecture, Center, Field, Vehicle, and Traveler, which may be connected by Communications. Not all the details can be seen in this graphic, so four additional slides show expanded views of the four primary boxes. The large top left box is labeled Center, and it provides examples of where technology equipment such as servers and CAD/AVL consoles may reside. It shows them in sub-boxes such as Data Center, Bases, and Transit Control Center. The box in the lower left is labeled Field (not bus base) and it has two sets of nested labeled boxes. The top one is labeled ITS Cabinets and lists three examples of technology elements that might be in an ITS cabinet. The bottom box is labeled Tech Pylon/Transit Kiosk and shows an image of a Tech Pylon with a Transit Kiosk. Inside the box are labeled images of a real-time information sign, a stand-alone fare processor and a passenger information sign, plus a box labeled Mobile Access Router. The box at the lower right is labeled Vehicle and it shows or lists examples of technology elements that might be on a bus or a non-revenue vehicle. It has an outline of a bus that contains a network of 13 elements such as an image of a fare box, a fare transaction processor, and a driver display unit. The bus has a sign on the side that lists examples of Onboard ITS Functions such as Automatic Vehicle Location and Automatic Passenger Counters. The Traveler box on the upper right-hand side shows examples of technology devices that a traveler might have. The Traveler box shows images of a fare card, mobile/smart phone, telephone and a PC/laptop. Possible examples of Communications between the Center, Field and Bus are represented by "cloud" bubbles for a Transit WAN, Regional ITS Network and a Transit ITS Network, and by graphical lightning bolts representing wireless communications between elements. For example, a lightning bolt connects an image of radio towers that represents transit radio sites to the Mobile Radio box in the bus outline. Each transit agency might develop a Technology Summary View diagram that represents the elements used at their agency and how they are connected at a high level. The contents of the four primary boxes are discussed further in the next four slides.)
Slide 19:
EA Layers
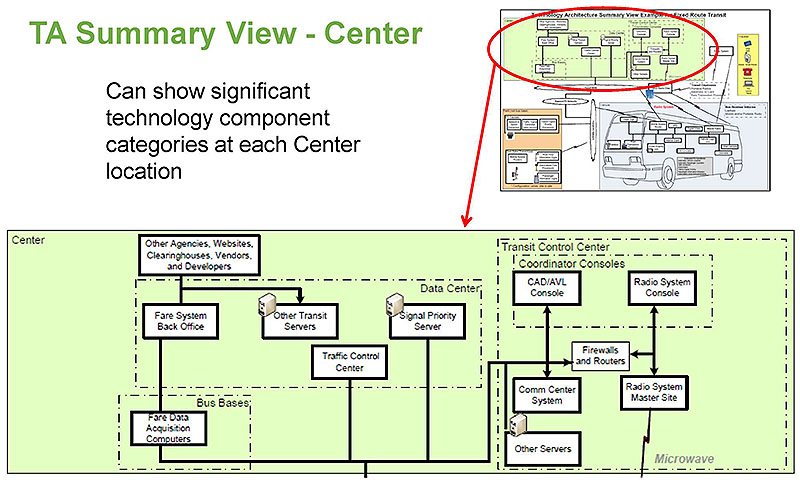
(Extended Text Description: This slide is labeled TA Summary View – Center. On the left, under the title is the text "Can show significant technology component categories at each Center location". In the upper right hand corner is a miniature representation of the entire complex graphic shown in slide #18, with the Center box encircled in a red oval with a red arrow pointing to the bottom of the slide where the Center box is expanded for easier viewing of the details. The Center box provides examples of where technology equipment such as servers and CAD/AVL consoles may reside. It shows them in sub-boxes such as Data Center, Bases, and Transit Control Center, with one box outside those three boxes, in the upper left-hand corner, which is labeled Other Agencies, Websites, Clearinghouses, Vendors, and Developers. In this example, that box connects to the Fare System Back Office box and the Other Transit Servers box, which are located in the Data Center. The box labeled Fare System Back Office is connected to both the box titled Other Transit Servers in the Data Center box and the box titled Fare Data Acquisition Computers, located within the box titled Bus Bases. The other two boxes in the Data Center box are labeled Traffic Control Center and Signal Priority Server, which contains a graphic of a computer. The Fare Data Acquisition Computers, Traffic Control Center, and Signal Priority Server boxes are connected a Firewalls and Router box. The elements and connections in this graphic are hypothetical, with the point of the graphic being that an agency would show the key elements and connection in their transit organization. Additional technology element examples are shown in the dotted box on the right that is labeled Transit Control Center, with a CAD/AVL Console box and a Radio System Console box in a sub-subgroup labeled Coordinator Consoles. The CAD/AVL Console box is connected to a box labeled Comm. Center System. The Radio System Console box is connected to the box titled Radio System Master Site and the Firewalls and Router box. A box labeled Other Servers, which includes a graphic of a computer, is also connected to the Firewalls and Routers box. The Radio System Master Site box in the Transit Control Center is connected with a graphical lightning bolt labeled microwave to a box titled Transit Radio Sites that is outside the Center box.)
Slide 20:
EA Layers
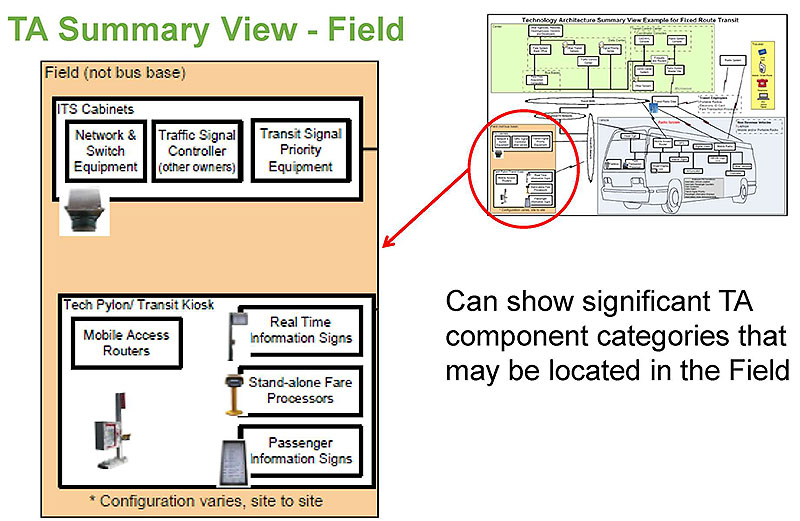
(Extended Text Description: This slide, titled TA Summary View – Field, expands another portion of the complex graphic in slide #18. To the right, the text reads, Can show significant TA component categories that may be located in the Field. In the upper right hand corner is a miniature representation of the entire graphic shown in slide #19, with the Field box circled in a red oval with a red arrow pointing to the left of the slide where the Field box is expanded for easier viewing of the details. The Field box contains two groupings of elements. The top grouping is a box labeled ITS Cabinets that contains three labeled boxes marked Network & Switch Equipment, Traffic Signal Controller (other owners), and Transit Signal Priority Equipment. The ITS Cabinet box includes a graphic of an ITS cabinet. The second grouping of field technology elements are located in a box labeled Tech Pylon/Transit Kiosk with an image of a Tech Pylon with a Transit Kiosk located at the bottom of the box. The box contains four labeled elements: Mobile Access Routers, Real Time Information Signs with a graphic of a sign on a stand, Stand-Alone Fare Processors with a graphic of a user terminal on a stand, and Passenger Information Signs with a graphic of a sign. This grouping labeled Tech Pylon/Transit Kiosk has a note below that reads Configuration varies, site to site.)
Slide 21:
EA Layers
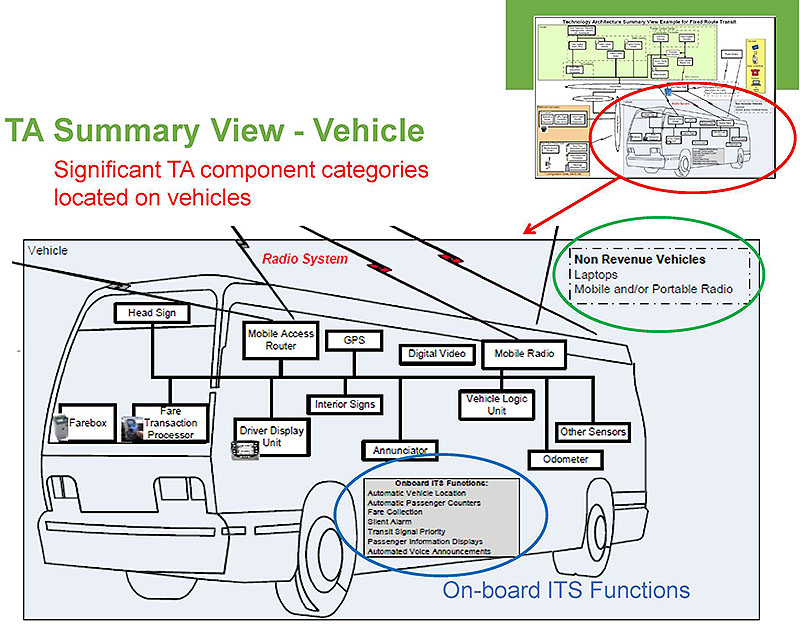
(Extended Text Description: This slide, titled TA Summary View – Vehicle, expands the third portion of the complex graphic from slide #18. In the upper right hand corner of the slide is miniature representation of the entire graphic shown in slide #19, with the Vehicle box in the lower right circled in a red oval with a red arrow that points to the bottom of the slide where the Vehicle box is shown in an expanded view. Text under the title reads, "Significant TA component categories located on vehicles". This primary box below labeled Vehicle contains 13 flow chart elements and 2 lists of text. Entering the primary box labeled Vehicle are 4 flowchart graphical lightning bolts labeled Radio System and Microwave. The 13 technology architecture components shown inside the outline of the bus are the following: Head Sign, Farebox, Fare Transaction Processor, Mobile Access Router, Driver Display Unit, GPS, interior Signs, Annunciator, Digital Video Mobile Radio, Vehicle Logic Unit, Odometer, and Other Sensors. A transit agency might show their technology elements on a bus linked to a mobile network. A sign on the side of the bus is highlighted by surrounding it with a blue circle and adds the title, On-Board ITS Functions, in blue below it. The sign lists the following examples of on-board ITS functions: Automatic Vehicle Location, Automatic Passenger Counters, Fare Collection, Silent Alarm, Transit Signal Priority, Passenger Information Displays, and Automated Voice Announcements. A box in the upper right corner is titled Non Revenue Vehicles, which lists possible technology architecture devices such as Laptops and Mobile and/or Portable Radio that might be on a non-revenue vehicle.)
Slide 22:
EA Layers
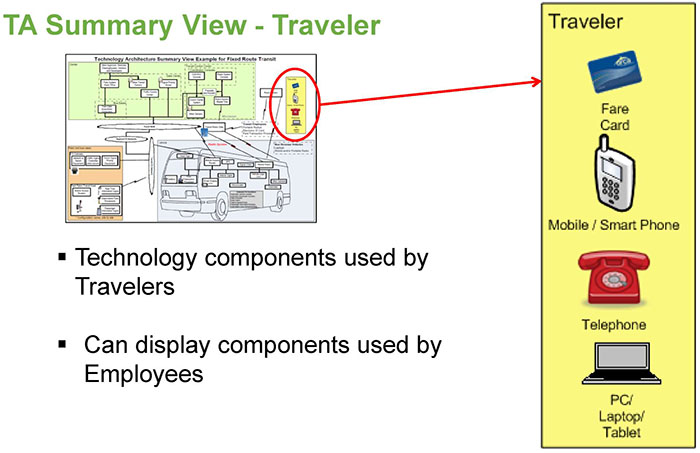
(Extended Text Description: This slide, titled TA Summary View – Traveler, expands the Traveler box in the complex graphic from slide #18. In the upper left corner of the slide is a miniature representation of the entire graphic shown in slide #18, with the Traveler box in the upper right circled in a red oval with a red arrow that points to an expanded Traveler box the right side of the slide. The Traveler box shows examples of technology devices that a traveler might have. The Traveler box shows images of a fare card, mobile/smart phone, telephone, and a PC/laptop. Bullets to the left contain the following items:
- Technology components used by Travelers
- Can display components used by Employees
Slide 23:
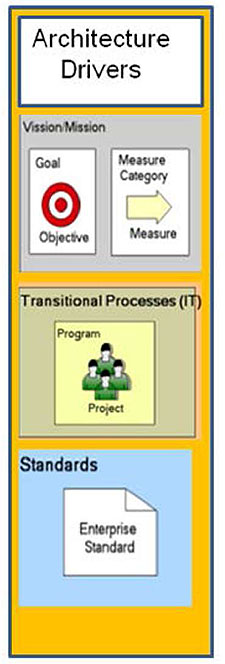
EA Drivers
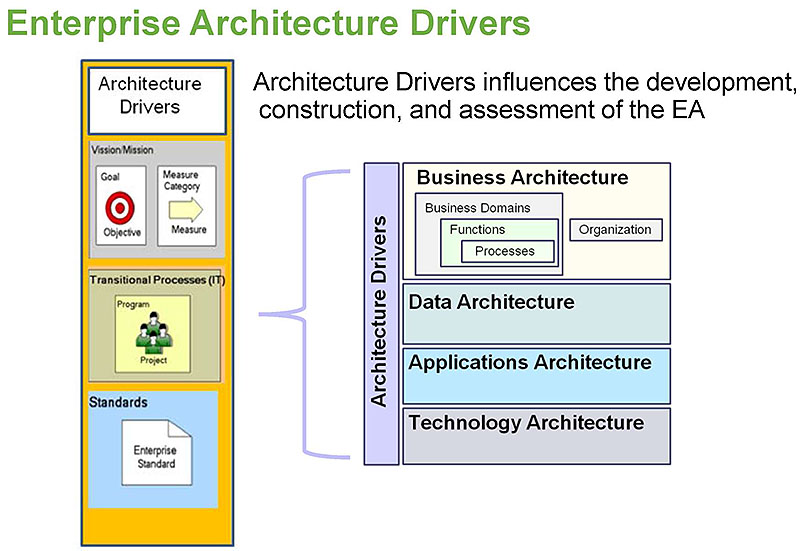
(Extended Text Description: The right side of this slide contains the image originally shown in slide #2, which is an image of the titles of the four layers of the Enterprise Architecture, Business, Data, Applications and Technology stacked on top of each other, each within a box. There is an additional box vertically up the left side that is labeled Architecture Drivers. The Architecture Drivers box is bracketed with a left-side purple bracket that points to a tall box on the left of the slide. The tall box on the left is labeled Architectural Drivers and is an expansion of the Architectural Drivers box. It has three boxes of text and graphics stacked below the title box. The first box below the title is labeled Vision/Mission and it contains two sub-boxes. The sub-box on the right has a graphic of a target with the words Goal above the target and Objective below the target. Next to it is another sub-box containing a large graphical arrow pointed right with the words Measure Category above the arrow and Measure below it. The next lower box in the stack is labeled Transitional Processes (IT) with a graphic of a team of people with the words Program above it and Project below it. The bottom box of the stack is labeled Standards and has a graphic of a sheet of paper with the corner folded over labeled Enterprise Standard. Text at the top of the slide reads, Architecture Drivers influences the development, construction, and assessment of the EA.)
Slide 24:
EA Drivers
Enterprise Architecture
(Extended Text Description: The graphic on the left is a repeat of the tall box graphic shown previously on the left of slide #23 and labeled Architectural Drivers, with the three stacked sub-boxes of text and graphics labeled Vision/Mission, Transitional Processes, and Standards.)
- Linking drivers to components of the EA highlights priorities, biases and weaknesses
-
Vision, Mission, Goals and Objectives
- Can improve alignment with investments
-
Transitional processes (e.g., new projects)
- Can assess the impacts of new projects
-
Standards
- Can be linked to applications and other EA components
Slide 25:
EA Connections
How are EA Connections Valuable?
-
Defined Connections are a key part of the value of an EA
- Define relationships
- Can have Properties
- Parent-child Connections simplify the description of an EA
- Connections between Components in different EA layers inform about relationships
-
A diversity of Connections between Components can be defined:
- Business Functions "are supported by" Applications
- Applications "are hosted on" Servers
- A "sequence flow" can occur between processes
Slide 26:
EA Connections
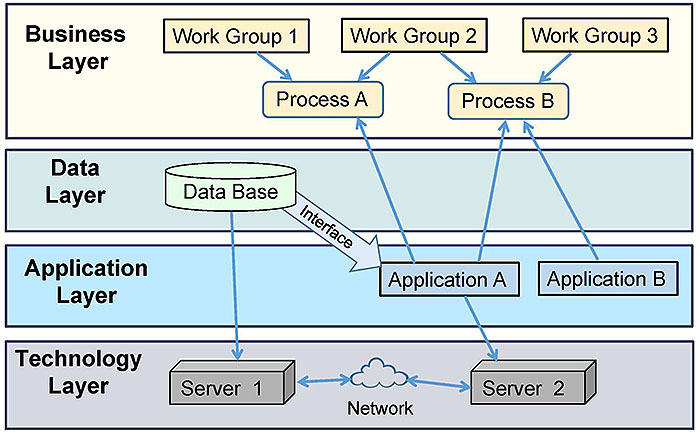
Connections - BA Perspective
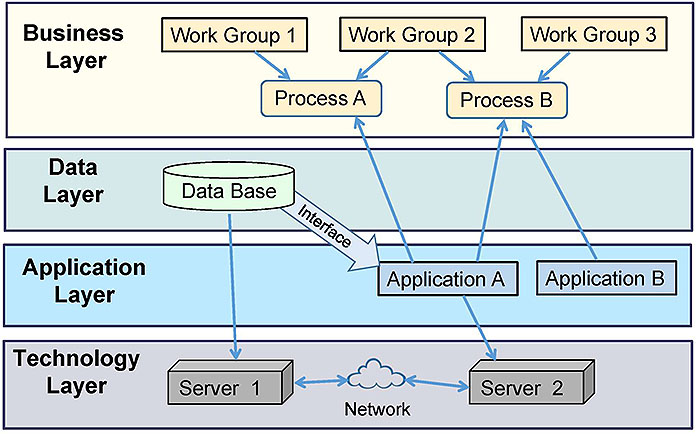
(Extended Text Description: This slide contains four layered boxes, stacked on top of each other. The first box, Business Layer, contains boxes for Work Group 1 and Work Group 2, each connected via an arrow to a box below them labeled Process A, then Work Group 2 along with Work Group 3 each have arrows pointing to a box below them labeled Process B. The next layer and box is labeled Data Layer that contains a flat cylindrical graphic labeled Data Base. The next layer down is labeled Application Layer containing two boxes labeled Application A and Application B, and the bottom layer is labeled Technology Layer containing boxes labeled Server 1 and Server 2, connected by arrows to a cloud graphic between them. The connection between the Data Base graphic and Server 1, where the Data Base is hosted, is represented by an arrow pointing to the Server 1 box. The connection between the Data Base graphic and Application A, which uses the Data Base, is represented by an arrow labeled Interface pointing to Application A. Application A in the Application layer has arrows pointing up to Processes A and B in the Business Layer, which it supports, and an arrow pointing down to Server 2 in the Technology Layer. Application B has an arrow pointing up to Process B that it supports in the Business Layer. Servers 1 and 2 in the Technology Layer are connected to the cloud graphic labeled Network with double ended arrows.)
Slide 27:
EA Connections
Connections - Technology Perspective
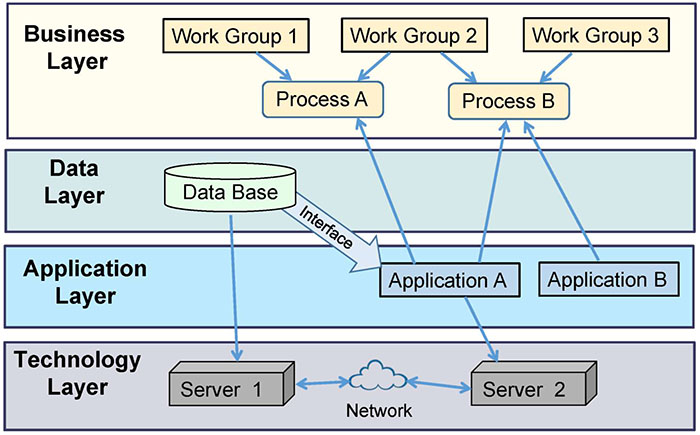
(Extended Text Description: This slide shows the same graphical layers and connection shown in Slide #26, but from the Author's notes, indicates the technology perspective from the bottom up, starting with the Technology Layer with the Servers and the cloud, the Application Layer and Data Layers together, then ends with the Business Layer with the workgroups and processes.)
Slide 28:
EA Connections
Transit Route Facilities Work Group Example
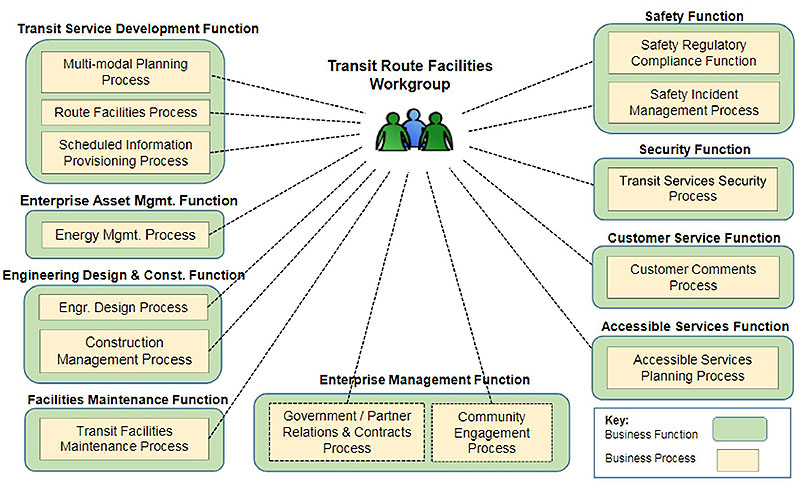
(Extended Text Description: This slide shows how a work group can be connected to the business functions and processes that the group performs or supports in a significant way. There is a graphic in the middle of the slide of three joined torsos of people, which is labeled Transit Route Facilities Workgroup. From the Workgroup graphic, dotted lines radiate out to nine labeled Function boxes around the perimeter of the slide. Starting at the top left and working counterclockwise around the workgroup graphic is a Business Function box labeled Transit Service Development Functions which contains three Process boxes titled Multi-Modal Planning Process, Route Facilities Process, and Schedule Information Provisioning Process. A Business Function box labeled Enterprise Asset Mgmt. Function listing an Energy Mgmt. Process. A Business Function box labeled Engineering Design & Const. Function listing an Engr. Design Process and a Construction Management Process. A Business Function box in the lower left corner labeled Facilities Maintenance Function listing a Transit Facilities Maintenance Process. Across the bottom is a Business Function box labeled Enterprise Management Function listing a Government / Partner Relations & Contracts Process and a Community Engagement Process. Going up the right side of the slide is a Business Function box labeled Accessible Services Function listing an Accessible Services Planning Process; next is a Business Function box labeled Customer Service Function listing a Customer Comments Process; next is a Business Function box labeled Security Function listing Transit Services Security Process; and last in the upper right corner is a Business Function box labeled Safety Function listing a Safety Regulatory Compliance Function and a Safety incident Management Process. A Key in the lower right corner of the slide indicates that Business Function boxes are green and Business Process boxes are yellow.)
Slide 29:
EA Connections
EA: Putting the Pieces Together
-
An EA can present different perspectives
- Different perspectives on the definition of an EA exist
- Revisiting the definition of an EA for transit, a preferred version:
"A strategic information asset base, which defines the business, the information necessary to operate the business, the technologies necessary to support the business operations, and the transitional processes necessary for implementing new technologies in response to the changing business needs. It is a representation or blueprint."
(Definition from the Federal Enterprise Architecture Framework)
Source: Congressional Research Service, Federal Enterprise Architecture and E-Government: Issues for Information Technology Management, April 10, 2008. https://www.fas.org/sgp/crs/secrecy/RL33417.pdf

Slide 30:

Slide 31:
Question
Which of the following is NOT a typical name of a layer in a Transit Enterprise Architecture?
Answer Choices
- Business
- Software
- Technology
- Data
Slide 32:
Review of Answers
 a) Business
Incorrect. Business layer shows functions, processes, and organizational information.
 b) Software
Correct! Software is a part of the Application layer, but is not a typical EA layer name as it can reside in hardware.
c) Technology
Incorrect. Technology layers shows EA components such as servers, networks, and ITS devices.
d) Data
Incorrect. Data layer typically shows databases and key datasets.
Slide 33:
Learning Objective 2
Review the benefits to a transit organization of having an Enterprise Architecture (EA)
Slide 34:
Benefits to Transit
Wide Range of Potential EA Benefits
- Provides better visibility into the agency
- Improves understanding of the enterprise
- Reduces risk by increasing awareness of dependencies
- Increases understanding of the impacts of potential changes on people, systems, and data
- Enables quicker response to change through better information

Slide 35:
Benefits to Transit
Wide Range of Potential EA Benefits (continued)
-
Improves alignment between the goals of the organization and its
- business processes
- technology investments
- Finds duplicate and ineffective business processes and systems
- Identifies gaps
- Enables efficiencies through standards and standardization
Slide 36:
ITS Related
Transit EA Can Support ITS Initiatives
-
An EA can support transit ITS efforts through the stages of a project's life cycle
- Inform whether an existing or potential project may be part of the ITS Architecture
- Identify standards required or used
- Improve the quality and timeliness of Systems Engineering efforts
- Provide context for a project or solution architecture
Slide 37:
ITS Related
Some Transit EA Relationships to ITS Standards and Key Systems Engineering (SE) Steps
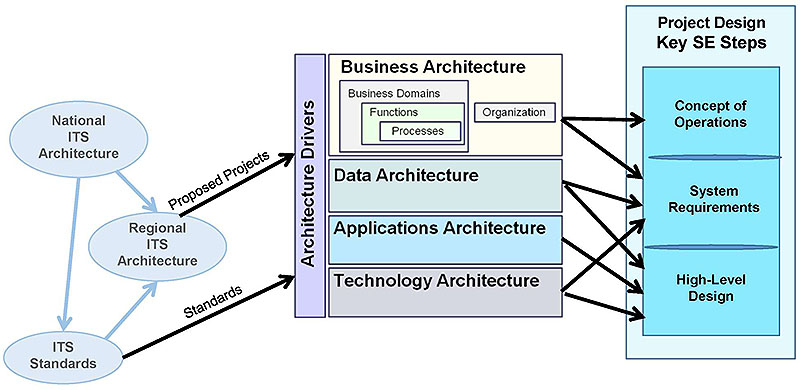
(Extended Text Description: This slide contains a flow of graphics across the page from left to right. The top left bubble is labeled National ITS Architecture with blue arrow pointing down to a bubble labeled ITS Standards. Each of those bubbles has a blue arrow pointing right to a bubble labeled Regional ITS Architecture. The Regional ITS Architecture and ITS Standards bubbles have black arrows, labeled Proposed Projects and Standards, respectively, pointing to a large graphic in the middle which is the core Enterprise Architecture graphic from slide #2. On the right hand side of the slide is a stack of boxes titled Project Design Key SE Steps. The Business Architecture layer of the central graphic has arrows to the Concept of Operations and Systems Requirements boxes in the Project Design graphic on the right. The Data Architecture layer in the central graphic has arrows pointing to the System Requirements and High-Level Design boxes in the Project Design graphic on the right. The Applications Layer of the central graphic has an arrow pointing to the High-Level Design box in the Project Design graphic on the right and the Technology Layer in the central graphic has arrows pointing to the Systems Requirements and High-Level Design boxes in the Project Design graphic on the right.)
Slide 38:
Benefits Evolve
Benefits of an EA Can Evolve
- Transit organizations operate in a state of constant change
- Some changes can drive the EA to a more mature state (better information and analysis capabilities) that provides the organization more benefits
- The EA provides the greatest benefits when the model and data improvements help the agency solve a business problem
Slide 39:

Slide 40:
Question
Which of the following is NOT a common benefit of a transit EA?
Answer Choices
- Better visibility into transit's people, processes and technologies
- Improved standardization
- Solving employee problems
- Understanding dependencies
Slide 41:
Review of Answers
a) Better visibility into transit
Incorrect. EA benefits transit by better showing components of transit such as processes, applications, data and technology.
b) Improved standardization
Incorrect. EA improves standardization by listing standards for use and by detecting inconsistencies.
c) Solving employee problems
Correct! EA is not commonly used to resolve conflicts between individuals.
d) Understanding dependencies
Incorrect. An EA documents and displays dependencies.
Slide 42:
Learning Objective 3
Describe the general process for creating a transit Enterprise Architecture (EA)
Slide 43:
Goals
Key Steps in the EA Development Process
- Educate stakeholders about EA and research needs
- Determine intended use, goals and objectives
- Identify scope and depth of EA
- Identify needed Components and Connections
- Evaluate, then select an EA Framework
- Target an EA development path and identify staff resources
Slide 44:
Goals
Key Steps in the EA Development Process (continued)
- Evaluate and select an EA software modeling tool and support model
- Collect Information
- Populate the EA repository
- Develop a test plan to improve quality
- Develop common analyses and visualizations
- Provide documentation and training
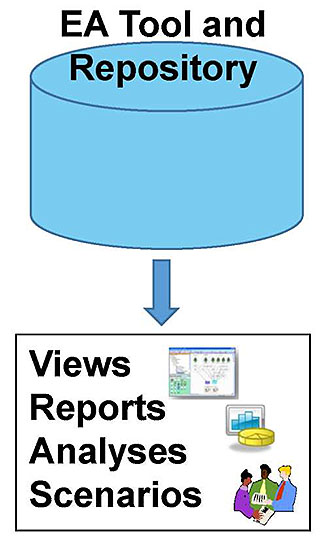
(Extended Text Description: This slide has a graphic on the right side of a cylindrical drum labeled EA Tool and Repository with an arrow pointing down to a box listing four word, Views, Reports, Analyses, and Scenarios. Included in the box are the following three graphics: a graphic of a computer screen, a graphic of bar chart and pie chart, and a graphic of a three people looking at a piece of paper.)
Slide 45:
Goals
Approach for Determining Goals and Objectives
- Research what problems transit is having that can be helped or solved by an EA
-
Conceptualize what reports and analysis that transit needs from the EA
- This will drive what data needs to be collected and what relationships need to be defined
-
Develop preliminary goals and objectives for the EA based on:
- Your research and analysis
- Perceived management and staff interest
Slide 46:
ID Components
Identify Needed Components and Linkages
- Build off the EA goals and objectives
- Select top priority Components and Connections to develop
- Create and implement a data gathering and data definition process to support the needed analyses
- Modify the EA Framework to assist with developing the EA
Slide 47:
ID Components
Assess which Components and Linkages to Add
Slide 48:
Roles
Key Staff and Roles for a Transit EA
-
Key Stakeholders
- Management Sponsor
- "Enterprise Architect"
- Project Manager
-
Staff Groups
- Supervisors and Budget Analysts
- Key IT Staff
- ITS Staff
- Vendor Support
- Contract/Consultant Support

Slide 49:
Scalable
Scalability of EA
- Size of the Enterprise
- Number of Components to define and inventory
- Number of hierarchical levels used to define Components
- Number of Attributes used to describe Components and Connections
- Complexity of the relationships that are being analyzed
- Number of charts and graphics that are customized

Slide 50:
Challenges
Common Challenges for an EA
- Inadequate tools available in agencies for managing EA data storage and analysis
- Cost of some EA Modeling tools
- Learning curve for modeling the EA to be represented in the EA Modeling tool
- Learning curve for using an EA Modeling tool

Slide 51:
Challenges
Common Challenges for an EA (continued)
- Model Complexity
-
Staffing Issues
- Lack of a dedicated Enterprise Architect
- Too few people knowing how to use the EA Modeling tool
- Failing to distribute the task of updating inventories
- Staff turnover and changing management priorities

Slide 52:

Slide 53:
Question
Which of these statements about an EA is NOT correct?
Answer Choices
- Many groups help build an EA
- An EA needs a maintenance plan
- An EA must solve a business need
- Only a fully developed EA is useful
Slide 54:
Review of Answers
a) Many groups help build an EA
Incorrect. Staff from many groups are needed to provide the knowledge stored in the EA repository.
b) An EA needs a maintenance plan
Incorrect. An EA needs ongoing maintenance, just as inventories do. Responsibilities and update approaches must be defined.
c) An EA must solve a business need
Incorrect. An EA must solve transit business need(s) to be useful and inspire a desire to maintain it.
d) Only a fully developed EA is useful
Correct! Statement is false, as an EA can be scalable and useful from the beginning.
Slide 55:
Learning Objective 4
Articulate how use of EA principles can benefit a transit agency
Slide 56:
EA Principles
What are EA Principles?
-
EA Principles are general rules or guidelines that inform how an organization sets about fulfilling its mission
(definition derived from The Open Group) - Often designed to maximize the value of technology investments
-
Described clearly by a:
- Name
- Statement
- Rationale
- Implications
Slide 57:
EA Principles
Benefits from Implementing EA Principles
-
Four general EA principles
- Enterprise-wide perspective
- Foster integration
- Leverage resources
- Business results focused
-
General IT/ITS focused EA principles
- Alignment of IT/ITS strategies with business vision and goals
- Interoperability
- Requirements-based change

Slide 58:
EA Principles
Benefits from Implementing EA Principles (continued)
-
Data Architecture specific EA principles
- Data is an asset
- Data is shared
- Data is accessible
- Common vocabulary and data definitions
Slide 59:
EA Principles
Example of an EA Principle Description (summarized from The Open Group)
- Name: Interoperability
- Statement: Software and hardware should conform to defined standards that promote interoperability for data, applications, and technology.
- Rationale: Standards help ensure consistency... help ensure support from multiple vendors... and facilitate supply chain integration.
-
Implications:
- Interoperability standards will be followed unless there is a compelling business reason not to do so.
- A process for setting standards, periodically reviewing them, and granting exceptions must be established.

Slide 60:
EA Principles
Applying EA Principles
-
Communicate the principles widely
- Rationale and implications should be understood
-
EA Principles should influence
- Assessment of the current architecture
- Decisions and approaches for moving forward
- Development of evaluation criteria for new products

Slide 61:
ITS
EA Principles improve integration and standardization of ITS initiatives
-
Examples of EA Principles that directly support more successful, better integrated ITS initiatives
- Foster partnerships
- Data is shared
- Common vocabulary and Data Definitions
- Interoperability
- Leverage the ITS Environment
Slide 62:

Slide 63:
Question
Which of the following would be the poorest EA Principle for supporting efficiencies in transit?
Answer Choices
- Be focused on creating business results
- Buy the most advanced, complex software
- Control technical diversity
- Have an enterprise-wide perspective
Slide 64:
Review of Answers
a) Be focused on creating business results
Incorrect. A business results focus supports efficiencies.
b) Buy the most advanced, complex software
Correct! For example, the most advanced software application may create inefficiencies because it's difficult to use and maintain.
c) Control technical diversity
Incorrect. Controlling technical diversity, such as through the use of standards, creates efficiencies.
d) Have an enterprise-wide perspective
Incorrect. An enterprise-wide perspective promotes efficiencies, as it helps find redundancies and other issues.
Slide 65:
Module Summary
What We Have Learned about EA
- Define an Enterprise Architecture (EA)
- Review the benefits to a transit organization of having an EA
- Describe the general process for creating a transit Enterprise Architecture
- Articulate how the use of EA principles can benefit a transit agency
From an ITS perspective, EA allows for more integration of ITS technologies and applications within an existing and/or planned transit agency network.
Slide 66:
Thank you for completing this module.
Feedback
Please use the Feedback link below to provide us with your thoughts and comments about the value of the training.
Thank you