ITS Transit Standards Professional Capacity Building Program
Module 18: Transit and the Connected/Automated Vehicle Environment/Emerging Technologies, Applications, and Future Platforms
HTML of the PowerPoint Presentation
(Note: This document has been converted from a PowerPoint presentation to 508-compliant HTML. The formatting has been adjusted for 508 compliance, but all the original text content is included, plus additional text descriptions for the images, photos and/or diagrams have been provided below.)
Slide 1:
(Extended Text Description: Welcome - Graphic image of introductory slide. A large dark blue rectangle with a wide, light grid pattern at the top half and bands of dark and lighter blue bands below. There is a white square ITS logo box with words "Standards ITS Training - Transit" in green and blue on the middle left side. The word "Welcome" in white is to the right of the logo. Under the logo box is the logo for the U.S. Department of Transportation, Office of the Assistant Secretary for Research and Technology.)
Slide 2:
Module: 18
Transit and the Connected/Automated Vehicle Environment/Emerging Technologies, Applications, and Future Platforms
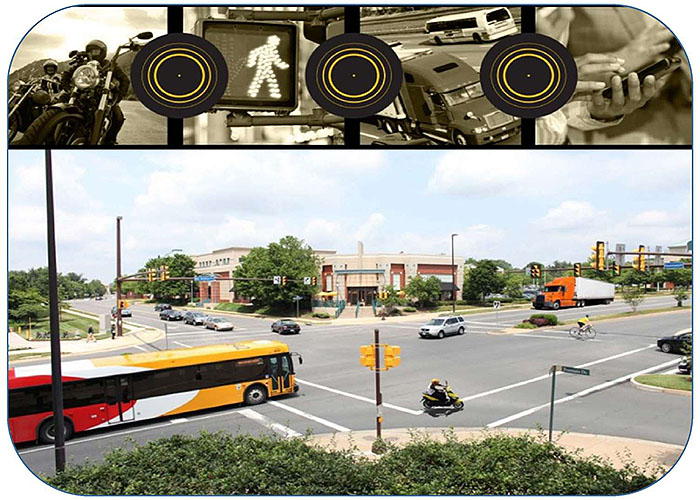
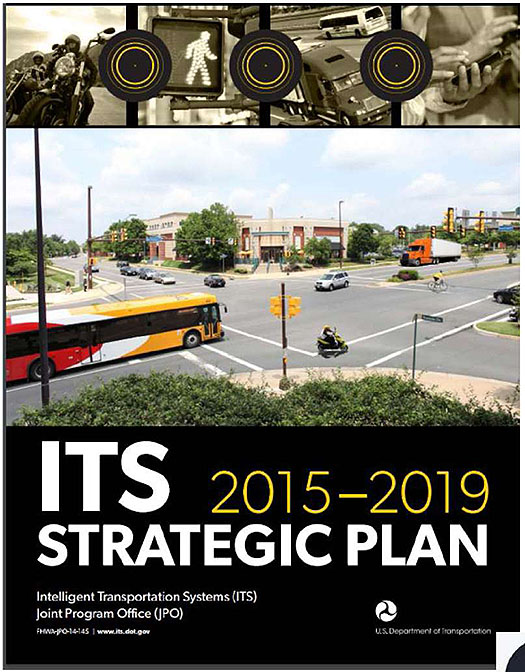
(Extended Text Description: Title slide contains the title Module: 18 Transit and the Connected/Automated Vehicle Environment/Emerging Technologies, Applications, and Future Platforms and an image of an intersection with a bus passing through it. The image is from the cover of USDOT's Intelligent Transportation Systems (ITS) ITS Strategic Plan 2015-2019.)
Slide 3:
Instructor
Jerome M. Lutin, PhD, PE
Senior Director of Statewide and Regional Planning (Retired)
New Jersey Transit
Slide 4:
Learning Objectives
- Define relationships between connected vehicle and automated transit vehicle functionality
- Describe potential for autonomous bus guidance for safety, access, and capacity
- Describe development of automated collision avoidance technologies for buses and paratransit vehicles
- Explain potential for AV/CV technologies to support first mile/last mile connections
- Describe fundamentals of rail transit system connected/automated operation
Slide 5:
Learning Objective 1
Define the relationships between connected vehicle and automated transit vehicle functionality
Slide 6:
Distinguishing Automated Vehicles from Connected Vehicles
Defining Terms Automated or autonomous?
- Automated - perform a task using machinery or computers rather than humans
- Autonomous - having the power to control oneself, make decisions
Two types of connectivity
- Connect by using Dedicated Short Range Communications technology (DSRC) for Vehicle to Vehicle (V2V) and Vehicle to Infrastructure (V2I) communications
- Connect vehicles as the Internet of Things (IoT) using commercial Wi-Fi and cellular technology

Slide 7:
Distinguishing Automated Vehicles from Connected Vehicles
Autonomous Vehicles - How do they work?
- Sensors
- Mapping
- Perception
- Communication
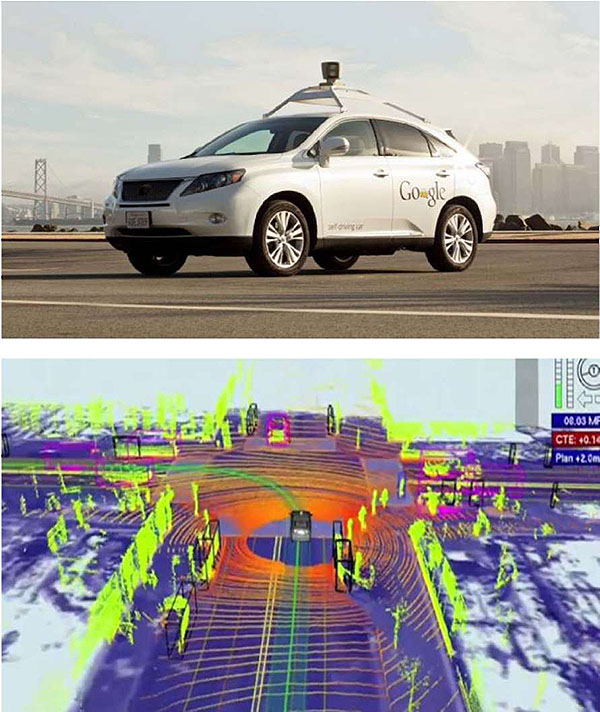
(Extended Text Description: This slide includes two photos: The upper photo shows a Lexus RX450 retrofitted with autonomous driving technology by Google. The lower photo shows an image produced by the various sensor inputs used by the Google technology.)
Slide 8:
Review of Module 11 Learning Objectives
Module 11: Transit and the Connected Vehicle Environment/Emerging Technologies, Applications, and Future Platforms
Learning Objectives
- Describe the connected vehicle environment
- Identify and evaluate the potential communications technologies that may be used in a transit connected vehicle environment
- Identify the ITS standards that support the transit connected vehicle environment
- Describe the applications being developed in a transit connected vehicle environment
- Identify the challenges to the successful deployment of a transit connected vehicle environment
- Describe strategies and approaches for deploying a transit connected vehicle environment

Slide 9:
Additional Resources for Understanding the Connected Vehicle Environment
Connected Vehicles 101 Objectives
- What is meant by "connected" vehicles?
- What are the terms/jargon related to connected vehicles?
- What technology is used for connected vehicles?
- Which applications are available for connected vehicles? What is the pertinent USDOT research related to connected vehicles, including applications and technologies?
- What issues may you face in preparing for connected vehicle implementation?
- How can you become or stay involved?
Slide 10:
Additional Resources for Understanding the Connected Vehicle Environment
Connected Vehicles 102: Applications and
Implementation
- Connected Vehicles: Introduction and Current Status
- Preparing to Implement Connected Vehicle Applications
- Safety Applications
- Mobility Applications
- Environmental Applications
- Implementing Connected Vehicle Applications
Slide 11:
Additional Resources for Understanding the Connected Vehicle Environment
Connected Vehicles 201: Developing a Plan for Implementing Connected Vehicle Projects
(will be available online in 2017)
- Planning for CV Deployment
- Concept Development
- System Requirements
- Comprehensive Deployment Plan
Slide 12:
Challenges and Opportunities - Report from GAO
Intelligent Transportation Systems Vehicle-to-Infrastructure Technologies Expected to Offer Benefits, but Deployment Challenges Exist
http://gao.gov/products/GAO-15-775
Why Government Accountability Office (GAO) Did This Study:
-
USDOT key milestones for the year 2040
- 90 percent of the U.S. light duty vehicle fleet is DSRC enabled
- 80 percent of all traffic signals are DSRC equipped
- DSRC exists at up to 25,000 additional safety-critical roadway locations.
- There are a variety of challenges that may affect the deployment of V2I technologies
Slide 13:
Challenges and Opportunities - Report
from GAO
What GAO Found
- Possible sharing of frequency spectrum for V2I with other wireless users could adversely affect V2I technologies' performance
- States and local agencies lack resources to deploy and maintain V2I technologies
- Technical standards need to be developed to ensure interoperability
- Need to develop and manage data security and address public perceptions related to privacy
- Need to ensure that drivers respond appropriately to V2I warnings
- Need to address the uncertainties related to potential liability issues posed by V2I
- The full extent of V2I technologies' benefits and costs is unclear
Slide 14:
USDOT Joint Program Office (JPO) ITS Strategic Plan
Strategic Priorities and Themes
Realizing Connected Vehicle (CV) Implementation
- Builds on progress made in recent years on design, testing, and planning for CVs
Advancing Automation
- Shapes the ITS Program around research, development, and adoption of automation-related technologies
Slide 15:
Relationship Between Connectivity and Program Category - Advancing Automation
Potential Benefits of Automation
- Reducing the number and severity of crashes
- Reduction of aggressive driving
- Expanding the reach of transportation modes to disabled and older users
- Providing "last mile" connectivity service for all users
- Increasing the efficiency and effectiveness of existing transportation systems
- Providing guidance to state and local agencies to help them understand the impacts of automated vehicles
Slide 16:
Federal Automated Vehicles Policy
"Accelerating the Next Revolution In Roadway Safety"
Released September 2016
National Highway Traffic Safety Administration (NHTSA) of the US Department of Transportation
https://www.transportation.gov/AV
- Vehicle Performance Guidance for Automated Vehicles
- Model State Policy
- NHTSA's Current Regulatory Tools
- New Tools and Authorities
Slide 17:
Levels of Road Vehicle Automation -NHTSA, SAE, BASt
Why are there Levels of Automation?
- Identify driving levels from "no automation" to "full automation"
- Base definitions on functional aspects
- Describe distinctions for step-wise progression through levels
- Consistent with current industry practice
- Eliminate confusion; useful across numerous disciplines (engineering, legal, media, and public discourse)
- Clarify drivers' role while driving automation system is engaged
NHTSA - National Highway Traffic Safety Administration SAE - Society of Automotive Engineers International
BASt - Bundesanstalt fur Straftenwesen - Federal Highway Research Institute (Germany)
Slide 18:
(NHTSA) Adopts SAE Levels of Automation
- Level 0, human driver does everything;
- Level 1, automated system can sometimes assist human with some parts of the driving task;
- Level 2, system can conduct some parts of driving task, while human monitors driving environment and performs rest of the driving task;
- Level 3, system can conduct some parts of driving task and monitor the driving environment in some instances, but human must be ready to take back control when system requests;
- Level 4, system can conduct driving task and monitor driving environment, but system can operate only in certain environments and under certain conditions;
- Level 5, system can perform all driving tasks, under all conditions

Slide 19:
Standards Development Organizations (SDOs) Active in the Automated/Connected Space
American Public Transportation Association (APTA)
- Bus Procurement and Transit Communications Interface Profiles (TCIP)
American Society of Civil Engineers (ASCE)
- Automated Transit Systems
American Society of Testing and Materials International (ASTM)
- Telecommunications Networks
Association of American Railroads (AAR)
- Positive Train Control (PTC)
Slide 20:
Standards Development Organizations (SDOs) Active in the Automated/Connected Space
Institute of Electrical and Electronics Engineers (IEEE)
- Automated and Connected Vehicles
Institute of Transportation Engineers (ITE)
- Standards Training
International Organization for Standardization (ISO)
- Data Communications for V2X
- Vehicle Dynamics
Society of Automotive Engineers SAE International (SAE)
- Vehicle Automation Taxonomy
- Reference Architecture for Vehicle Automation
Slide 21:
Enabling and Emerging Standards
Emerging Standards for Automated and Connected Vehicles
- ASCE Standard 21-13 Automated People Movers
- IEEE P2040 Standard for Connected, Automated, and Intelligent Vehicles
- ISO 19091 Intelligent transport systems Cooperative ITS Using V2I and I2V communications for applications related to signalized intersections

Slide 22:
Enabling and Emerging Standards
Emerging Standards for Automated and Connected Vehicles - SAE
- SAE J3016 Taxonomy and Definitions for Terms Related to On-Road Motor Vehicle Automated Driving Systems
- SAE J3018 Guidelines for Safe On-Road Testing of SAE Level 3, 4, and 5 Prototype Automated Driving Systems (ADS)
- SAE J3092 Dynamic Test Procedures for Verification & Validation of Automatic Driving Systems (ADS)
- SAE J3131 Automated Driving Reference Architecture
Slide 23:

Slide 24:
Question
In a NHTSA Level 3 automated vehicle, the driver is:
Answer Choices
- expected to be available for control in certain areas
- not expected to be available for control during the trip
- responsible for monitoring and available to resume control
- in complete and sole control
Slide 25:
Review of Answers
 a) expected to be available for control in certain areas
Incorrect. This describes driver's role in Level 4.
b) not expected to be available for control during the trip
Incorrect. This describes driver's role in Level 5.
 c) responsible for monitoring and available to resume control
Correct! Driver must monitor and be able to take control.
d) in complete and sole control
Incorrect. This describes driver's role in Level 0.
Slide 26:
Learning Objective 2
Describe the potential for autonomous bus guidance for safety, access, and capacity
Slide 27:

Slide 28:
Minnesota Bus on Shoulders
Bus Rapid Transit Technologies:
Assisting Drivers Operating Buses on Road Shoulders Bus on shoulder makes more efficient use of roadway
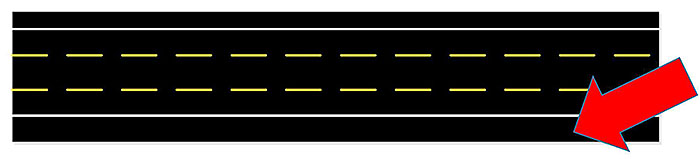
(Extended Text Description: This diagram illustrates plan view of a roadway section on a divided highway with three 12 foot (3.7 m) wide lanes separated by dashed lines operating in the same direction and a 10 foot (3.0 m) shoulder on each side. An arrow points to the shoulder.)
- Consider 3 lanes, 2 shoulders (12 foot-wide lanes, 10-foot wide shoulders)
- Only 64% of paved surface used to move people and goods
- Using only one shoulder (of two available) increases usable surface by 28%
- Capacity increased by 28% with minimal investment!
Slide 29:
Minnesota Bus on Shoulders
Minneapolis - St. Paul
295 mi (476 km)
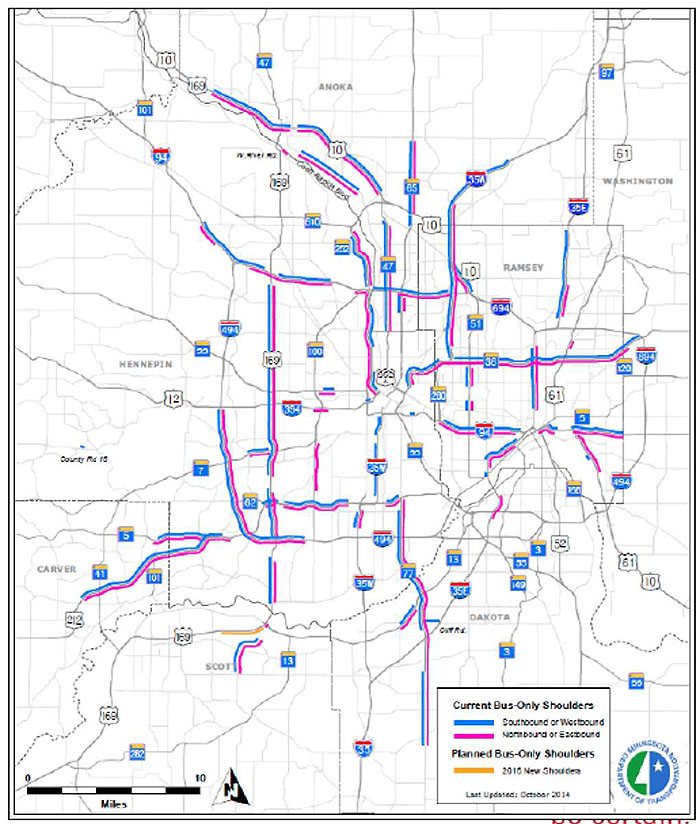
(Extended Text Description: This slide shows a map of the freeway system serving Minneapolis, MN. Red and blue lines on the map illustrate the extent of the Bus on Shoulder system on freeways in the Minneapolis area. Red lines are northbound or eastbound and blue lines are southbound or westbound.)
Slide 30:
Minnesota Bus on Shoulders
Bus Rapid Transit Technologies: Assisting Drivers Operating Buses on Road Shoulders
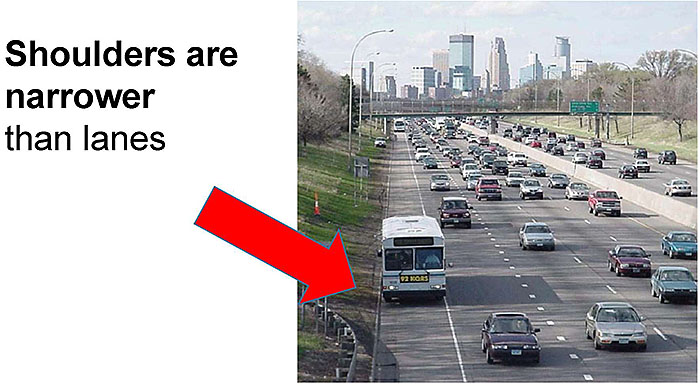
(Extended Text Description: An arrow points to the shoulder. This slide contains a photo of a four lane section of a freeway taken from above the freeway. It shows traffic coming toward the observer and a bus filling the shoulder on the left side of the freeway. Text to the left of the arrow reads, Shoulders are narrower than lanes.)
Slide 31:
Minnesota Bus on Shoulders
Bus Rapid Transit Technologies: Assisting Drivers Operating Buses on Road Shoulders
2010: 10 Minnesota Valley Transit buses equipped with driver assist systems
- Lane keeping
- Lane departure warning
- Forward collision awareness
- Side collision awareness
- Comprehensive driver interface - Graphical, tactile (active seat), haptic (steering feedback)
2016: 11 new buses will receive Driver Assist System and existing 10 will be upgraded to same specs -incorporate lessons learned
Slide 32:
Minnesota Bus on Shoulders
Bus Rapid Transit Technologies: Assisting Drivers Operating Buses on Road Shoulders: Tech Upgrades
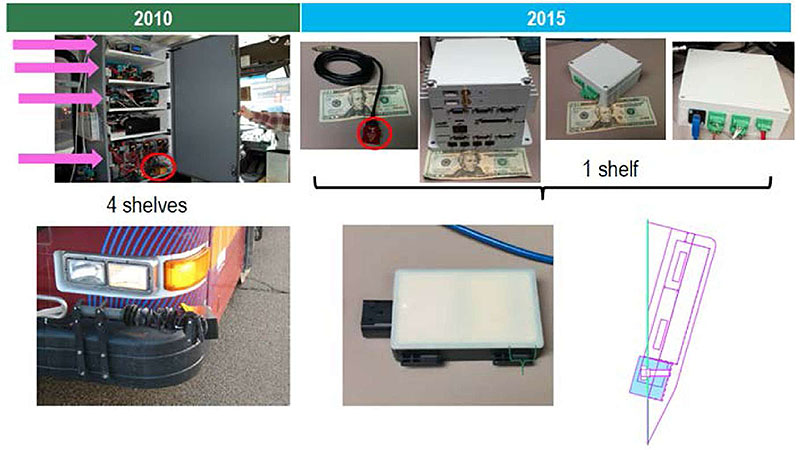
(Extended Text Description: This slide shows photos of the equipment mounted on the bus for ADAS. On the left side it shows 2010 equipment filling a cabinet behind the bus driver and a LIDAR unit mounted on the front bumper. The right photo shows equipment from the 2015 installation which is much smaller and fits on one shelf in the cabinet. The LIDAR is replaced with a radar unit that fits in a recess on the outside of the bus.)
Slide 33:
Minnesota Bus on Shoulders
Bus Rapid Transit Technologies: Assisting Drivers Operating Buses on Road Shoulders: Tech Upgrades
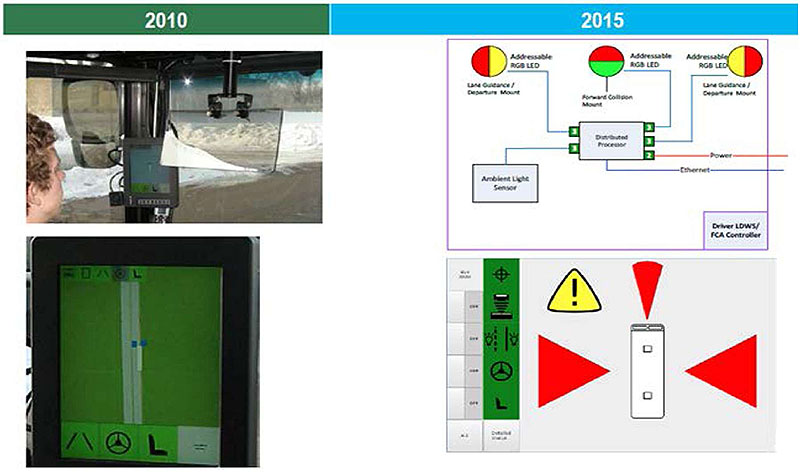
(Extended Text Description: This slide shows, on the left, the 2010 displays located before the driver including a PDA mounted on the left front pillar of the bus and a heads-up display in front of the driver. On the right, the 2015 equipment has been reduced in size to three multi-color LEDs mounted on the dash and a small multi-color indicator panel touch screen display unit.)
Slide 34:
Minnesota Bus on Shoulders
Bus Rapid Transit Technologies: Assisting Drivers Operating Buses on Road Shoulders
LRT vs. BoSS. BoSS with automation provides robust service in all-weather at significant capital cost savings.
| Category | LRT* | BOS** |
|---|---|---|
| Capital Costs | $1.7B | $150 |
| Operational Cost / Year | $12 -$17M | $18.1M |
* Metropolitan council estimates, 2011
**
- 46K miles per bus per year
- 4 MPG per bus (Diesel)
- 120 buses
- Fuel consumption: 1.4M Gallons
- Fuel Cost (at $5 per gallon): $6.9M
- Maintenance: S1 OK per bus per year - $1,2M
- Driver salary: $10M ($40;hn 8 hrs/day)
Slide 35:

Slide 36:
Lane Transit District BRT Automated Docking
Lane Transit District Emerald Line (EmX) Bus Rapid Transit (BRT) - Eugene Oregon Pilot Opened 2007
- Four mile line between Eugene and Springfield
- 10-15 minute headways
- 1.6 miles of dedicated right of way
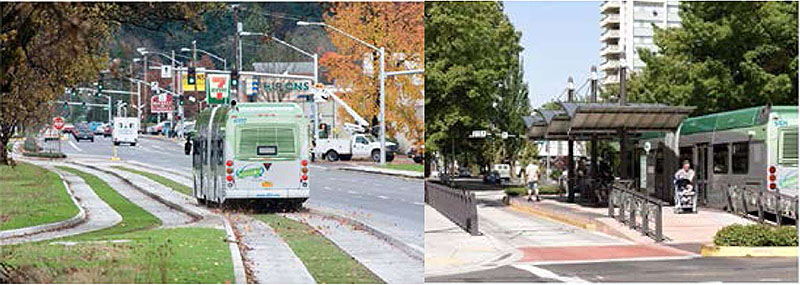
(Extended Text Description: This slide shows two photos of the Land Transit District EmX BRT line. The photo on the left shows a bus traveling away from the camera on exclusive right of way with concrete strips under the tires and a center strip of grass. The photo on the right shows a bus stopped at a station platform with an overhead canopy and the platform level with the floor of the bus.)
Slide 37:
Lane Transit District BRT Automated Docking
Bus Rapid Transit Issues Today
- Customers demand high-quality transit services
- Agencies need a safer and more cost-effective transit system
- Insufficient funding for building and operating new light or heavy rail systems
- Space limitations for installing bus-only lanes in existing ROW
- Drivers complain about driving in narrow, bus-only lanes
Slide 38:
Lane Transit District BRT Automated Docking
Vehicle Assist and Automation (VAA) Technologies for BRT
-
Functions to be tested:
- Magnetic lane guidance for dedicated BRT lane
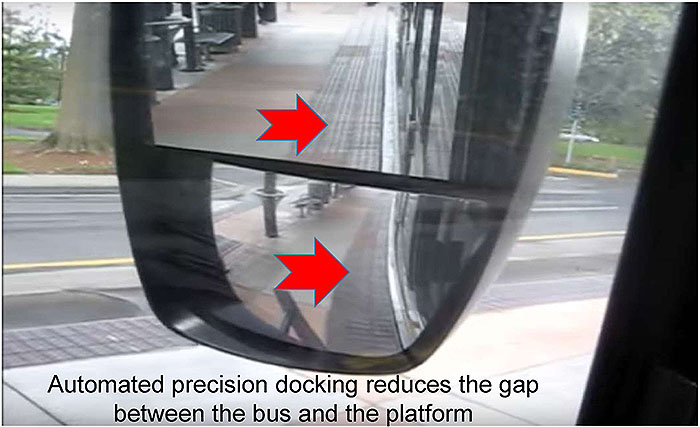
- Precision docking
-
Testing to determine potential benefits
- Reduced right-of-way requirements and infrastructure build-out costs
- "Rail-like" operations
- Smoother and faster travel
- Reduced operating and maintenance costs
- Reduced accidents
Slide 39:
Lane Transit District BRT Automated Docking
Vehicle Assist and Automation (VAA) Technologies for BRT
-
23 mile BRT line
- 3 miles of magnets installed
- LTD maintenance yard test track
-
One 60' New Flyer bus equipped
- Two sensor bars
- Steering actuator
- Computer controller
- Human-Machine Interface display
Slide 40:
Lane Transit District BRT Automated Docking
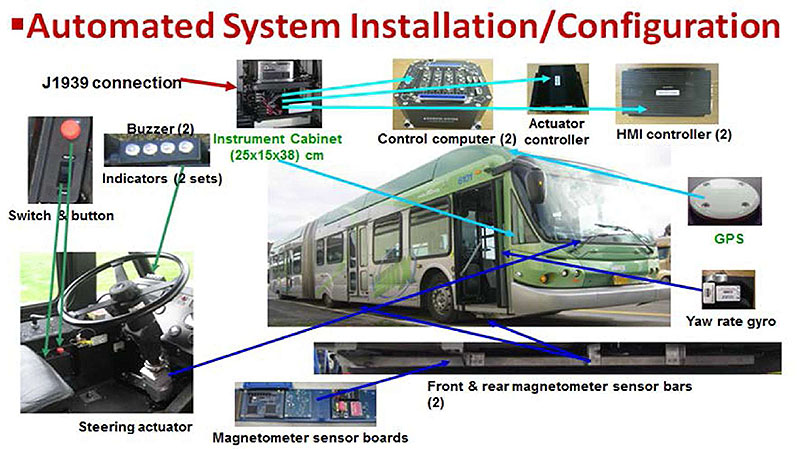
(Extended Text Description: Author's relevant notes: This slide shows a front and side view of a bus with arrows pointing to the locations of various equipment. The photo of the bus has photos around it showing (starting at top left: J1939 connector, instrument cabinet, control computer, actuator controller, HMI controller, GPS, Yaw rate gyro, Front and rear magnetometer bar, Magnetometer sensor bars, Steering actuator on steering wheel, Switch button, and Buzzer and indicator lights.)
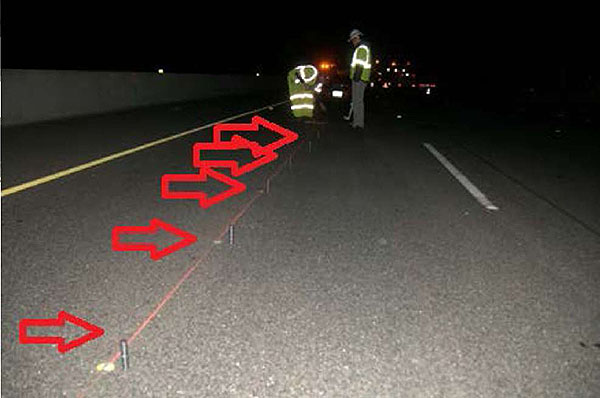
Slide 41:
Lane Transit District BRT Automated Docking
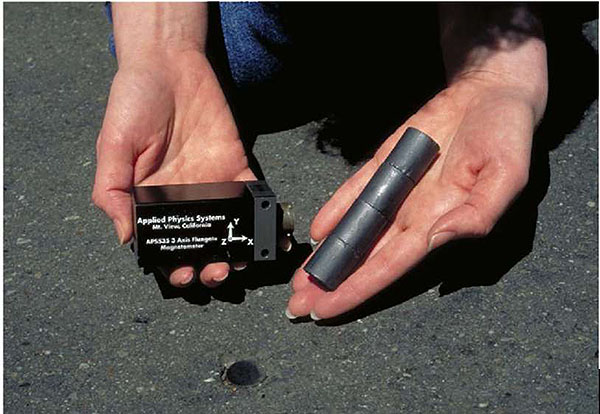
The magnetometer (in the right hand) is used on the bus to follow the path created by a series of magnets (in the left hand)
The bottom photo shows the magnets being installed in holes drilled in the pavement
Slide 42:
Lane Transit District BRT Automated Docking
Slide 43:
Lane Transit District BRT Automated Docking
VAA Field Operational Test (FOT) in Revenue Service - Design & Development for Deployment
Revenue service elevates design requirements of automated control
- Apply product development methodologies (reliability + maintainability)
- Emphasis on safety design (redundancy + fault detection/management) Fail-safe and fail-soft
Deployment requires professional installation
- Installation not to degrade bus normal operations
- Normal maintenance to be straightforward (visual inspection, fault reporting, data collection)
- Most repairs could be conducted by transit personnel (spare part replacement)
Slide 44:
Lane Transit District BRT Automated Docking
VAA FOT Revenue Service - Design and Development for Deployment
-
Deployment requires the handling of all operational modes
- Work in all possible operational conditions and scenarios (different drivers, speeds, weather, traffic conditions, transition methods, ...)
- Detect and manage all (known) faults
-
Revenue service demands addressing any (new) issues
Work through operational and other issues (e.g., policy, legal, institutional) with transit agencies
Slide 45:
Potential for Bus Platooning
Bus Platooning Concept Introduced in Demo '97
- Part of automated highway demonstration (Demo'97) sponsored by USDOT National Automated Highway System Consortium (NAHSC)
- Mandated by 1991 ISTEA legislation
- Two Houston Metro low-floor New Flyer buses were equipped with full automation
- Magnetic nails embedded in pavement provided guidance
Slide 46:
Potential for Bus Platooning
Guidance Technology has been upgraded since 1997
- V2V communications allow cooperative adaptive cruise control (CACC)
- Commercial truckers see truck platoons as a way to improve safety and reduce fuel consumption
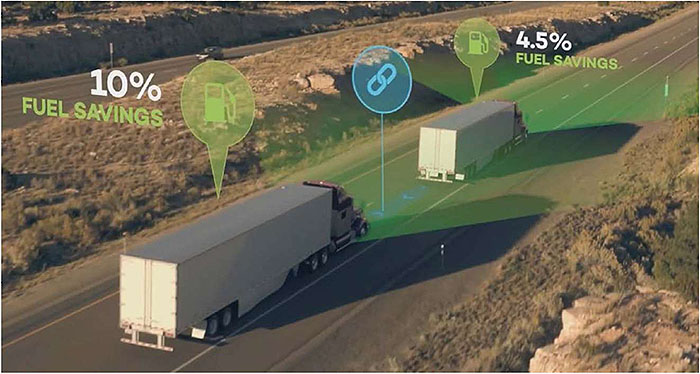
(Extended Text Description: This slide has a photo at the bottom showing two tractor trailer trucks from above heading away from the camera. Green shading emanating from the front of the trucks represents sensors used to measure distances. A chain link image between the trucks represents that they are electronically linked to follow closely.)
Slide 47:
Potential for Bus Platooning
New Starts projects for transit often compare Bus Rapid Transit (BRT) with Light Rail Transit (LRT)
- BRT ride quality is not as smooth as LRT
- BRT does not match potential LRT capacity
- Automated/Connected operation using Cooperative Adaptive Cruise Control (CACC) enables buses on BRT to improve both ride quality and capacity, offering potential for less expensive infrastructure
Slide 48:
Potential for Bus Platooning
Potential to Add Peak Period Capacity at Less Cost
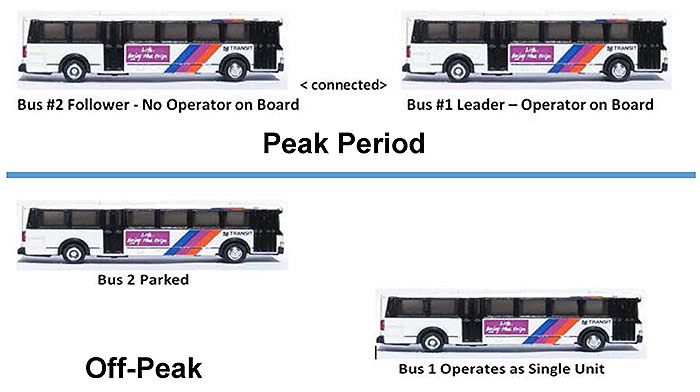
(Extended Text Description: The top image labeled "Peak Period" shows two buses heading from left to right and the word "connected" between them. The bus on the right is labeled "Bus #1 Leader – Operator on board. The bus on the left is labeled "Bus #2 Follower – no operator on board. The bottom image show the bus on the left labeled "Off Peak" shows the bus on the left labeled "Bus #2 parked" and the bus on the right labeled Bus #1 operates as a single unit.)
Slide 49:
Potential for Bus Platooning
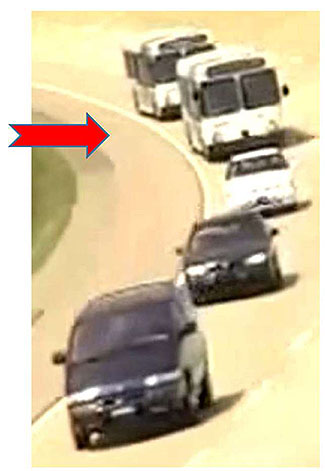
Potential to Increase Capacity in High Volume Bus Corridors
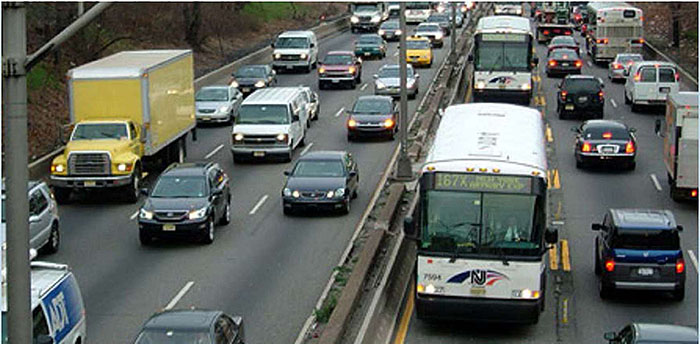
(Extended Text Description: This slide contains a photo looking down onto a six-lane roadway separated by a barrier. The three lanes on the left heading toward the camera are eastbound lanes with cars and trucks. On the right of the barrier, the closest lane also is operating eastbound, filled only with buses. It is a contra-flow bus-only lane. Next to that lane are two lanes headed westbound, away from the camera.)
Slide 50:
Potential for Bus Platooning
Potential Increased Capacity of Exclusive Bus Lane (XBL) Through Decreased Separation Using Cooperative Adaptive Cruise Control (CACC) (Assumes 45 foot (13.7 m) buses each with 57 seats)
| Average Interval Between Buses (seconds) | Average Distance Between Buses (ft.) | Average Distance Between Buses (m) | Buses Per Hour | Seated Passengers Per Hour | Increase in Seated Passengers per Hour from Base |
|---|---|---|---|---|---|
| 1 | 6 | 2 | 3,600 | 205,200 | 164,160 |
| 2 | 47 | 14 | 1,800 | 102,600 | 61,560 |
| 3 | 109 | 33 | 1,200 | 68,400 | 27,360 |
| 4 | 150 | 46 | 900 | 51,300 | 10,260 |
| 5 (Base) | 212 | 64 | 720 | 41,040 | - |
Slide 51:

Slide 52:
Question
Which of the following bus pilot technologies is most reliant on connected vehicle (V2V) technology?
Answer Choices
- Automated Docking
- Bus on Shoulder
- Hybrid Propulsion
- Bus Platooning
Slide 53:
Review of Answers
a) Automated Docking
Incorrect. Used mainly magnetic guidance.
b) Bus on Shoulder
Incorrect. Used mainly radar and GPS.
c) Hybrid Propulsion
Incorrect. Hybrid propulsion not mentioned in the pilots.
d) Bus Platooning
Correct! Bus spacing mainly relies on communication.
Slide 54:
Learning Objective 3
Development of automated collision avoidance technologies for buses and paratransit vehicles
Slide 55:
National Transportation Safety Board (NTSB) Report on Forward Collision Avoidance
Special Investigation Report - The Use of Forward Collision Avoidance Systems to Prevent and Mitigate Rear End Crashes - 2015
"The NTSB has no authority to regulate, fund, or be directly involved in the operation of any mode of transportation."
Slide 56:
National Transportation Safety Board (NTSB) Report on Forward Collision Avoidance
"currently available forward collision avoidance technologies for passenger and commercial vehicles ... could reduce rear-end crash fatalities."
NTSB recommendations:
- Manufacturers - install forward collision avoidance systems on all newly manufactured passenger and commercial motor vehicles
- NHTSA - expand New Car Assessment Program to include graded performance rating of forward collision avoidance systems
- NHTSA - expand or develop protocols for assessment of forward collision avoidance systems
Slide 57:
National Transportation Safety Board (NTSB) Report on Forward Collision Avoidance
Forward collisions reduced 71% for trucks with collision avoidance systems, (CAS) autonomous emergency braking, (AEB) and electronic stability control (ESC)
NTSB called for immediate action to require these systems on new vehicles
- Transit required to retain buses for 12 + years
- Years before transit benefits from CAS and AEB on new buses
- Need to retrofit existing buses with CAS and AEB
- Need standards for CAS and AEB for retrofits and new buses
Slide 58:
Collision Avoidance - Magnitude of the Problem for Transit
Trend in Rate of Bus and Paratransit Injuries Per Passenager Mile
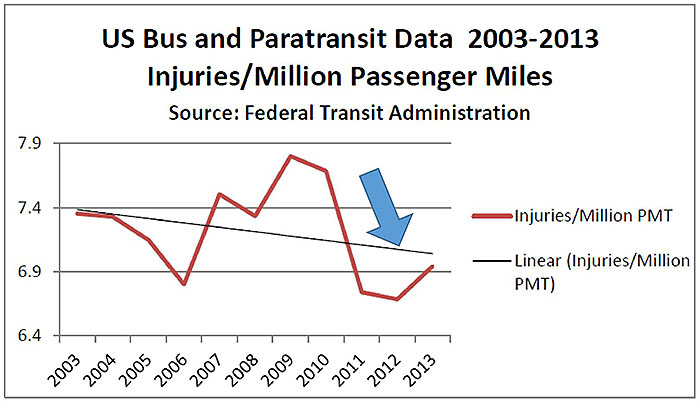
(Extended Text Description: Author's relevant notes: This slide labeled "Trend in Rate of Bus and Paratransit Injuries per Passenger Mile" shows a line graph. The horizontal axis is labeled with years from 2003 to 2013. The vertical axis is labeled with numbers 6.4, 6.9. 7.4, and 7.9 representing injuries per million passenger miles. A red line shows a declining trend from left to right.)
Slide 59:
Collision Avoidance - Magnitude of the Problem for Transit
Trend in Number of Bus and Paratransit Injuries Per Year
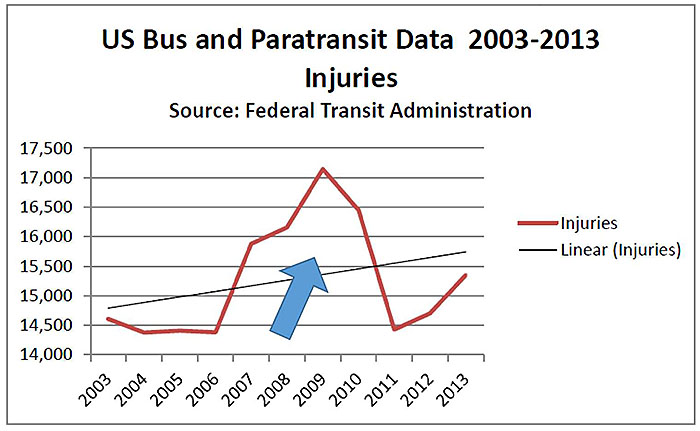
(Extended Text Description: Author's relevant notes: This slide labeled "Trend in Number of Bus and Paratransit Injuries per Year - US Bus and Paratransit Data 2003-2013," shows a line graph. The horizontal axis is labeled with years from 2003 to 2013. The vertical axis is labeled with numbers from 14,000 to 17,500. A red line rises unevenly but a trend line shows an increasing trend in in injuries.)
Slide 60:
Collision Avoidance - Magnitude of the Problem for Transit
Trend in Bus and Paratransit Casualty and Liability Expenses
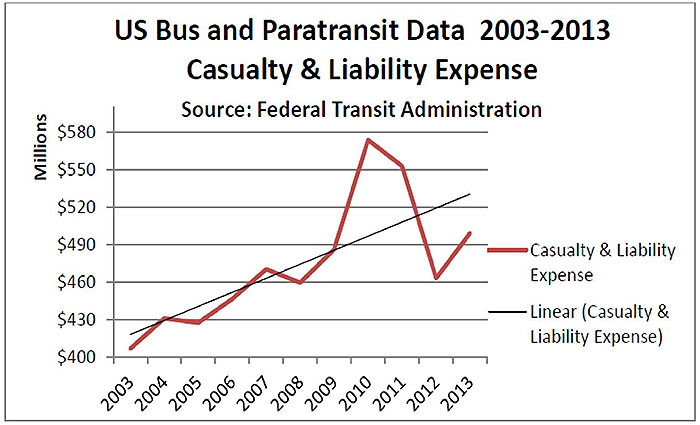
(Extended Text Description: Author's relevant notes: This slide labeled Trend in Bus and Paratransit Casualty and Liability Expenses US Bus and Paratransit Data 2003-2013 contains a line graph. The horizontal axis includes years from 2003 to 2013 and the vertical axis shows $ in millions from $400 million to $580 million. A red line rises sharply from left to right.)
Slide 61:
Collision Avoidance - Magnitude of the Problem for Transit
Collisions, Fatalities, Injuries, Casualty and Liability Expenses for Bus and Rail Modes
| Reporting Period 2002-2014 | Reporting Period 20022013 | |||
|---|---|---|---|---|
| Mode | Collisions | Fatalities | Injuries | Total Casualty and Liability Expenses by Mode |
| Total Bus, Demand Responsive and Van Pool | 85,391 | 1,340 | 201,382 | $5.75 Billion |
| Total Rail | 6,118 | 1,303 | 89,806 | $3.17 Billion |
Slide 62:
Collision Avoidance - Magnitude of the Problem for Transit
Transit Insurance Pool Data Show Major Portion of Injuries, Fatalities, and Claims are Collision Related
Examination of 232 closed claims for Washington State Transit Insurance Pool spanning 2006-2015
- 100% of fatalities (6 total) were collision-related (vehicle, pedestrian, and bicyclist)
- 88% of injuries (335 total) resulted from collisions or sudden stops
- 94% of claims ($24.9 million total) resulted from collisions or sudden stops
MANY OF THESE COULD HAVE BEEN PREVENTED WITH CAS AND AEB
Slide 63:
Slide 64:
Washington State Transit Insurance Pool
Safety Pilot
Innovations Deserving Exploratory Analysis (IDEA) grant awarded by TRB with additional funding from insurance companies
- Equipped 35 transit buses with CAS at seven member agencies and three buses at King County Metro
- Comprehensive examination of total costs for most severe and costly types of collisions
- Evaluate potential for CAS to reduce the frequency and severity of collisions, and reduce casualty and liability expenses
- Does not include autonomous braking in this phase
Slide 65:
Washington State Transit Insurance Pool
Safety Pilot
System Configuration
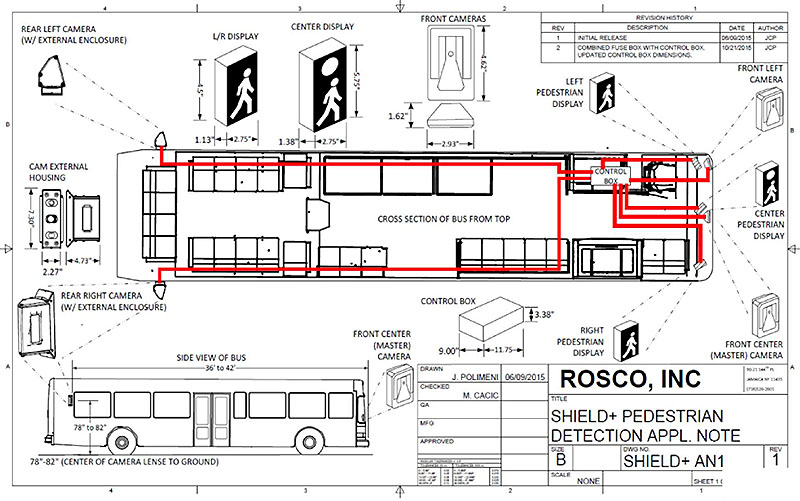
(Extended Text Description: This slide shows a plan view drawing of a bus with images showing the placement of cameras and indicators for the Rosco/Mobileye Shield+ system. Red lines show the wiring for electrical connections among the components. Author's relevant notes: This diagram shows the system that was installed in each of the 38 buses in the WSTIP pilot. A larger version appears in the Student Supplement. The Rosco/Mobileye Shield+ system includes the following components: Forward-facing center camera detects vulnerable road users (VRU's) which are pedestrians and bicyclists, reads speed limit signs, reads lane markings and measures distance to vehicles ahead of bus. Forward left camera detects pedestrians in blind area behind left front pillar when bus is turning. Rear right and left side cameras detect VRU's in blind spots behind driver. Three VRU warning displays are located in view of the driver on the left, center and right interior windshield and pillars.)
Slide 66:
Washington State Transit Insurance Pool
Safety Pilot
System Configuration -Alerts and Warning Displays
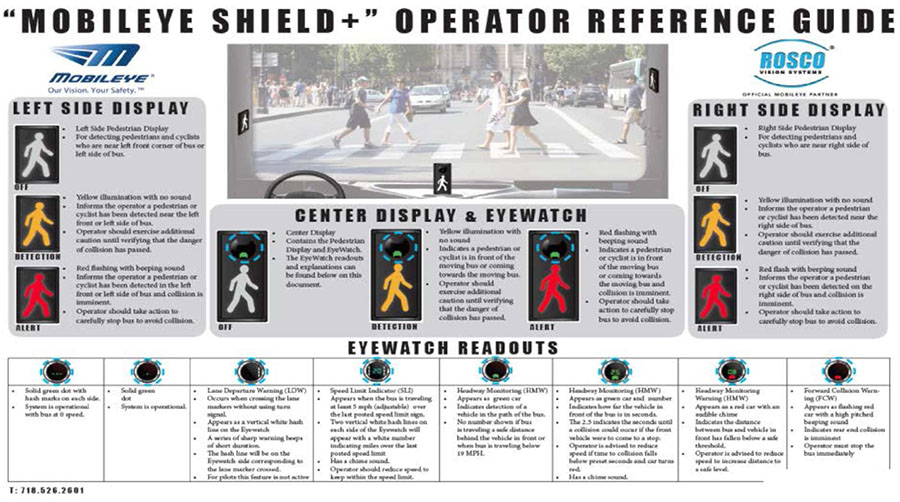
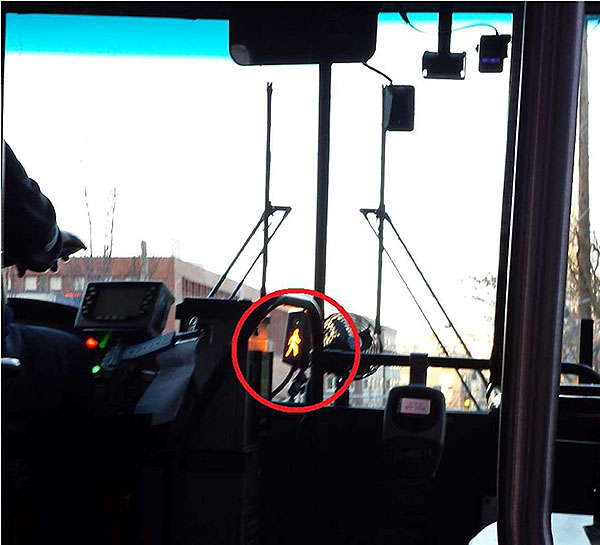
(Extended Text Description: Author's relevant notes: This slide shows a guide for bus drivers illustrating the alerts and warnings displayed by the Shield+ system. Rectangular indicators show an image of a pedestrian walking. The image is shown with no color when there is no pedestrian detected, yellow illumination when a pedestrian is detected close to the bus and red illumination when there is imminent risk of collision with the pedestrian.)
Slide 67:
Washington State Transit Insurance Pool Safety Pilot
System Configuration - Alerts and Warning Displays
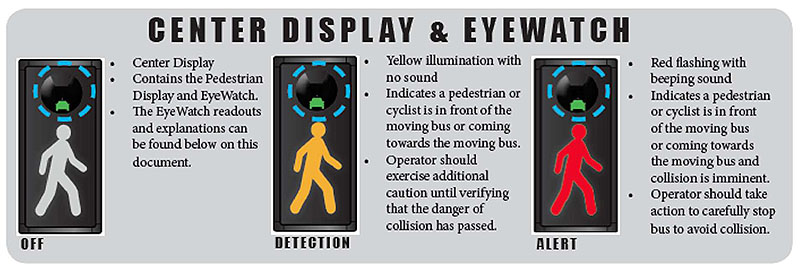
(Extended Text Description: This slide shows a close-up of the Center Display indicator which also has a circle above the pedestrian image that contains a green image representing that there is a vehicle in front of the bus. Additional bullet items contain the following text:
OFF
- Center Display
- Contains the Pedestrian Display and Eyewatch
- The Eyewatch readouts and explanations can be found below on this document.
DETECTION
- Yellow illumination with no sound
- Indicates a pedestrian or cyclist is in front of the moving bus or coming towards the moving bus.
- Operator should exercise additional caution until verifying that the danger of collision has passed.
ALERT
- Red flashing with beeping sound
- Indicates a pedestrian or cyclist is in front of the moving bus or coming towards the moving bus and collision is imminent.
- Operator should take action to carefully stop bus to avoid collision.
Slide 68:
Washington State Transit Insurance Pool
Safety Pilot
Telematics - Monitoring System Performance
- The CAS does not record video
- Additional technology is used to generate data that can be used to evaluate the systems' effectiveness
- Additional cameras record video of events
- Telematics unit captures and transmits data
Slide 69:
Washington State Transit Insurance Pool Safety Pilot
Monitoring System Performance with Telematics and Video
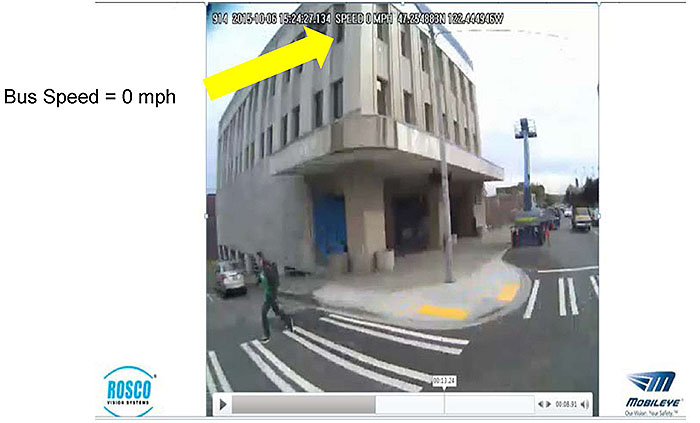
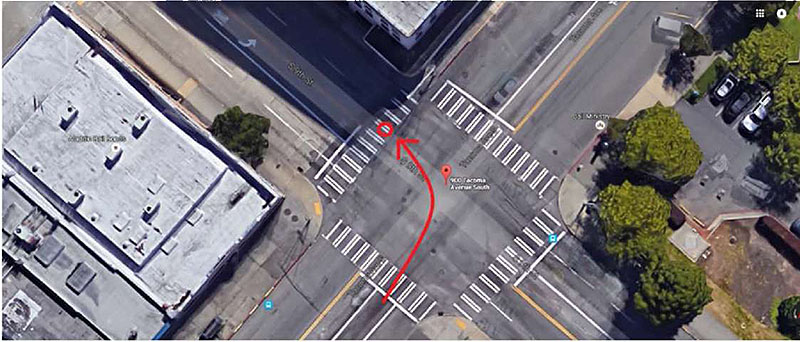
(Extended Text Description: This slide shows a frame from a video clip generated by an event triggered by the CAS. A building appears in the background. A pedestrian is shown crossing a street in a crosswalk in front of the bus. Text at the top of the frame shows the time, date, bus speed "zero" and GPS coordinates.)
Slide 70:
Washington State Transit Insurance Pool Safety Pilot
Field Testing the CAS - Mapping Telematics Data
Slide 71:
Washington State Transit Insurance Pool Safety Pilot
Field Testing the CAS
Checking System Performance in Revenue Service - comparing real time observations with telematics data
Slide 72:
Washington State Transit Insurance Pool Safety Pilot
Field Testing the CAS - Logging Telematics Data
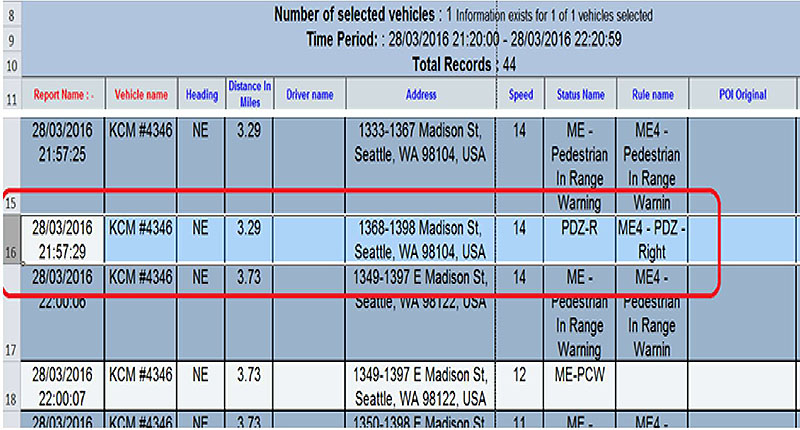
(Extended Text Description: Author's relevant notes: This graphic shows the telematics data recording of the pedestrian alert seen in the previous photo, on King County Metro trolley bus #4346 at on March 28, 2016 at 21:57:29 EDT = 18:57:29 PDT.)
Slide 73:
Autonomous Emergency Braking (AEB) - Need for Standards and Testing
The Need for Autonomous Braking
- The curved line shows velocity of the bus when braking
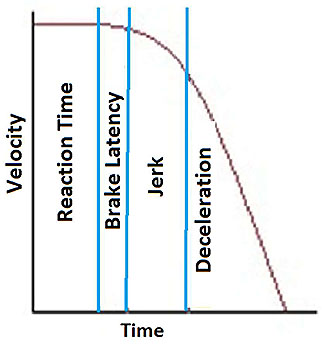
(Extended Text Description: This graphic shows a curved line graph descending to the right representing the velocity of a bus when stopping in anticipation of a collision. The vertical axis is velocity and the horizontal axis represents time. Four phases of stopping are shown: reaction, brake latency, jerk, and deceleration.)
Slide 74:
Autonomous Emergency Braking (AEB) - Need for Standards and Testing
The Need for Standards and Specifications
Transit buses require different CAS-AEB technology than cars and trucks
- Standing passengers could be injured from sudden stops
- Buses in service 12 -18+ years - ability to retrofit is key
- Cannot take buses out of service for long periods -standards help design systems for quicker retrofits and maintenance
- Little financial incentive for bus OEM's to do R&D for CAS -transit is being left behind
- Most buses purchased through competitive bidding requiring detailed specifications for CAS-AEB
Slide 75:
Autonomous Emergency Braking (AEB) -Need for Standards and Testing
Standards will need to address unique bus characteristics such as:
- Blind spot locations
- Component replacement and maintenance requirements
- Forces acting on seated and standing passengers
- Operator training and workload
- Proximity of pedestrians and waiting passengers
- Sensor placement
- Vehicle lifespan
Slide 76:

Slide 77:
Which of the following statements is true?
Answer Choices
- Casualty and liability expenses for rail transit far exceed those for bus transit.
- Driver reaction time is not a factor in avoiding bus collisions.
- National Transportation Safety Board does not require forward collision warning systems on all new vehicles.
- Transit buses are currently being delivered with Autonomous Emergency Braking.
Slide 78:
a) Casualty and liability (C&L) expenses for rail transit far exceed those for bus transit
Incorrect. Bus C&L expenses were 80% higher than rail.
b) Driver reaction time is not a factor in avoiding bus collisions
Incorrect. Bus moves at initial velocity during reaction.
c) The NTSB does not require forward collision warning (FCW) systems on all new vehicles
Correct! NTSB recommends, but has no authority to require it.
d) Transit buses are currently being delivered with Autonomous Emergency Braking (AEB)
Incorrect. AEB not currently available for transit buses.
Slide 79:
Learning Objective 4
Potential for AV/CV technologies to support first mile/last mile transit connections
Slide 80:

Slide 81:
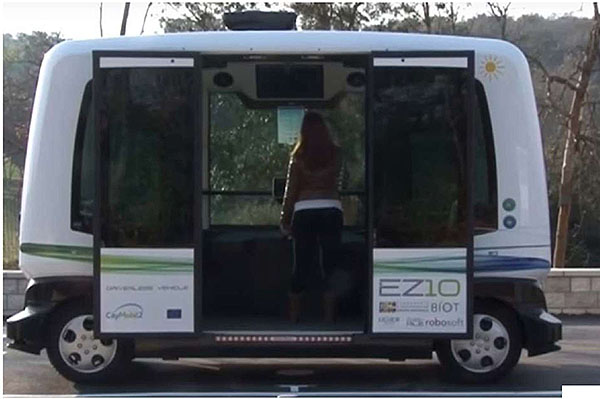
CityMobil2 Demonstrations
CityMobil2 - European Union project to pilot test automated road transit
- Pilot testing driverless shuttle vehicles across Europe
- Funded at �15 million ($19.5 million)
- Two sets of six vehicles supplied by two vendors, Easymile and Robosoft
- Vehicles are battery powered
- Operating speed is typically 8-15 km/hr. (5-9 mph)
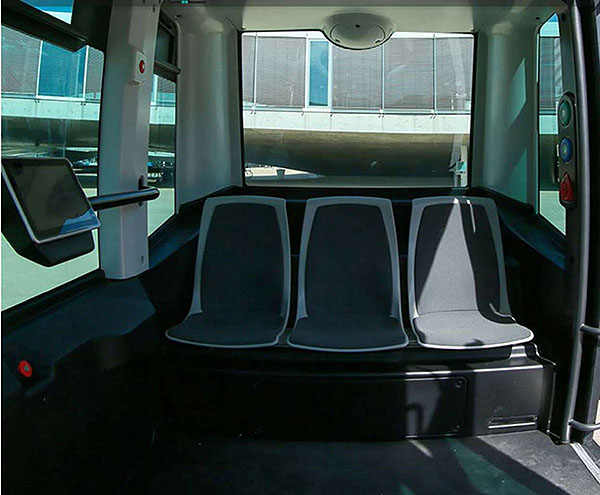
- Seating for six with four standees
- Guidance uses GPS and LIDAR
Slide 82:
CityMobil2 Demonstrations
CityMobil2 Demonstration Sites
| Demo Type | Location | Start Month | End Month | Vehicle Mfr | # of Veh | Route (km) | Stations Served | # of Riders |
|---|---|---|---|---|---|---|---|---|
| Large Scale | Lausanne, CH | 4/2015 | 8/2015 | Easymile | 4 | 1.5 | 6 | 7,000 |
| La Rochelle, FR | 12/2014 | 4/2015 | Robosoft | 6 | 14,660 | |||
| Trikala, GR | 9/2015 | 1/2016 | Robosoft | 6 | 2.5 | 12,150 | ||
| Small Scale | Antibes, FR | 1/2016 | 3/2016 | Easymile | 4 | 1.0 | 5 | 4,000 |
| Oristano, IT | 7/2014 | 9/2014 | Robosoft | 2 | 1.3 | 7 | 2,500 | |
| Vantaa, FI | 7/2015 | 8/2015 | Easymile | 4 | 1.0 | 19,000 | ||
| San Sebastian, ES | 4/2014 | Robosoft | 3 | 3,500 | ||||
| Showcase | Bordeaux, FR | 10/2015 | 10/2015 | Easymile | 4 | 1.0 | 2 | |
| Leon, ES | 9/2014 | 9/2014 | Robosoft | 2 | ||||
| Warsaw, PO | 4/2016 |
Slide 83:
CityMobil2 Demonstrations
CityMobil2 Vehicles - Exterior of Easymile EZ10 vehicle
Slide 84:
CityMobil2 Demonstrations
CityMobil2 Vehicles - Interior of Easymile EZ10 vehicle
Slide 85:
CityMobil2 Demonstrations
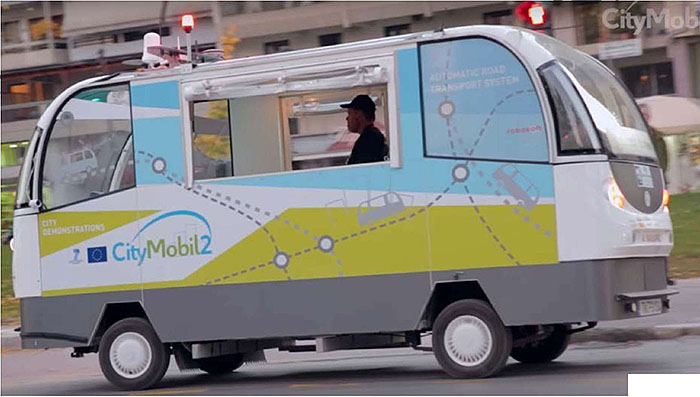
CityMobil2 - Robosoft RobuCITY vehicle
Slide 86:
CityMobil2 Demonstrations
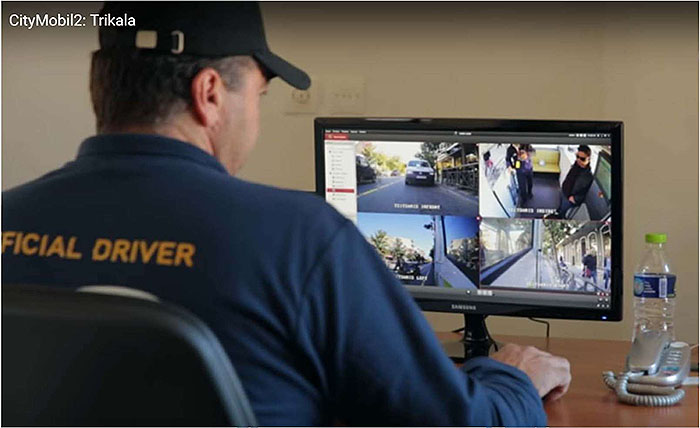
CityMobil2 - Remote monitoring of vehicles
Slide 87:
CityMobil2 Demonstrations
CityMobil2 Demonstrated Feasibility of Automated Transit for First Mile/Last Mile in Mixed Traffic

Slide 88:

Slide 89:
Which of the following was not true of the CityMobil2 demonstrations?
Answer Choices
- The program was funded at about $19.5 million by the European Union
- Two different contractors each built six robotic vehicles
- The vehicles traveled at low speed and carried passengers
- The vehicles required exclusive rights-of-way with no pedestrian or vehicular crossings
Slide 90:
Review of Answers
a) The program was funded at about $19.5 million by the European Union
True.
b) Two different contractors each built six robotic vehicles
True.
c) The vehicles traveled at low speed and carried passengers
True.
d) The vehicles required exclusive rights-of-way with no pedestrian or vehicular crossings
False! Vehicles shared roads with people, bicycles, and cars
Slide 91:
Learning Objective 5
Fundamentals of rail transit system connected/automated operation for transit safety and capacity
Slide 92:

Slide 93:
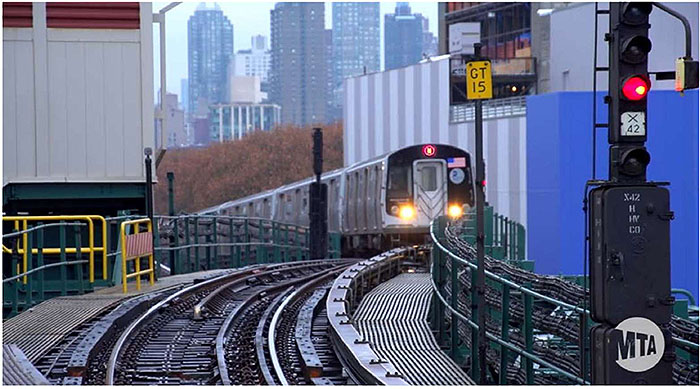
Communications Based Train Control (CBTC)
Case Study - Implementing CBTC at MTA New York City Transit
Slide 94:
Communications Based Train Control (CBTC)
Fixed Block Signaling - most common form of railway signaling for more than a century
- Sections of rails on track are separated by electrical insulators
- Steel train wheels and axles complete an electric circuit through rails as train passes from one section of rail to the next
- Insulated sections of rail are called "blocks"
- Purpose - to insure only one train at a time is in the block
- When train enters block, electricity passes through the track circuit to illuminate signals like traffic lights, telling oncoming trains to stop, slow, or proceed
Slide 95:
Communications Based Train Control (CBTC)
Fixed Block Signaling at New York City Subway - 1930's equipment still in use
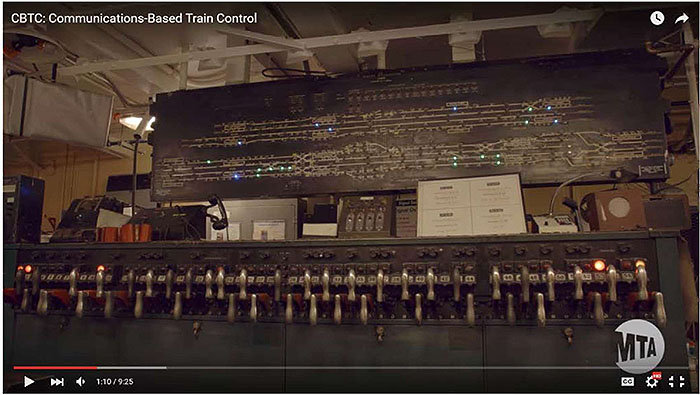
(Extended Text Description: This slide shows an interlocking plant and status board dating from the 1930's in a control tower along a subway line. At the rear is a wide vertical board with horizontal lines representing tracks and small lights showing which sections of track are occupied by trains. Levers in front of the board allow a tower operator to manually operate track switches to switch trains from one route to another.)
Slide 96:
Communications Based Train Control (CBTC)
Moving Block Signaling at New York City Subway
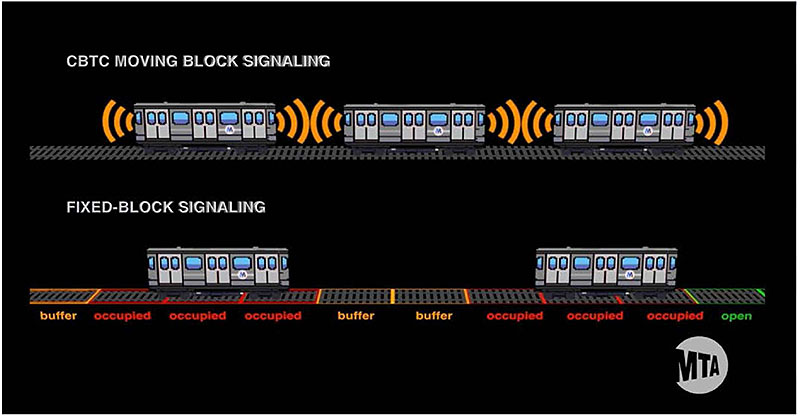
(Extended Text Description: This slide contains two images, one above the other. The bottom image is labeled "FIXED BLOCK SIGNALING" and shows two subway cars on a track divided into sections labeled "occupied" if a subway car is on that section of track, "buffer" if the section is between two subway cars, and "open" if there is no subway car on the track section. The top image is labeled "CBTC MOVING BLOCK SIGNALING" and shows subway cars on track with parallel curved lines representing radio waves emanating from each car. The top image shows three subway cars in the same space as two in the lower image.)
Slide 97:
Communications Based Train Control (CBTC)
Key Elements of a Radio - Based CBTC System Architecture
- Transmits train performance data and continuous train position and speed
- Enables dynamic adjustment of train spacing (virtual block length)
-
Uses three integrated networks:
- Backbone network
- Radio Network
- Train-to-wayside network - on-board radio and trackside radio access points
- Automatic Train Control (ATC) is on-board and wayside, providing speed control and braking
Slide 98:
Communications Based Train Control (CBTC)
IEEE Standards for CBTC
IEEE 1474.1 - worldwide reference technology standard
- 1474.1-2004 - CBTC Performance and Functional Requirements
- 1474.2-2003 - User Interface Requirements in CBTC Systems
- 1474.3-2008 - Recommended Practice for CBTC System Design and Functional Allocations
- 1474.4-2011 - Recommended Practice for Functional Testing of a CBTC System
- IEEE 802.11a/g/p/n - protocol (Wi-Fi/WLAN)
Slide 99:
Communications Based Train Control
Benefits of CBTC for MTA NYCT
Canarsie Line in operation - Flushing Line being installed - Queens Blvd Line next
- Allows more trains per hour, increasing passenger capacity
- Provides more reliable service; more efficient use of its track and car fleet
- Allows system to recover quickly from delays and restore consistent wait times
- Keeps signaling system in state of good repair, enhances safety
- Can program not-to-exceed speed in work zone, improving track worker safety
- Can provide real-time travel information to customers
- Canarsie Line ridership up 27 % since CBTC installed in 2007
Slide 100:
Commuter Rail - Positive Train Control (PTC)
Commuter Rail and Positive Train Control
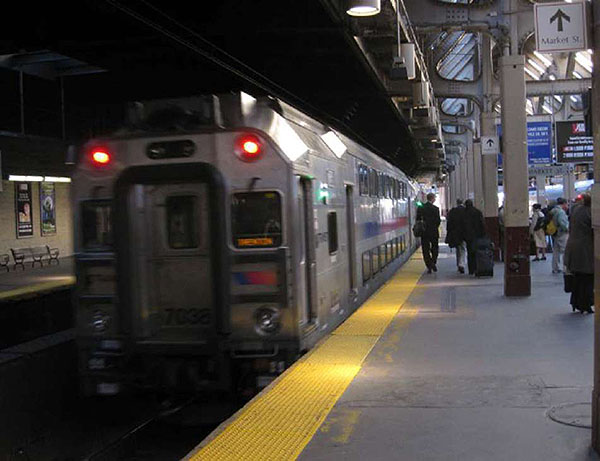
2014 U.S. Commuter Rail Operations
- 23 authorities reporting service
- 3,891 vehicles
- 178,640,234 revenue miles
- 275,663,405 passenger trips
Commuter rail operates over track shared with Amtrak and freight railroads, often mixing with freight trains
Slide 101:
Commuter Rail - Positive Train Control
(PTC)
What is Positive Train Control?
"Positive train control" (PTC) describes technologies designed to automatically stop a train before certain accidents caused by human error occur."
PTC mandated by Congress must be designed to prevent
- Train-to-train collisions
- Derailments from excessive speed
- Unauthorized incursions by trains onto track with maintenance activities
- Movement of a train through a track switch left in the wrong position
PTC systems supplement rather than replace existing train control systems
Slide 102:
Commuter Rail - Positive Train Control (PTC)
Regulatory History of PTC - Rail Safety Improvement Act of 2008
Chatsworth, CA Sept. 12, 2008
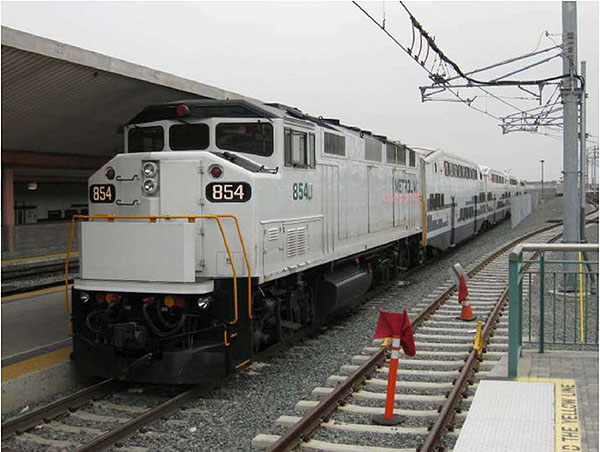
Metrolink train collision with Union Pacific freight train
- 25 killed
- 102 injured
- $12 million in damage
Cause: Metrolink engineer was texting on his phone
Congress: Install PTC by
- Dec. 31, 2015
- Deadline extended to Dec. 31, 2018
Slide 103:
Commuter Rail - Positive Train Control (PTC)
PTC Operation
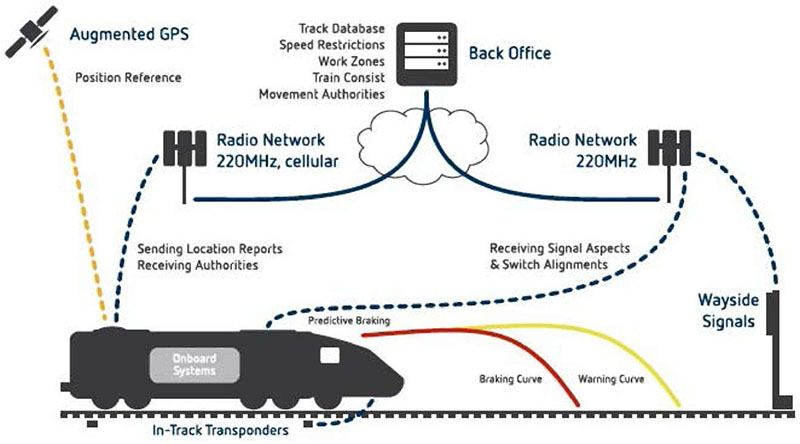
(Extended Text Description: This slide shows a diagram of PTC operation. A locomotive is shown with a label "onboard systems" on a track with labels "In-Track Transponders" and "Wayside Signals." These are all connected by dashed lines representing wireless communications. The locomotive also has a dashed line to an image of a satellite labeled "Augmented GPS" and "Position Reference." Dashed lines also connect the locomotive to symbols representing antenna arrays labeled "Radio Network 220 MHz." Solid lines representing wire/fiber optic communications connect the antenna arrays to a cloud image and a symbol labeled "Back Office.")
Slide 104:
Commuter Rail - Positive Train Control (PTC)
PTC Architecture
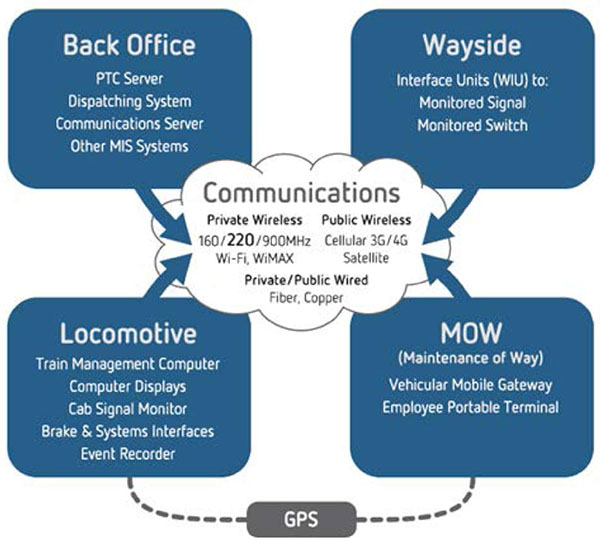
(Extended Text Description: This slide shows four boxes in a square labeled from top left clockwise: Back Office, Wayside, MOW (Maintenance of Way), and Locomotive. At the center of the square overlapping the boxes is a cloud labeled "Communications." Additional text in each box is as follows: Back Office - PTC Server, Dispatching System, Communications Server, Other MIS Systems. Wayside - Interface Units (WlU) to: Monitored Signal, Monitored Switch. Locomotive - Tram Management Computer, Computer Displays, Cab Signal Monitor, Brake & Systems Interfaces, Evert Recorder. MOW - (Maintenance of Way) - Vehicular Mobile Gateway, Employee Portable Terminal. Communications - Private Wireless - 160/220/900MHz Wi-Fi, WiMAX - Public Wireless - Cellular 3G/4G, Satellite - Private/Public Wired - Fiber, Copper - GPS.)
Two major technical architectures
Amtrak NEC - Advanced Civil Speed Enforcement System (ACSES)
ITC - Interoperable Electronic Train Management System (I-ETMS)
Slide 105:
Commuter Rail - Positive Train Control (PTC)
Tasks to Complete PTC - Estimated Price Tag - $13 Billion
- Physical survey and geo-mapping for 82,000+ track-miles
- Geo-mapping - 460,000 field assets (mileposts, curves, grade crossings, switches, signals, etc.)
- Installing PTC and new radios on 22,000+ locomotives
- Installing 32,600 "wayside interface units" (WIU) and new radios for connecting locomotives, train dispatching office, signal, and switch locations
- Installing PTC technology on 2,600+ switches in non-signaled territory and signal replacement projects at 15,100 locations
- Developing and deploying a new radio system at approximately 4,000 base stations
- Developing back office systems and upgrading dispatching software
Slide 106:
Commuter Rail - Positive Train Control (PTC)
Standards for PTC
- Unlike most other ITS standards, standards for PTC are based on Federal Law. The Rail Safety Improvement Act (RSIA) of 2008 mandated the Federal Railroad Administration of the U.S. Department of Transportation issue rules for PTC
-
RSIA key technical mandates:
- All PTC systems must be interoperable - any railroad's locomotive can operate on any other railroad's track using the same signaling and control systems.
-
Core objectives defining that PTC system must prevent:
- Train-to-train collisions
- Over-speed derailments
- Incursions into established work zone limits
Slide 107:
Commuter Rail - Positive Train Control (PTC)
FRA Standards for PTC -extensive detail in rulemaking

Subpart I�Positive Train Control Systems
Sec.
236.1001 Purpose and scope.
236.1003 Definitions.
236.1005 Requirements for Positive Train Control systems.
236.1006 Equipping locomotives operating in PTC territory.
236.1007 Additional requirements for high speed service.
236.1009 Procedural requirements.
236.1011 PTC Implementation Plan content requirements.
236.1013 PTC Development Plan and Notice of Product Intent content requirements and Type Approval.
236.1015 PTC Safety Plan content requirements and PTC System Certification.
236.1017 Independent third party Verification and Validation.
236.1019 Main line track exceptions.
236.1021 Discontinuances, material modifications, and amendments.
236.1023 Errors and malfunctions.
236.1025 [Reserved]
236.1027 PTC system exclusions.
236.1029 PTC system use and en route failures.
236.1031 Previously approved PTC systems.
236.1033 Communications and security requirements.
236.1035 Field testing requirements.
236.1037 Records retention.
236.1039 Operations and Maintenance Manual.
236.1041 Training and qualification program, general.
236.1043 Task analysis and basic requirements.
236.1045 Training specific to office control personnel.
236.1047 Training specific to locomotive engineers and other operating personnel.
236.1049 Training
Slide 108:
Commuter Rail - Positive Train Control
(PTC)
Association of American Railroads (AAR) Standards for PTC - Manual of Standards and Recommended Practices Section K
- Part I - Railway Electronics System Architecture and Concepts of Operations (9000 Series)
- Part II - Locomotive Electronics and Train Consist System Architecture (9100 Series)
- Part III - Wayside Electronics and Mobile Worker Communications (9200 Series)
- Part IV -Office Architecture and Railroad Electronics Messaging (9300 Series)
- Part V - Electronics Environmental Requirements and System Management (9400 Series)
- Part VI - Railway Data Management and Communications (9500 Series)
Slide 109:

Slide 110:
Question
Which of the following statements is true?
Answer Choices
- Positive Train Control standards are voluntary.
- All Communications Based Train Control Systems must be interoperable.
- Communications Based Train Control Systems allow only one train in a fixed block at a time.
- Positive Train Control systems and Communications Based Train Control systems can be overlaid on existing fixed block signal systems.
Slide 111:
Review of Answers
a) Positive Train Control standards are voluntary.
False. PTC standards are mandated by FRA rule-making
b) All Communications Based Train Control Systems must be interoperable
False. PTC interoperates across all railroads, but not CBTC
c) Communications Based Train Control Systems allow only one train in a fixed block at a time
False. CBTC systems do not use fixed blocks
d) Positive Train Control systems and Communications Based Train Control systems can be overlaid on existing fixed block signal systems.
Correct! PTC and CBTC can be installed as overlays
Slide 112:
Module Summary
What We Have Learned
- The relationships between connected vehicle and automated transit vehicle functionality, including terminology, and which SDOs are active in the CV/AV space.
- The potential to improve safety, access, and capacity by using automated guidance for operation on shoulders, for docking at platforms, and for bus platooning.
- That development of automated collision avoidance technologies for buses and paratransit vehicles can improve operational safety and can save lives, reduce injuries, and reduce costs by avoiding collisions and braking autonomously.
- How the European CityMobil2 demonstrations showed the potential for automated transit vehicles to provide first mile/last mile serve in mixed traffic with pedestrians, bicyclists, and autos.
- That Positive Train Control systems and Communications Based Train Control systems can improve safety, capacity and system reliability through automation and connectivity.
Slide 113:
Thank you for completing this module. Feedback
Please use the Feedback link below to provide us with your thoughts and comments about the value of the training.
Thank you