ITS Transit Standards Professional Capacity Building Program
Module 19: On-Board Transit Management Systems
HTML of the PowerPoint Presentation
(Note: This document has been converted from a PowerPoint presentation to 508-compliant HTML. The formatting has been adjusted for 508 compliance, but all the original text content is included, plus additional text descriptions for the images, photos and/or diagrams have been provided below.)
Slide 1:
(Extended Text Description: Welcome - Graphic image of introductory slide. A large dark blue rectangle with a wide, light grid pattern at the top half and bands of dark and lighter blue bands below. There is a white square ITS logo box with words "Standards ITS Training - Transit" in green and blue on the middle left side. The word "Welcome" in white is to the right of the logo. Under the logo box is the logo for the U.S. Department of Transportation, Office of the Assistant Secretary for Research and Technology.)
Slide 2:
Module 19:
On-Board Transit Management Systems
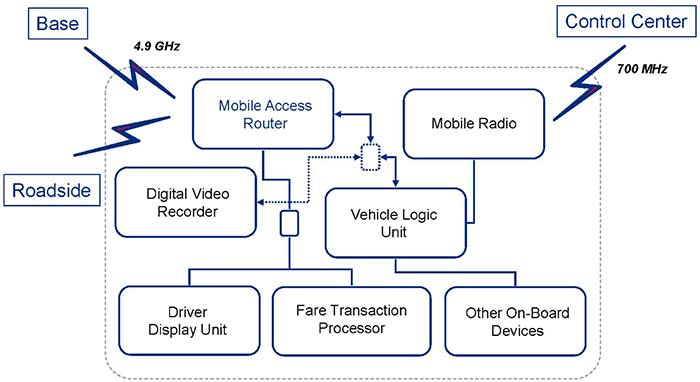
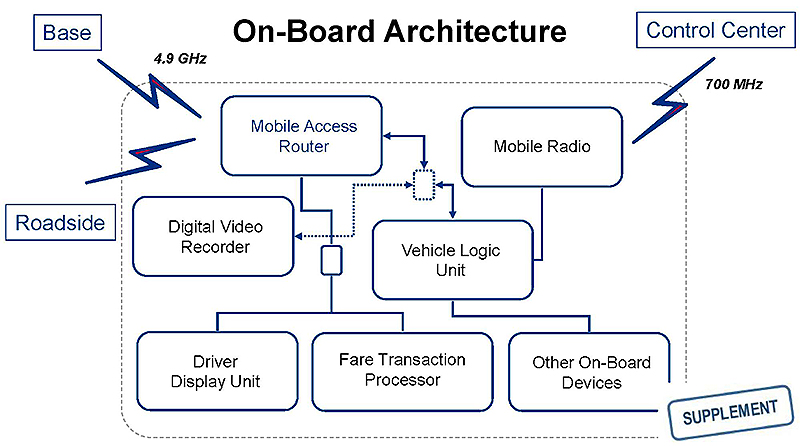
(Extended Text Description: This slide, entitled "Module 19: On-Board Transit Management Systems" has a graphic showing boxes, each containing an on-board component, that are connected via either lines or lightning bolts. In the upper-left hand part of the graphic is a box labeled "Base" connected via a lightning bolt to a box labeled "Mobile Access Router" which is located in the upper-left hand part of the center of the graphic. In the center-left hand part of the graphic is a box labeled "Roadside" connected via a lightning bolt to the "Mobile Access Router" box. In the upper-right hand part of the graphic is a box labeled "Control Center" which is connected via a lightning bolt that is labeled "700 MHz" to a box labeled "Mobile Radio." The Mobile Radio box is located in the upper-right hand part of the center of the graphic, and is connected via a line to a box labeled "Vehicle Logic Unit" that is below the Mobile Radio box. The Vehicle Logic Unit is connected via a line to a box labeled "Other On-Board Devices." The Other On-Board Devices box is located below the Vehicle Logic Unit box. To the left of the Other On-Board Devices box is a box labeled "Fare Transaction Processor." These two boxes are not connected. To the left of the Fare Transaction Processor box is a box labeled "Driver Display Unit." There is a small box located above the Driver Display Unit and Fare Transaction Processor boxes. The Driver Display Unit is connected to the small box with a line, as is the Fare Transaction Processor box. This small box is connected to the Mobile Access Router box with a line. There is a small dashed box located above the Vehicle Logic Unit box, and it is connected to the Vehicle Logic Unity box via a line that has arrows at both ends. This small box is connected to the Mobile Access Router box via a line that has arrows at both ends. Finally this small box is connected to a box labeled "Digital Video Recorder" via a dashed line that has arrows at both ends.)
Slide 3:
Instructor

Carol L. Schweiger
President
Schweiger Consulting LLC
Slide 4:
Learning Objectives
- Review key concepts from Module 5 Transit Management Standards, Part 2 of 2
- Describe how to use the most prevalent standards for On-board Transit Management systems for buses
- Illustrate how to procure systems using the most prevalent transit on-board management standards
Slide 5:
Learning Objective 1
Review Key Concepts from Module 5 Transit Management Standards, Part 2 of 2
Slide 6:
Structure and Use of Data Exchange Standards
Standards Facilitate Meeting User Needs
-
User need:
- Requirement for system to solve user problem
- Part of systems engineering process (SEP)
- FTA National ITS Architecture Policy includes identification of applicable ITS standards
- May be satisfied by using standards
-
Standards being used to meet user needs:
- Users may not need customized solutions
- Data exchanges facilitated among applications and entities
- Can choose most suitable and cost-effective applications, knowing they use common standards

Slide 7:
Structure and Use of Data Exchange Standards
Standards Facilitate Meeting User Needs (continued)
-
Benefits from using standards:
- Reduce complexity and cost in design, procurement, development and management
- Ensure wider choice of suppliers
- Certain types of standards strategic to economic performance
Slide 8:
Structure and Use of Data Exchange Standards
Standards Facilitate Meeting User Needs: Value
-
Protection of investment:
- Modularization and incremental deployment
- Choice of suppliers
- Reuse
-
Interoperability:
- Roadmap for evolution
- Data management
-
Improved quality and value:
- Risk reduction
- Better abstraction
- Better testing
- Process and tool support
- Modularization
- Reuse
Slide 9:
Structure and Use of Data Exchange Standards
- Open System Interconnection (OSI)
- International Organization for Standardization (a.k.a. ISO) standard for worldwide communications that defines networking framework for implementing standards/protocols in seven layers
-
7 Layers:
- Application
- Presentation
- Session
- Transport
- Network
- Data Link
- Physical

Slide 10:
Structure and Use of Data Exchange Standards
OSI 7 Layer Model: Layers 7, 6 and 5
| Layer | Application/Example |
|---|---|
| 7. Application. Serves as the window for users and application processes to access the network services | End user layer (Program that opens what was sent or creates what is to be sent) |
| 6. Presentation. Formats the data to be presented to the Application layer. It can be viewed as the "Translator" for the network | Syntax layer (encrypt and decrypt if needed) |
| 5. Session. Allows session establishment between processes running on different stations | Sync and send to ports (logical ports) |
Slide 11:
Structure and Use of Data Exchange Standards
OSI 7 Layer Model: Layers 4, 3, 2 and 1
| Layer | Application/Example |
|---|---|
| 4. Transport. Ensures that messages are delivered error-free, in sequence and with no losses and duplication | Transmission Control Protocol -TCP (host to host, flow control) |
| 3. Network. Controls the operations of the subnet, deciding the physical path the data takes | Packets ("letter," contains IP address) |
| 2. Data Link. Provides error-free transfer of data frames from one node to another over the Physical layer | Frames ("envelopes," contains MAC address) |
| 1. Physical. Concerned with transmission and reception of raw bit stream over physical medium | Physical structure (cables, hubs, etc.) |
Slide 12:
Structure and Use of Data Exchange Standards
SAE J1708/J1587
- Facilitates vehicle area network (VAN)
-
Only describes two lowest layers
- Physical
- Data Link
-
Used in conjunction with SAE J1587, which:
- Is an application layer
- Defines format of J1708 messages sent between microprocessors devices in transit vehicles
- Supports communication with external devices connected to VAN
- J1708 message consists of Message Identification (MID) character, data bytes and checksum
Slide 13:
Structure and Use of Data Exchange Standards
SAE J1939
-
High speed ISO 11898-1 Controller Area Network (CAN) based communications network:
- Simple information exchanges and diagnostic data exchanges between components physically distributed throughout vehicle
- Allows components associated with different manufacturers to communicate with each other
- Successor to SAE J1708/J1587 low speed networks -earlier standards provided simple information exchange between on-board components
-
Every J1939 message uses identifier that defines:
- Message priority
- From whom it was sent
- Data that is contained within it
Slide 14:
Structure and Use of Data Exchange Standards
SAE J1939 (continued)
- Layer 1 (physical layer) - electric interface with physical medium
- Layer 2 (data link layer) - data communication via Controller Area Network (CAN) (ISO standard-ISO 11898 for serial data communication) based on CAN 2.0B
- Layer 3 (network layer) - functionality of bridge for transmission of messages between two network segments
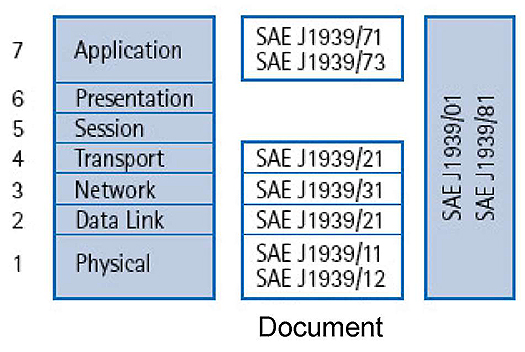
(Extended Text Description: To the right of the bullets on this slide, there is a diagram that describes the layers of SAE J1939. This diagram consists of three columns. The first column has seven rows. The top cell in this column is labeled "Application," representing Layer 7. The cell below it is labeled "Presentation," representing Layer 6. The cell below it is labeled "Session," representing Layer 5. The cell below it is labeled "Transport," representing Layer 4. The cell below it is labeled "Network," representing Layer 3. The cell below it is labeled "Data Link," representing Layer 2. The cell below it is labeled "Physical," representing Layer 1. The second column shows the number of the SAE J1939 document that corresponds to each Layer. The cell next to Layer 7, "Application" is labeled "SAE J1939/71" and "SAE J1939/73." The next cell below it, corresponding to Layer 6, is blank. The next cell below it, corresponding to Layer 5, is blank. The next cell below it, corresponding to Layer 4, is labeled "SAE J1939/21." The next cell below it, corresponding to Layer 3, is labeled "SAE J1939/31." The next cell below it, corresponding to Layer 2, is labeled "SAE J1939/21." The next cell below it, corresponding to Layer 1, is labeled "SAE J1939/11" and "SAE J1939/12." The third column has only one row that spans all of the rows in the first column. In that column, it says "SAE J1939/01 and SAE J1939/81.")
Slide 15:
Structure and Use of Data Exchange Standards
SAE J1939 (continued)
- Layer 4 (transport layer) - various network services for message request mode, acknowledged transmission, and fragmented transmission of large data blocks
-
Layer 7 (application layer):
- Actual data (parameters or network variables with value range, resolution, physical unit and the type of transmission)
- Each message unambiguously referenced by parameter group number
- Network management - automatic allocation or determination of node addresses (plug and play principle)
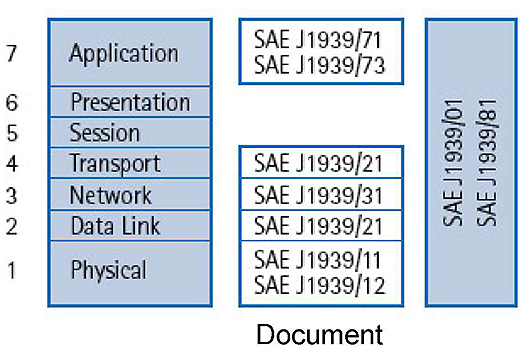
(Extended Text Description: To the right of the bullets on this slide, there is a diagram that describes the layers of SAE J1939. This diagram consists of three columns. The first column has seven rows. The top cell in this column is labeled "Application," representing Layer 7. The cell below it is labeled "Presentation," representing Layer 6. The cell below it is labeled "Session," representing Layer 5. The cell below it is labeled "Transport," representing Layer 4. The cell below it is labeled "Network," representing Layer 3. The cell below it is labeled "Data Link," representing Layer 2. The cell below it is labeled "Physical," representing Layer 1. The second column shows the number of the SAE J1939 document that corresponds to each Layer. The cell next to Layer 7, "Application" is labeled "SAE J1939/71" and "SAE J1939/73." The next cell below it, corresponding to Layer 6, is blank. The next cell below it, corresponding to Layer 5, is blank. The next cell below it, corresponding to Layer 4, is labeled "SAE J1939/21." The next cell below it, corresponding to Layer 3, is labeled "SAE J1939/31." The next cell below it, corresponding to Layer 2, is labeled "SAE J1939/21." The next cell below it, corresponding to Layer 1, is labeled "SAE J1939/11" and "SAE J1939/12." The third column has only one row that spans all of the rows in the first column. In that column, it says "SAE J1939/01 and SAE J1939/81.")
Slide 16:
ITS Standards for Data Exchange Among Transit Management Systems
Center-to-Field (C2F) Application Area Capabilities Related to Transit
- Interface between transit management center and specific type of infrastructure: dynamic message signs (DMS) and transit signal priority (TSP)
-
DMS:
- Information to travelers
- May use various technologies to display messages using any combination of characters
-
TSP:
- Intersection control through local traffic signal controller
- Interface between traffic management center and on-street master controller
- Based on analysis of transit vehicle’s conditions and traffic characteristics for a given time and type of day
- Center invokes appropriate pre-configured traffic signal control system timing plan
Slide 17:
ITS Standards for Data Exchange Among Transit Management Systems
Center-to-Vehicle/Traveler (C2V) Application Area Capabilities Related to Transit: Vehicle
Interface between transit management center and transit or paratransit vehicles
- Collecting automated vehicle location information
- Collecting operational and maintenance data
- Providing transit vehicle driver with electronic dispatch and routing instructions
- Providing traveler information to vehicle
- Providing schedule information used to develop corrective actions onboard
- Providing fare management information, including invalid traveler credit identities, to transit vehicles
- Supporting transit vehicle operator authentication and ability to remotely disable vehicle in emergency situations
Slide 18:
ITS Standards for Data Exchange Among Transit Management Systems
Center-to-Vehicle/Traveler (C2V) Application Area Capabilities Related to Transit: Traveler
Interfaces between traveler information providers and devices used by traveling public
- General traveler information, including traffic information, transit information (fares, real-time schedules, and transactions), incident information, event information, and parking information
- Emergency traveler information , including alerts and advisories, and evacuation information
- Traveler services information (e.g., dining, lodging, etc.)
- Trip planning, using various modes of surface transportation and route options
- Route guidance
Slide 19:
ITS Standards for Data Exchange Among Transit Management Systems
Center-to-Center (C2C) Application Area Capabilities Related to Transit
- Multimodal coordination between transit agencies and other public transportation modes
- Transit incident information, schedules, fare and pricing information
- Transit information suitable for media use
- Emergency transit schedule information to other operations centers
- Transit system information to traffic management centers
- Personalized transit routes requested by travelers
- Financial institution approval and status of electronic fare payments
- Law enforcement regarding the notification of violations
Slide 20:

Slide 21:
ITS Standards for Data Exchange Among Transit Management Systems
Case Study for C2V Flows: Chattanooga Area Regional Transportation Authority (CARTA)
- 66 vehicles operating in max. service and 10,040,856 annual passenger miles
-
Required multiplex system on all buses purchased:
- System connected to SAE J1939 data bus
- Monitor common engine, transmission, and braking faults transmitted on data bus (e.g., high engine oil temperature, low oil pressure, high transmission oil temperature)
- Log data for later retrieval
- Main purpose was for integration with other planned in-vehicle equipment
- Implemented daily upload of bus diagnostic information collected onboard to Automatic Vehicle Monitoring server, making data available to maintenance staff

Slide 22:
ITS Standards for Data Exchange Among Transit Management Systems
Case Study for C2V Flows: CARTA AVM
-
Selection of standard(s) to incorporate in functional specifications for AVM system based on:
- Availability
- Applicability
- Maturity
- Vendors’ use/acceptance
-
Incorporated into specifications in appropriate location:
- On-board Device Alarms Reporting
- Automatic Vehicle Monitoring: On-board System
- Student Supplement contains specification language
Slide 23:
Apply Standards to Development of Procurement Specifications
Read a Standard
-
Transit Management standards not structured the same way:
- SAE J1939 based on OSI layers
- GTFS is a series of comma-delimited text files
- GTFS-realtime format based on Protocol Buffers
- TransXChange (UK standard) is XML format
-
Need to understand enough to:
- Identify appropriate standard(s) based on aforementioned criteria
- Define use of standard(s) in functional requirements/specifications
- Define how compliance with standard(s) can be tested
Slide 24:
Apply Standards to Development of Procurement Specifications
Read a Standard: SAE J1939
| Core J1939 Standards | |
| J1939 | Recommended Practice for a Serial Control and Communications Vehicle Network |
| J1939-01 | Recommended Practice for Control And Communications Network for On-Highway Equipment |
| J1939-02. | Agricultural and Forestry Off-Road Machinery Control and Communication Network |
| J1939-03 | On Board Diagnostics Implementation Guide |
| J1939-05 | Marine Stern Drive and Inboard Spark-Ignition Engine On-Board Diagnostics Implementation Guide |
| J1939-11 | Physical Layer - 250k bits/s, Twisted Shielded Pair |
| J1939-13 | Off-Board Diagnostic Connector |
| J1939-15 | Reduced Physical Layer, 2E0K bits/sec, Un-Shielded Twisted Pair (UTP) |
| J1939-2.1 | Data Link Layer |
| J1939-31 | Network Layer |
| J1939-71 | Vehicle Application Layer |
| J1939-73 | Application Layer - Diagnostics |
| J1939-74 | Application - Configurable Messaging |
| J1939-75 | Application Layer - Generator Sets and Industrial |
| J1939-B1 | Network Management |
| J1939-BZ | Compliance - Truck and Bus |
| J1939-B4 | OBD Communications Compliance Test Cases for Heavy Duty Components and Vehicles |
Slide 25:
Apply Standards to Development of Procurement Specifications
Read a Standard: SAE J1939 (continued)
- Most messages intended to be broadcast
-
Data transmitted on the network without specific destination:
- Permits any device to use data without requiring additional request messages
- Allows future software revisions to easily accommodate new devices
- When message must be directed to particular device, specific destination address included within message identifier
Slide 26:
Apply Standards to Development of Procurement Specifications
Incorporate a Standard into a Specification for Procuring a Transit Management System
- Discussion of Concept of Operations (ConOps)
- Components/devices you expect to be supplied in system
- Functions to be supported, value ranges and optional capabilities required
- Detailed listing of requirements
- Language requiring use of standardized dialogs
- Testing program
Slide 27:
Apply Standards to Development of Procurement Specifications
Incorporate a Standard into a Specification
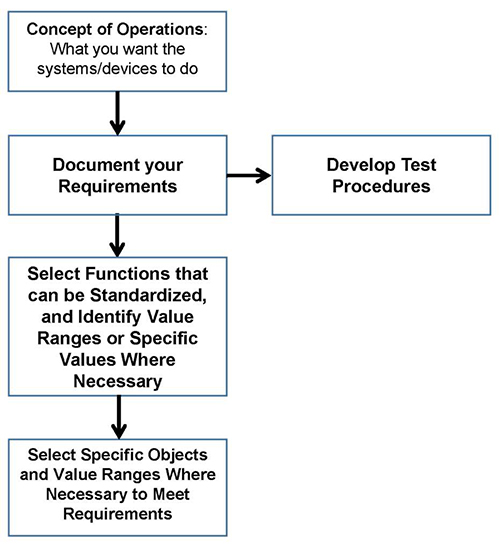
(Extended Text Description: Incorporate a Standard into a Specification for Procuring a Transit Management System: This flowchart indicates the progressive application of the standards. The first box is labeled "Concept of Operations: What you want the systems/devices to do." An arrow points downward toward the next box, which is labeled "Document your Requirements." An arrow points to the right toward the next box, which is labeled "Develop Test Procedures." The box labeled "Document your Requirements" is connected to a box below it with a down-pointing arrow. This box below is labeled "Select Functions that can be Standardized, and Identify Value Ranges or Specific Values Where Necessary." An arrow points downward to the next box, which is labeled "Select Specific Objects and Value Ranges Where Necessary to Meet Requirements.")
Slide 28:

Slide 29:
Question
Which one of these is not a layer within Open System Interconnection (OSI) model?
Answer Choices
- Application
- Data
- Service
- Physical
Slide 30:
Review of Answers
 a) Application
Incorrect. This is Layer 7 within the OSI model.
b) Data
Incorrect. This is a Layer 2 within the OSI model.
 c) Service
Correct! This is not a layer within the Open System Interconnection (OSI) model.
d) Physical
Incorrect. This is a Layer 1 within the OSI model.
Slide 31:
Learning Objective 2
Describe the details and how to use the most prevalent standards for On-board Transit Management systems for buses
Slide 32:
Contents and Use of SAE J1587
Define and Describe the Purpose of J1587
- Defines messages transmitted on SAE J1708 network
- Specifies transport, network and application layers
- Outdated and being replaced by J1939
- Defines format of messages and data being communicated between on-board microprocessors
- Promotes software compatibility among microcomputer based modules
-
Used with SAE J1708, which:
- Defines requirements for hardware and basic protocol needed to implement J1587
- Specifies data link and physical layers
Slide 33:
Contents and Use of SAE J1587
Describe the J1587 Message Format
-
Format:
- Message identifier (MID) - source address of transmitting node
- One or More Parameters
- Checksum
- Messages start with MID indicating source address of transmitting node
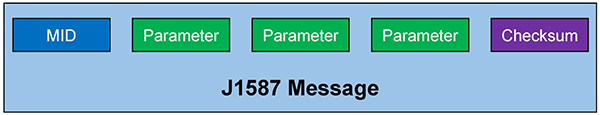
(Extended Text Description: There is one rectangular box labeled "J1587 Message" with five smaller boxes inside. The first inside box on the far left-hand side is labeled "MID." The small box to the right of this box is labeled "Parameter." The small box to the right of this box is labeled "Parameter." The small box to the right of this box is labeled "Parameter." The small box to the right of this box is labeled "Checksum.")
Slide 34:
Contents and Use of SAE J1587
J1587 Example
- J1587 specifies a parameter for Battery Voltage
- MID is 128, which means Engine #1
- Battery Voltage is PID 158
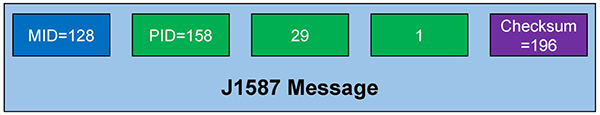
(Extended Text Description: There is one rectangular box labeled "J1587 Message" with five smaller boxes inside. The first inside box on the far left-hand side is labeled "MID=128." The small box to the right of this box is labeled "PID=158." The small box to the right of this box is labeled "29." The small box to the right of this box is labeled "1." The small box to the right of this box is labeled "Checksum=196.")
Slide 35:
Contents and Use of SAE J1587
Use of SAE J1587
-
J1587 is outdated, but is often found in legacy systems
- Vehicle and component information
- Routing and scheduling information
- Driver information relating to driver activity
- SAE J1708, defining basic hardware and conditions required for on-board data exchange
- With J1708 backbone in place, J1587 added for general on-board information sharing and diagnostic functions
- Whenever J1587 mentioned, assume that J1708 is included
- Thus, use of J1587 and J1708 described together
Slide 36:
Contents and Use of SAE J1708
Define and Describe the Purpose of J1708
- Addresses transmission of electronic signals and information among bus components
- Identifies minimum hardware and procedural requirements for routing messages over network
-
Establishes method for determining:
- Which device is communicating (i.e., engine, fare box, etc.)
- Length of time that each device is allowed to communicate
- Which device has priority in accessing network when two try to gain access simultaneously
- That message was received correctly should there be problems in transmission
- Describes physical and data link layer
Slide 37:
Contents and Use of SAE J1708
Define and Describe the Purpose of J1708 (cont’d)
- SAE J1587 or J1922, defines actual data or functions to be transmitted. SAE J1708 only defines hardware and basic software
-
Data can be transferred between devices in more cost-effective way:
- Minimizes hardware cost
- Offers flexibility and further expansion of existing system
- Uses standard industry electronics
- Transmission rate 9600 bps
- Message up to 21 bytes long
Slide 38:
Contents and Use of SAE J1708
Describe the J1708 Message Format
- Message consists of MID, data bytes and checksum
- Data content not described in J1708 specification but in overlaying protocol, such as J1587
-
MID is 0-255
- MIDs 0-68 belong to predefined devices to ensure consistency.
- MIDs 69-86 are set aside for J1922 protocol.
- MIDs 87-110 are reserved for future applications.
- MID 111 is designated for factory tests of electronic control units and shall not be used by any on-board unit.
- MIDs 112-127 are not reserved and can be used as wanted.
- MIDs 128-255 are reserved for SAE J1587 protocol.
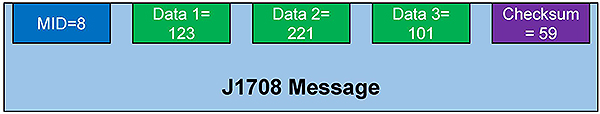
(Extended Text Description: There is a graphic at the bottom of this slide. There is one rectangular box labeled "J1708 Message" with five smaller boxes inside. The first inside box on the far left-hand side is labeled "MID=8." The small box to the right of this box is labeled "Data 1=123." The small box to the right of this box is labeled "Data 2=221." The small box to the right of this box is labeled "Data 3=101." The small box to the right of this box is labeled "Checksum=59.")
Slide 39:
Contents and Use of SAE J1708
Use of SAE J1708
- Exchange information between AVL, VLU, fare collection, radio, passenger information, and other systems
-
Integration examples:
- Passenger information systems with AVL provides automatic next-stop audio and visual announcements
- Fare collection with passenger counters, passenger information systems and AVL identifies passenger trends
- On-board cameras and AVL to store video images on-board for review or send emergency-related images in real time
- Combine health-monitoring capabilities of vital on-board components with AVL to send fault alarms in real time
Slide 40:
Contents and Use of SAE J1708
Use of SAE J1708
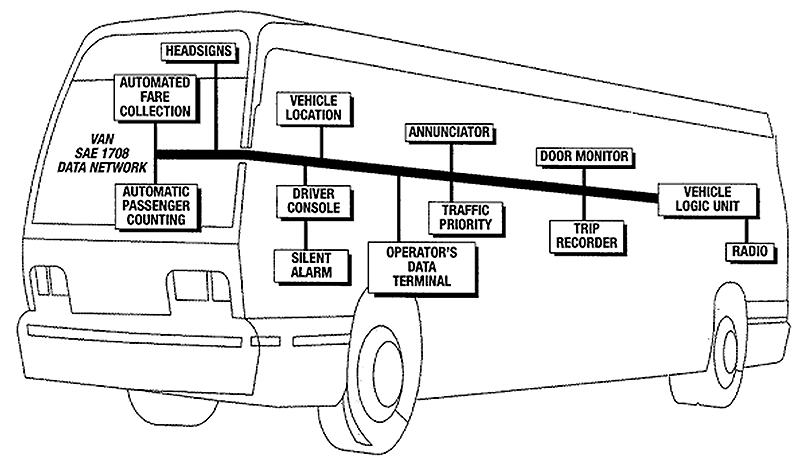
(Extended Text Description: This slide has a graphic of a bus with a diagram inside of it that represents a vehicle area network (VAN) using SAE J1708. The on-board components that are connected to the network, which is represented as a thick line that goes from the driver’s seat to the back of the bus, are from left to right: Automated Fare Collection, Automatic Passenger Counting, Headsigns, Driver Console connected to a Silent Alarm, Vehicle Location, Operator’s Data Terminal, Annunciator, Traffic Priority, Door Monitor, Trip Recorder, Vehicle Logic Unit and Radio.)
Slide 41:
Contents and Use of SAE J1939
Define and Describe the Purpose of J1939
- Defines how information transferred across network to allow Electronic Control Units to communicate information (e.g. vehicle speed)
- 17 J1939 documents - see earlier slide on how to read a standard
- Capable of handling requirements currently satisfied by J1708/J1587/J1922
- Spans all seven OSI layers
- Data rate of 250,000 bits per second, making it much faster than J1708
Slide 42:
Contents and Use of SAE J1939
Define and Describe the Purpose of J1939 (cont’d)
- Permits connection of up to 30 units compared to maximum of 20 for J1708
- Ensures data transmission time fully utilized
-
Most messages defined by J1939 intended to be broadcast
- Data transmitted on network without specific destination
- Permits any device to use data without requiring additional request messages
- Allows future software revisions to easily accommodate new devices
- Uses the 29-bit identifier defined within CAN 2.0B protocol
Slide 43:
Contents and Use of SAE J1939
Define and Describe the Purpose of J1939 (cont’d)
- Defines message timeouts, how large messages are fragmented and reassembled, the network speed, the physical layer, and how applications acquire network addresses
- Defined using collection of individual SAE J1939 documents based on layers of OSI model
- Uses Controller Area Network (CAN) protocol permitting any Electronic Control Units (ECU) to transmit message on network
-
Every message uses an identifier that defines:
- Message priority
- From whom it was sent
- Data that is contained within it
- Collisions are resolved non-destructively as result of arbitration process that occurs while identifier transmitted
Slide 44:
Contents and Use of SAE J1939
Define and Describe the Purpose of J1939 (cont’d)
- J1939 messages built on top of CAN 2.0b - make specific use of extended frames
- First three bits are priority field - sets message’s priority on network and helps ensure messages with higher importance sent/received before lower priority messages. Zero is highest priority
- Next bit reserved for future use - should be set to zero
- Next bit Data Page field used to expand maximum number of possible messages
-
Next eight bits Protocol Data Unit Format (PDU F) field - used to determine if message intended for specific device on network or for entire network
- If value of PDU F < 240, message meant for specific device
- If value is 240 or greater, message intended for all devices
- Next eight bits Protocol Data Unit Specific (PDU S) field - based on value of PDU F field
Slide 45:
Contents and Use of SAE J1939
Define and Describe the Purpose of J1939 (concluded)
- If PDU F intended for specific device, PDU S is address of specific device, PDU S field called Destination Address
- If PDU F intended for all devices, PDU S is Group Extension field used to increase number of possible broadcast messages. Format is called PDU 2
- Last eight bits identify address of device that transmitted current message - Source Address Field
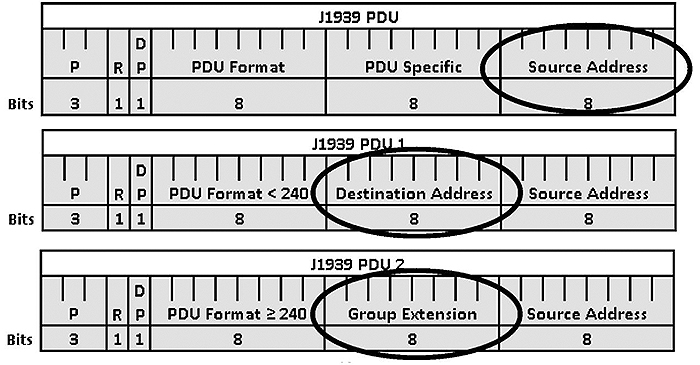
(Extended Text Description: There are three graphics on the bottom of this slide. The first graphic shows a rectangle with three rows of information. The first row is labeled "J1939 PDU." The second row is divided into six columns. The first column (on the far left) is labeled "P." The second column to the right of the first column is labeled "R." The third column to the right of the second column is labeled "DP." The fourth column to the right of the third column is labeled "PDU Format." The fifth column to the right of the fourth column is labeled "PDU Specific." The sixth column to the right of the fifth column is labeled "Source Address." The third row is divided into the same six columns as the second row. Each cell in this corresponds to the cell above it – each cell shows the number of bits of each data element. Going from left to right, the cells are labeled "3" (the number of bits under the label "P"), "1," "1," "8," "8," and "8." There is a circle around the sixth column, rows 2 and 3. The second graphic, which is directly below the first graphic, shows a rectangle with three rows of information. The first row is labeled "J1939 PDU 1." The second row is divided into six columns. The first column (on the far left) is labeled "P." The second column to the right of the first column is labeled "R." The third column to the right of the second column is labeled "DP." The fourth column to the right of the third column is labeled "PDU Format < 240." The fifth column to the right of the fourth column is labeled "Destination Address." The sixth column to the right of the fifth column is labeled "Source Address." The third row is divided into the same six columns as the second row. Each cell in this corresponds to the cell above it – each cell shows the number of bits of each data element. Going from left to right, the cells are labeled "3" (the number of bits under the label "P"), "1," "1," "8," "8," and "8." There is a circle around the fifth column, rows 2 and 3. The third graphic, which is directly below the second graphic, shows a rectangle with three rows of information. The first row is labeled "J1939 PDU 2." The second row is divided into six columns. The first column (on the far left) is labeled "P." The second column to the right of the first column is labeled "R." The third column to the right of the second column is labeled "DP." The fourth column to the right of the third column is labeled "PDU Format ≥ 240." The fifth column to the right of the fourth column is labeled "Group Extension." The sixth column to the right of the fifth column is labeled "Source Address." The third row is divided into the same six columns as the second row. Each cell in this corresponds to the cell above it – each cell shows the number of bits of each data element. Going from left to right, the cells are labeled "3" (the number of bits under the label "P"), "1," "1," "8," "8," and "8." There is a circle around the fifth column, rows 2 and 3.)
Slide 46:
Contents and Use of SAE J1939
J1939 Characteristics
- Extended CAN identifier (29 bit)
- Bit rate 250 Kbit/s
- Peer-to-peer and broadcast communication
- Transport protocols for up to 1785 data bytes
- Network management
- Definition of parameter groups for commercial vehicles and others
- Manufacturer specific parameter groups are supported
- Diagnostics features
Slide 47:
Contents and Use of SAE J1939
J1939 Example
-
Sample of a parameter group definition:
- Name: Engine temperature 1 - ET1
- Transmission rate: 1s
- Data length: 8 bytes
- Extended Data Page 0
- Data page: 0
- PDU format: 254
- PDU specific: 238
- Default priority: 6
- PG Number: 65,262 (00FEEE16)
-
Description of data:
- Byte: 1 Engine Coolant Temperature
- 2 Engine Fuel Temperature 1
- 3,4 Engine Oil Temperature 1
- 5,6 Engine Turbocharger Oil Temperature
- 7 Engine Intercooler Temperature
- 8 Engine Intercooler Thermostat Opening
Slide 48:
Use of Wireless Access Points and Onboard Internet
Use of IEEE 802.11x
- Agencies use wireless access points (WAPs) to upload / download data and perform software updates for vehicles
- Current WAPs use IEEE 802.11ac
- On-board Wi-Fi for passengers uses 802.11x
Slide 49:
Examples of Use of On-board Standards to Provide a Single-point Logon
What is Single-point Logon?
- Computer-aided Dispatch (CAD) allows for single point logon for all on-board systems
- Driver can initiate systems connected to CAD (e.g., AVL, fare box)
- Reduces potential for error
- Where more than one GPS unit on board provides one GPS location and time/date stamp for all systems
- Keeps operational information being used and generated by on-board systems synchronized
Slide 50:
Using Standards to Perform Single-point Logon to On-board Devices
- Capital District Transportation Authority in Albany, NY
-
Intelligent Transportation Management System (ITSM) includes bidirectional interface between fare box and MDT/vLu with single point logon
- Over J1708/1587 network
- Single point logon shall negate need for operators to logon
- Login includes time, date, driver ID no., route, run, trip and/or pattern, real-time vehicle location, and vehicle number, which shall be transferred to the MDT/VLU through bidirectional interface
- Changes made either by driver or remotely by dispatch through MDT will update fare box logon and vice versa
- Operator shall continue to be able to use all fare box operator control unit (OCU) features
Slide 51:
Examples of Use of On-board Standards to Provide a Single-point Logon
Single-point Logon at King County Metro
(Extended Text Description: Examples of Use of On-board Standards to Provide a Single-point Logon. Subtitle is Single-point Logon at King County Metro. This slide is a graphic showing boxes, each containing an on-board component, that are connected via either lines or lightning bolts. In the upper-left hand part of the graphic is a box labeled "Base" connected via a lightning bolt to a box labeled "Mobile Access Router" which is located in the upper-left hand part of the center of the graphic. In the center-left hand part of the graphic is a box labeled "Roadside" connected via a lightning bolt to the "Mobile Access Router" box. In the upper-right hand part of the graphic is a box labeled "Control Center" which is connected via a lightning bolt that is labeled "700 MHz" to a box labeled "Mobile Radio." The Mobile Radio box is located in the upper-right hand part of the center of the graphic, and is connected via a line to a box labeled "Vehicle Logic Unit" that is below the Mobile Radio box. The Vehicle Logic Unit is connected via a line to a box labeled "Other On-Board Devices." The Other On-Board Devices box is located below the Vehicle Logic Unit box. To the left of the Other On-Board Devices box is a box labeled "Fare Transaction Processor." These two boxes are not connected. To the left of the Fare Transaction Processor box is a box labeled "Driver Display Unit." There is a small box located above the Driver Display Unit and Fare Transaction Processor boxes. The Driver Display Unit is connected to the small box with a line, as is the Fare Transaction Processor box. This small box is connected to the Mobile Access Router box with a line. There is a small dashed box located above the Vehicle Logic Unit box, and it is connected to the Vehicle Logic Unity box via a line that has arrows at both ends. This small box is connected to the Mobile Access Router box via a line that has arrows at both ends. Finally this small box is connected to a box labeled "Digital Video Recorder" via a dashed line that has arrows at both ends.)
Slide 52:
Examples of Use of On-board Standards to Provide a Single-point Logon
King County Metro (continued)
-
On-Board Systems (OBS) Project:
- Smart bus concept
- GPS/odometer/gyroscope solution
- Stop announcements
- Next stop electronic displays
- Destination sign integration
- Automatic passenger counting
- Vehicle monitoring
- Installs in progress
Slide 53:
Examples of Use of On-board Standards to Provide a Single-point Logon
-
Business need for integration:
- Single logon for operators
- Automatic fare zone changes
- Space and power constraints
- Maintenance requirements
- Network infrastructure support
- Multiple hardware and software vendors
- Phased implementation
Slide 54:
Use of On-board Standards to Provide a Single-point Logon
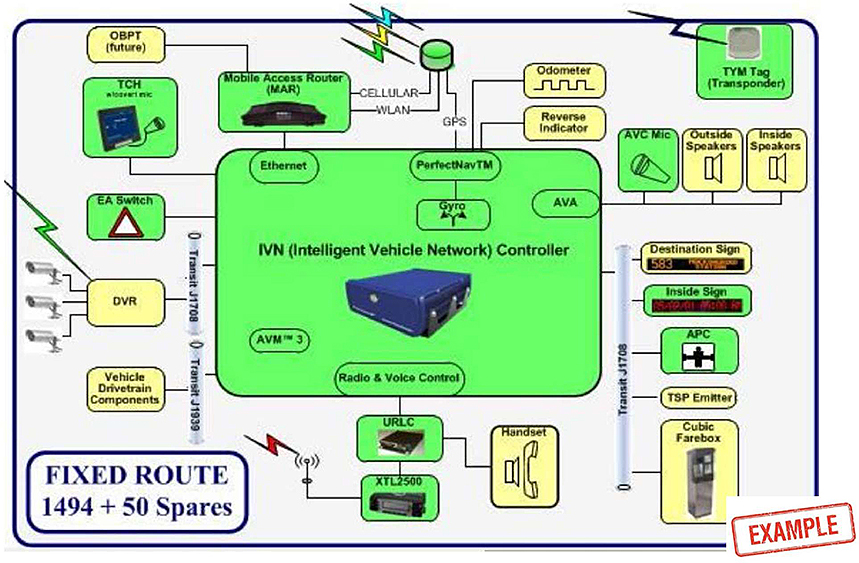
(Extended Text Description: Use of On-board Standards to Provide a Single-point Logon. The center of this diagram has a green box that is labeled "IVN (Intelligent Vehicle Network) Controller." Above this box to the left is another smaller green box labeled "TCH" (which means transit control head). It is connected to the IVN box by a line. To the left of the IVN box is a smaller green box labeled "EA [meaning emergency alarm] Switch." It is connected to the IVN box by a line. Above the IVN box is another green smaller box labeled "Mobile Access Router (MAR)." It is connected to the IVN box by a line. To the right of the Mobile Access Router (MAR) box is a green cylinder that has 3 lightning bolts connected to it. There is one line labeled "CELLULAR" between the green cylinder and MAR box. There is another line labeled "WLAN" between the green cylinder and MAR box. There is another line labeled "GPS" between the green cylinder and an oval inside the IVN box labeled "PerfectNav TM." That oval is connected via a line to another oval within the IVN box labeled "Gyro." Also connected to the PerfectNav TM oval are two yellow boxes outside the IVN box labeled "Odometer" and "Reverse Indicator." Below the IVN box is a smaller green box that is labeled "URLC." It is connected to the IVN box by a line. The URLC box is connected to an oval within the IVN box entitled "Radio and Voice Control." To the right of the URLC box is a yellow box labeled "Handset." Below the URLC box is a green box labeled XTL2500. It is connected to the URLC box by a line. To the left of the XTL2500 box is a lightning bolt connected via a line. The MAR box is connected to an oval within the IVN box labeled Ethernet. Below the EA Switch box is a yellow box labeled "DVR." It is connected to the IVN box with a line. Between the IVN and DVR boxes is a label "Transit J1708." To the left of the DVR box are three cameras connect to the DVR box via a line. Also, there is a lightning bolt coming out of the upper left-hand corner of the DVR box. Below the DVR box is a yellow box labeled "Vehicle Drivetrain Components." It is connected to the IVN box with a line. Between the IVN and Vehicle Drivetrain Components boxes is a label "Transit J1939." The following boxes to the right of the IVN box are connected to the IVN box via a line labeled "Transit J1708:" Destination Sign (yellow), Inside Sign (green), APC (green), TSP Emitter (yellow) and Cubic Farebox (yellow). The following box are connected to an oval labeled "AVA" within the IVN box: AVC Mic (green), Outside Speakers (yellow) and Inside Speakers (yellow). In the upper right-hand corner of the diagram is a green box labeled "TVM Tag (Transponder)." In the lower left-hand corner of the diagram is a rectangle labeled "Fixed Route 1494 + 50 Spares.")
Slide 55:

Slide 56:
Question
Which one of these differences between SAE J1939 and J1708 is NOT true?
Answer Choices
- J1939 is much faster than J1708
- J1939 permits a connection of more devices than J1708
- J1939 is based on the Controller Area Network (CAN)
- J1939 covers the same number of OSI layers as J1708
Slide 57:
Review of Answers
a) J1939 is much faster than J1708
Incorrect. SAE J1939 has a data rate of 250,000 bits per second, making it much faster than J1708
b) J1939 permits a connection of more devices than J1708
Incorrect. SAE J1939 also permits a connection of up to 30 units compared to a maximum of 20 for a J1708 network
c) J1939 is based on the Controller Area Network (CAN)
Incorrect. J1708 is not based on the CAN
d) J1939 covers the same number of OSI layers as J1708
Correct! J1939 covers all 7 layers while J1708 only covers 2
Slide 58:
Learning Objective 3
Illustrate how to procure systems using the most prevalent transit onboard management standards
Slide 59:

Slide 60:
Case Study of Procuring System(s) Using SAE J1708/1587
Norwalk Transit District (NTD) CAD/AVL System
Identify system integration needs: Using vehicle area network (VAN) to connect mobile data terminal (MDT) with:
- Farebox
- Headsign
- Automatic passenger counter (APC) controller
- Digital video recorder (DVR)
- Automatic voice annunciation (AVA) controller
- Interior AVA dynamic message signs (DMS)
-
Optional on-board equipment:
- Transit signal priority (TSP) emitters
- On-board surveillance system
- Maintenance network gateways for vehicle component monitoring
Single-point login
Slide 61:
Case Study of Procuring System(s) Using SAE J1708/1587
NTD CAD/AVL System
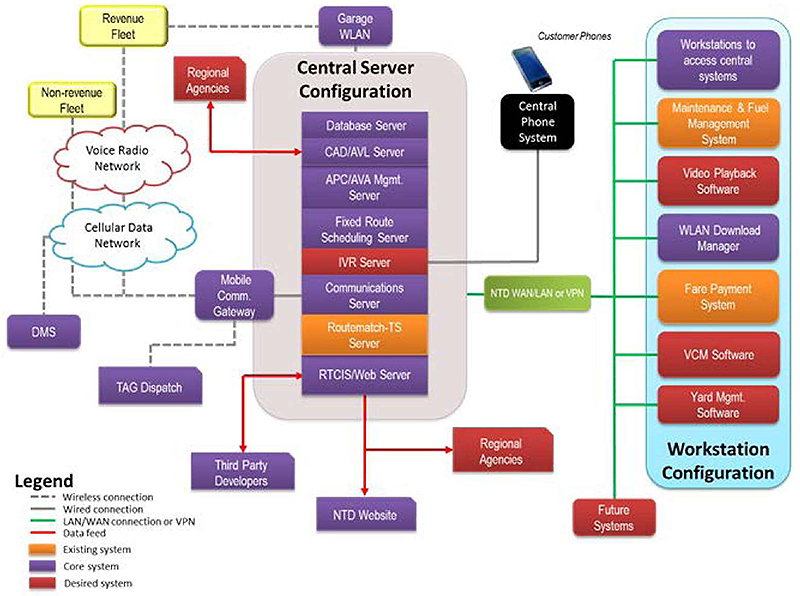
(Extended Text Description: Case Study of Procuring System(s) Using SAE J1708/1587, subtitle NTD CAD/AVL System. This graphic shows the relationships among various NTD Central System Technologies. The orange boxes indicate existing systems, purple boxes indicate core systems that are required in the procurement and the red boxes indicate desired systems that may be added in the future. Beginning in the center of the graphic, there is a rectangular column representing the Central Server Configuration. In this column the following servers are represented in individual blocks from top to bottom: Database Server (purple), CAD/AVL (Computer Aided Dispatch and Automatic Vehicle Location) Server (purple), APC/AVA Mgmt. Server (purple), Fixed Route Scheduling Server (purple), IVR Server (red), Communications Server (purple), Routematch TS Server (orange), and RTCIS/Web Server (purple). From the IVR Server, there is a gray line representing a wired connection that leads to a black box labeled "Central Phone System" with a smart phone icon above it. From the RTCIS/Web Server, a red line representing data feed points connects to a purple box labeled "NTD Website." This red line has an arrow at the NTD Website box. Coming from the left side of the RTCIS/Web Server is another red line connecting to purple box labeled "Third Party Developers." This red line has arrows at both ends. To the right of the line going from the RTCIS/Web Server to the NTD Website is a red box labeled Regional Agencies connected to the line via a red line with an arrow at the Regional Agencies box. From the left side of the Communications Server, there is a dotted gray line that goes to a purple box labeled "Mobile Comm Gateway" and branches upwards through two cloud networks (bottom to top: the Cellular Data Network and Voice Radio Network systems), going on to two separate yellow boxes. These boxes are labeled "Revenue Fleet" and "Non-revenue Fleet." Also, there is a dotted gray line from the Mobile Comm Gateway box and a purple box labeled "TAG Dispatch." From the Cellular Data Network cloud, there is another dotted gray line going downwards representing the wireless connection to the DMS box (purple). From the Revenue Fleet box, is a dotted gray line going to a purple box labeled "Garage WLAN." This box is connected to the top of the entire Central Server Configuration. Coming from the entire Central Server Configuration, there is a solid green line representing the NTD LAN/WAN connection or VPN. This line goes through a light green box labeled "NTD WAN/LAN or VPN" and branches out to a light blue section identified as the "Workstation Configuration." Within the "Workstation Configuration," the following items are represented in individual boxes (top to bottom): Workstations to access control systems (purple), Maintenance and Fiel Management System (orange), Video Playback Software (red), WLAN Download Manager (purple), Fare payment system (orange), VCM Software (red), and Yard Management Software (red). Outside the "Workstation Configuration," the LAN/WAN connection also leads to a red box labeled as "Future Systems.")
Slide 62:
Case Study of Procuring System(s) Using SAE J1708/1587
NTD CAD/AVL On-board Systems
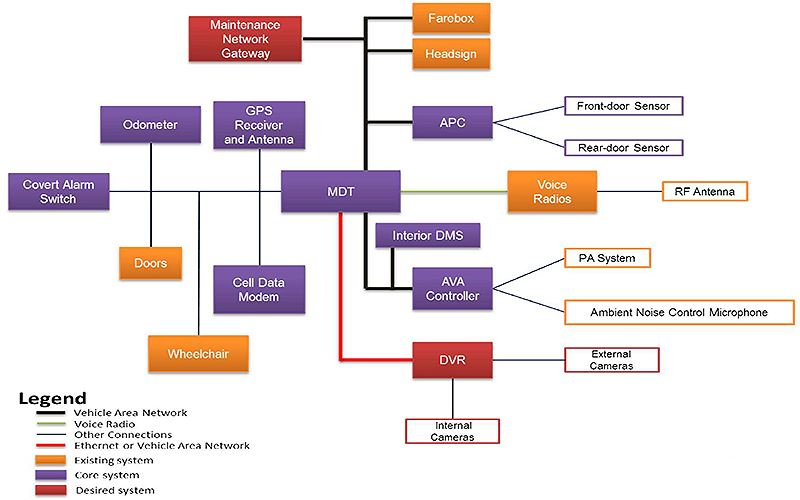
(Extended Text Description: NTD CAD/AVL On-board Systems: This graphic shows an example of the relationships among various ITS technologies onboard an NTD vehicle. The orange boxes show existing systems that are integrated through the use of J1708/J1587. The purple boxes show the required and deployed core systems, and the red boxes show systems that may be deployed in the future. The black lines are connections made using the vehicle area network (VAN) that employs J1708/J1587. In the center of the diagram is a purple box labeled MDT (Mobile Data Terminal). Coming from the top of MDT, is a black line that is connected to a purple box labeled "APC," an orange box labeled "Headsign," an orange box labeled "Farebox" and a red box labeled "Maintenance Network Gateway." To the left of the MDT box is a line connecting to boxes labeled "GPS Receiver and Antenna," (purple) "Odometer," (purple) "Doors," (orange), "Covert Alarm Switch," (purple) "Cell Data Modem," (purple) and "Wheelchair" (orange). The APC is connected to the front-door sensor and rear-door sensor via an alternative link. Connected by another vehicle area network to the MDT are the Interior DMS (purple) and the AVA Controller (purple) via a black line, and the DVR (red) via a red line which indicates an Ethernet connection. The AVA controller is then connected to the PA System and Ambient Noise Control Microphone. The DVR is connected to internal and external cameras.)
Slide 63:
Case Study of Procuring System(s) Using SAE J1708/1587
NTD CAD/AVL Procurement
- Vehicle Area Network (VAN)
- Farebox Integration
- Headsign Integration
- APC Installation/ Integration
- Optional Vehicle Component Monitoring
- Integration with Interior DMS
- Optional Interface with Transit Signal Priority (TSP) Emitter (fixed-route only)
Slide 64:
Case Study of Procuring System(s) Using SAE J1708/1587
Capital District Transportation Authority (CDTA) Intelligent Transportation Management System (ITMS)
- Single-point login
-
SAE J1708/1587 to connect ITMS Vehicle Logic Unit (VLU) with:
- Farebox
- Headsign
- Automatic Passenger Counters (APC) controller
- Global Positioning System (GPS) receiver
- Transit Signal Priority (TSP) emitter
- Digital Video Recorder (DVR)
- Automated Vehicle Announcements (AVA) controller
- Covert alarm
- Vehicle diagnostics interfaces
- Support data transfer to/from Central Data System (CDS)
- P25 radios
- Interior Dynamic Message Signs (DMS) for AVA
Slide 65:
Case Study of Procuring System(s) Using SAE J1708/1587
CDTA ITMS - Interface Control Document (ICD)
-
SPX-Genfare FastFare� Fareboxes integration with ITMS to provide:
- GPS data
- Single login capability across all on-board systems
-
ICD:
- Documents and tracks necessary information to define system’s interface
- Communicates inputs and outputs for all potential actions whether internal to system or transparent
- Created during Planning and Design Phases
- Helps ensure compatibility between system segments and components
Slide 66:
Case Study of Procuring System(s) Using SAE J1708/1587
Potential ICD Contents: Farebox - ITMS Integration
- Scope/Purpose of ICD
- Physical interface
-
J1587 Protocol:
- MID Assignments
- PID Definitions
- Application Protocol
-
Initialization:
- Normal Vehicle Power Up
- MDT/VLU Power Interruption or Reboot
- Farebox Power Interruption or Reboot
Slide 67:
Case Study of Procuring System(s) Using SAE J1708/1587
Potential ICD Contents: Farebox - ITMS Integration
- MDT/VLU Initiated Logon
- Farebox Initiated Logon
- Location Reporting
- Starting a Trip
- Servicing a Stop
- Time Synchronization
- MDT/VLU Initiated Driver Logoff
- Farebox Initiated Driver Logoff
- Error Handling
Slide 68:
Case Study of Procuring System(s) Using SAE J1708/1587
CDTA ITMS - Additional Testing for Integration
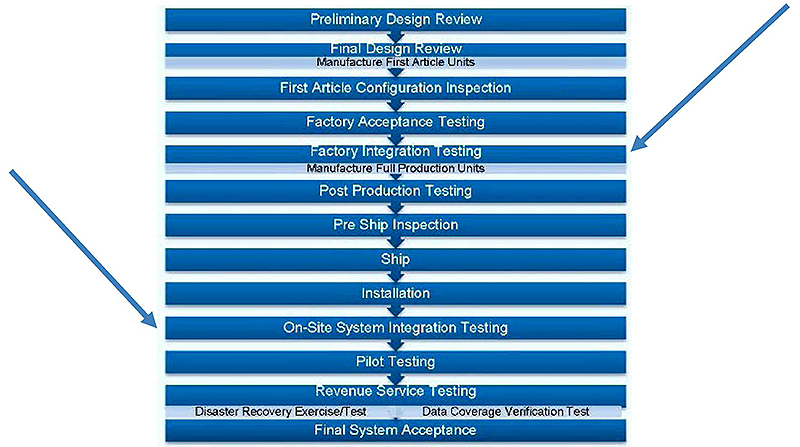
(Extended Text Description: Case Study of Procuring System(s) Using SAE J1708/1587. Subtitle: CDTA ITMS – Additional Testing for Integration. The graphic on this slide shows a sequence of testing phases that will be used by CDTA for their new CAD/AVL system. From top to bottom, the testing phases are as follows: Preliminary Design Review, Final Design Review/ Manufacture First Article Units, First Article Configuration Inspection, Factory Acceptance Testing, Factory Integration Testing/ Manufacture Full Production Units, Post Production Testing, Pre-Ship Inspection, Ship, Installation, On-Site System Integration Testing, Pilot Testing, Revenue Service Testing/ Disaster Recovery Exercise/Test and Data Coverage Verification Test, and Final System Acceptance. A line with an arrow is pointing at the Factory Integration Testing step. A line with an arrow is pointing at the On-Site System Integration Testing.)
Slide 69:
Case Study of Procuring System(s) Using SAE J1939
Ann Arbor Area Transportation Authority (AAATA) CAD/AVL Hardware and Software
-
Vehicle area network (VAN):
- Farebox
- Headsign
- New interior DMS that communicate with automatic voice announcement (AVA) controller
- Automatic passenger counting (APC) controller integrated with the on-board mobile data terminal (MDT)
- MDT to collect codes from Engine Control Module, Transmission Control Module and Automatic Braking System
- Optional DVR
Slide 70:
Case Study of Procuring System(s) Using SAE J1939
AAATA CAD/AVL On-board Systems
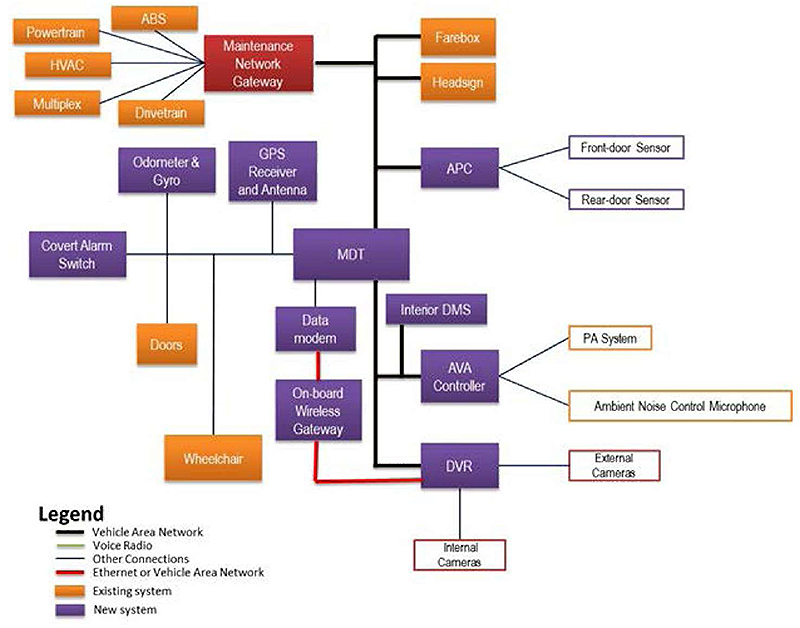
(Extended Text Description: Case Study of Procuring System(s) Using SAE J1939 with subtitle AAATA CAD/AVL On-board Systems. This graphic shows an example of the relationships among various ITS technologies onboard an AAATA vehicle. The orange boxes show existing systems that are integrated through the use of J1708/J1587. The purple boxes show the required and deployed core systems, and the red boxes show systems that may be deployed in the future. The black lines are connections made using the vehicle area network (VAN) that employs J1708/J1587. In the center of the diagram is a purple box labeled MDT (Mobile Data Terminal). Coming from the top of MDT, is a black line that is connected to a purple box labeled "APC," an orange box labeled "Headsign," an orange box labeled "Farebox" and a red box labeled "Maintenance Network Gateway." Several orange boxes are connected to the Maintenance Network Gateway: ABS, Powertrain, HVAC, Multiplex and Drivetrain. To the left of the MDT box is a line connecting to boxes labeled "GPS Receiver and Antenna," (purple) "Odometer & Gyro," (purple) "Doors," (orange), "Covert Alarm Switch," (purple) "Data Modem," (purple) and "Wheelchair" (orange). The APC is connected to the front-door sensor and rear-door sensor via an alternative link. Connected by the vehicle area network (a black line) to the MDT are the Interior DMS (purple), the AVA Controller (purple) and the DVR (purple). The AVA controller is then connected to the PA system and Ambient Noise Control Microphone. The DVR is connected to internal and external cameras. There is a red line (meaning an Ethernet connection) that connects the Data Modem box with Onboard Wireless Gateway (purple). Then the Onboard Wireless Gateway is connected to the DVR via a red line.)
Slide 71:
Case Study of Procuring System(s) Using SAE J1939
AAATA CAD/AVL Procurement
Slide 72:

Slide 73:
Question
What is an interface control document (ICD)?
Answer Choices
- Documents and tracks necessary information to define system’s interface
- Communicates inputs and outputs for all potential actions whether internal to system or transparent
- Helps ensure compatibility between system segments and components
- All of the above
Slide 74:
Review of Answers
a) Documents and tracks necessary information to define system’s interface
Incorrect. This answer is correct along with b and c
b) Communicates inputs and outputs for all potential actions whether internal to system or transparent
Incorrect. This answer is correct along with a and c
c) Helps ensure compatibility between system segments and components
Incorrect. This answer is correct along with a and b
d) All of the above
Correct! All statements are correct
Slide 75:
Module Summary
- Reviewed the structure and use of data exchange standards for Transit Management systems
- Identified and described contents and use of SAE J1587/J1708 and J1939, and provided examples of single-point logon using standards
- Provided case studies of procuring systems using SAE J1587/J1708 and J1939
- Identified what is included in specifications
Slide 76:
Module Summary
Lessons Learned
- The use of data exchange standards for Transit Management systems allow agencies to use components/systems from multiple vendors
- The use of SAE J1708 must include J1587 as well
- The selection of standard(s) to incorporate in functional specifications is based on the standard’s availability, applicability, maturity and the vendors’ use and acceptance of the standard
- SAE J1708 is outdated, so transit agency may want to consider moving their on-board systems to use J1939
Slide 77:
Module Summary
Lessons Learned (continued)
- Agencies have experienced cost savings through the use of onboard transit standards, as shown in the CARTA case study
- The use of on-board transit standards facilitates the replacement of on-board components/systems
- An Interface Control Document (ICD) documents the necessary information required to effectively define a system’s interface as well as any rules for communicating with them
- Single-point login requires the use of on-board transit standards
Slide 78:
Thank you for completing this module.
Feedback
Please use the Feedback link below to provide us with your thoughts and comments about the value of the training.
Thank you!