ITS Transit Standards Professional Capacity Building Program
Module 2: Transit Management Standards, Part 1 of 2
HTML of the Student Supplement
(Note: This document has been converted from the Student Supplement to 508-compliant HTML. The formatting has been adjusted for 508 compliance, but all the original text content is included, plus additional text descriptions for the images, photos and/or diagrams have been provided below.)
Module 2: Transit Management Standards, Part 1 of 2
Table of Contents
Introduction/Purpose - 2
Samples/Examples- 5
References to Other Standards- 7
Case Studies - 7
Glossary - 11
References - 13
Study Questions - 14
Module Description
This module is the first of the two course modules on transit management using standards. This module provides the background for understanding transit management functions and the standards that facilitate the implementation of systems and technologies that support those transit management functions by:
- Briefly explaining the transit management functions and systems within the context of National ITS Architecture;
- Describing the basic taxonomy that will help define where standards should be considered within the functions;
- Discussing the functions of transit management systems to conceptualize technology implementation at an agency so that participants understand where the standards can be used; and
- Introducing systems engineering process (SEP) and its use in planning, procuring, and deploying transit management systems.
Also explained in this module is how to best adapt the state-of-the-practice, such as systems engineering, for those functions within transit management where standards do not exist. Knowledge of transit management functions and systems within the National ITS Architecture framework will provide participants with the context necessary to consider those standards that will facilitate data exchange among various technologies within or external to a transit agency.
1. Introduction/Purpose
Transit management covers technologies and systems that facilitate and automate operations, planning, management, maintenance, safety, security, and data management functions of public transit systems. Transit management systems, which include hardware and software, are typically located on-board vehicles, at control centers/dispatch or garage locations, and at transit stations or stops. Communications technologies provide the basis for receiving and transmitting the data and information generated by these systems. In some cases, information generated by several transit management systems provides the basis for generating customer-facing traveler information.
On-board transit management systems include several technologies that provide vehicle location information to dispatch, count boarding and alighting passengers, provide surveillance of the interior and exterior of the vehicle, provide the driver and passengers with security, monitor the "health" of vehicle components (e.g., engine, transmission, propulsion), monitor vehicle performance (e.g., G-force monitoring), provide collision warnings, lane control and precision docking information, and facilitate signal priority (which is discussed in Modules 8 and 9). Transit management systems at a central location like dispatch or garage facilities include technologies that schedule and dispatch vehicles and vehicle operators, manage yard facilities, manage maintenance and fueling activities, manage and analyze data, and provide reporting capabilities. (Please note that Fare Collection standards are covered in Module 10.)
The relationships among central Transit Management and other transit ITS technologies are shown in Figure 1. Figure 2 shows an example of the relationships on-board a transit vehicle.
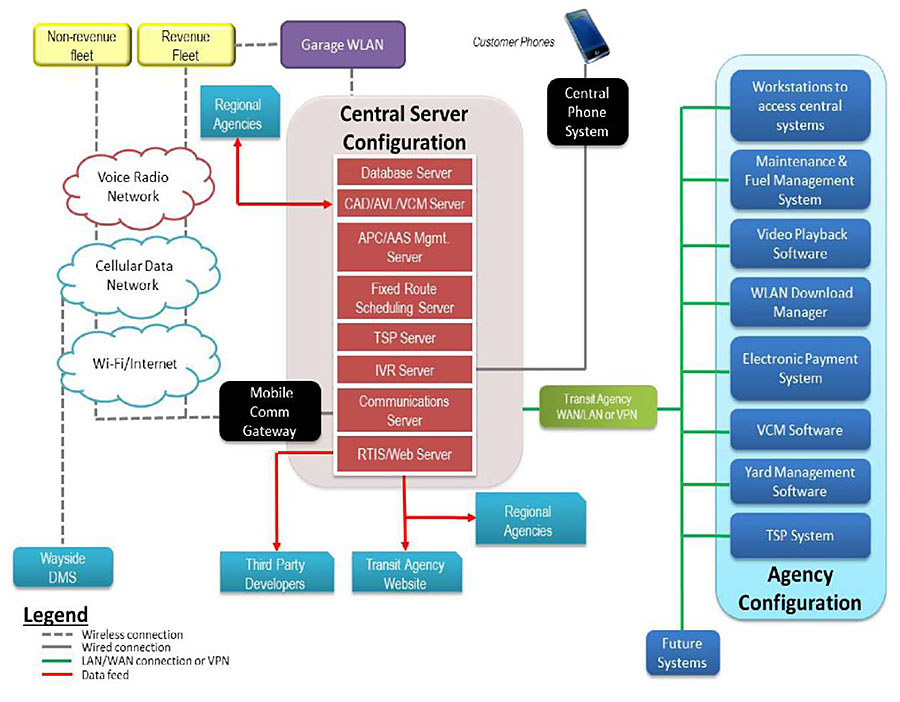
(Extended Text Description: Example of Central System Technology Relationships: This graphic shows the relationships among various Central System Technologies. Beginning in the center of the graphic, there is a red rectangular column representing the Central Server Configuration. In this column the following servers are represented in individual blocks from top to bottom: Database Server, CAD/AVL (Computer Aided Dispatch and Automatic Vehicle Location) Server, APC/ASA Mgmt. Server, Fixed Route Scheduling Server, TSP Server, IVR Server, Communications Server, and RTIS/Web Server. From the IVR Server, there is a gray line representing a wired connection that leads to a black box labeled "Central Phone System" with a smart phone icon above it. From the RTIS/Web Server, a red line representing data feed points down to a blue box labeled "Transit Agency Website." Coming from the left side of the RTIS/Web Server is another line pointing to blue box labeled "Third Party Developers." From the left side of the Communications Server, there is a dotted gray line that goes to a black box labeled "Comm Gateway" and branches upwards through three cloud networks (bottom to top: the Wi-Fi/Internet, Cellular Network, and Radio systems), going on to two separate yellow boxes. These boxes are labeled "Revenue Fleet" and "Non-revenue Fleet." From the Cellular network cloud, there is another dotted gray line going downwards representing the wireless connection to the Wayside DMS. Coming from the entire Central Server Configuration, there is a solid green line representing the LAN/WAN connection or VPN. This line goes through a light green box labeled "Transit Agency WAN and LAN" and branches out to a light blue section identified as the "Agency Configuration." Within the "Agency Configuration," the following items are represented in individual dark blue boxes (top to bottom): Electronic Payment System, Maintenance Management System, Video Playback Software, WLAN Download Manager, Workstations to access central systems, VCM Software, and TSP System. Outside the "Agency Configuration," the LAN/WAN connection also leads to a dark blue box labeled as "Future Systems.")
Figure 1. Example of Central System Technology Relationships (courtesy TranSystems Corporation)
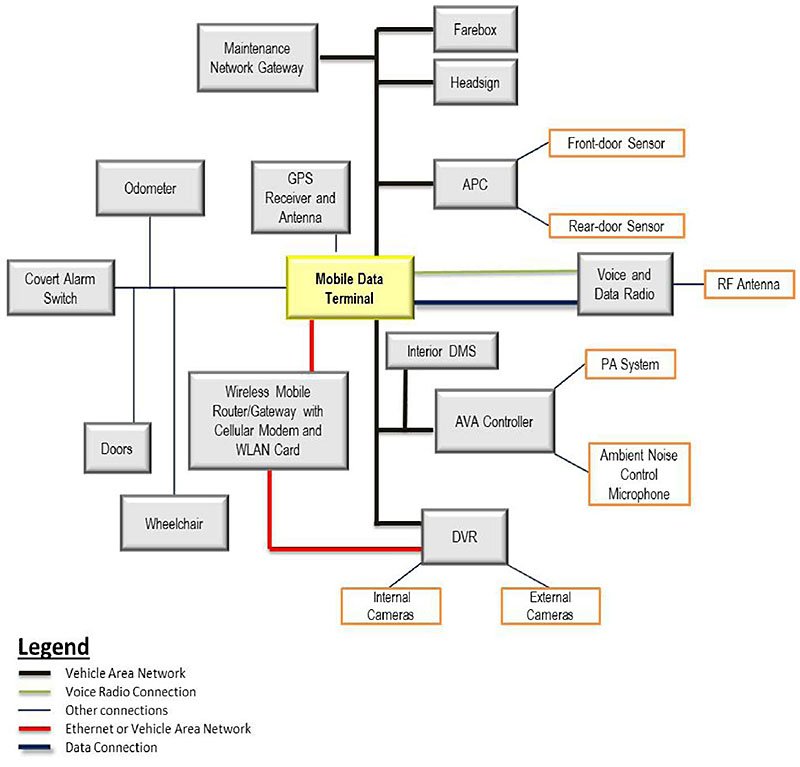
(Extended Text Description: Example of Onboard Technology Relationships: This graphic shows an example of the relationships among various ITS technologies onboard a vehicle. In the center of the diagram is a box labeled MDT (Mobile Data Terminal). Coming from the top of MDT, is a box labeled "GPS Receiver and Antenna" connected via a voice radio connection. Connected to the MDT via a vehicle area network are the Maintenance Network Gateway, farebox, headsign and APC. The APC is connected to the front-door sensor and rear-door sensor via an alternative link. Utilizing both a Voice Radio Connection and a Data Connection, the MDT is connected to the Voice and Data Radio. This is then connected to the RF antenna. Connected by another vehicle area network are the Interior DMS, the ASA Controller, and the DVR. The ASA controller is then connected to the PA system and Ambient Noise Control Microphone. The DVR is connected to internal and external cameras. Coming from the bottom of the MDT rectangle is a red line representing an Ethernet link. This link connects a Wireless Mobile Router/Gateway with cellular modem and WLAN card. This link continues and also connects to the DVR. To the left, the MDT is also connected to the following: Collision Avoidance, Odometer, Covert Alarm Switch, Doors, and Wheelchair.)
Figure 2. Example of On-Board Technology Relationships (courtesy TranSystems Corporation)
2. Samples/Examples
As described in Module 1, System Engineering (SE) is a structured process for arriving at a final design of a system. The final design is selected from a number of alternatives that accomplish the same objectives and considers the total life-cycle of the project. It includes not only the technical merits of potential solutions, but also the costs and relative value of alternatives.
As shown in Figure 3, one key to SE is the use of a repeatable process or set of processes. As your organization employs SE practices more and more, you should sit down with your colleagues at the conclusion of each project and determine what worked well and what should be done differently the next time. Start to document the processes you used during the project life cycle and modify them based on your lessons learned. You’ll want to pay extra attention to any project reviews you held to measure their quality. After you’ve developed a good set of processes that have been used on several projects, obtain agreement from your organization to establish processes for your organization. This will require buy-in from senior management, who should establish a policy that will support the processes and guidelines for their use.
Be sure to look at existing processes that are already defined in your organization. You may find that the Information Technology group has already implemented a good set of processes, many of which can be applied to ITS projects. The processes that are used for traditional capital development projects may also be helpful. For example, many agencies already have good, established project management processes such as risk management, establishment of integrated project teams, and value engineering processes; any of which may be equally applicable to ITS projects. When processes apply to many types of projects, it makes sense to define a single organizational process that can be applied to technology projects and other types of projects.
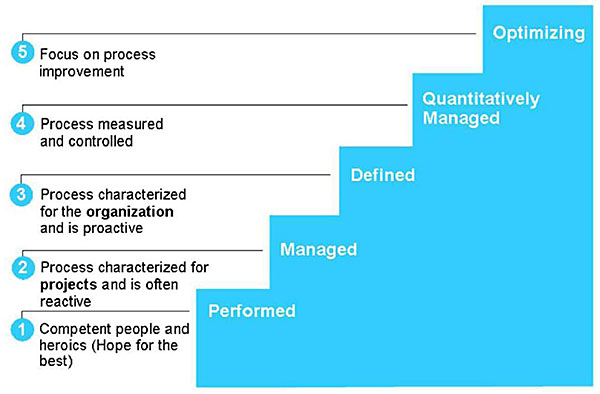
(Extended Text Description: Systems Engineering is a Repeatable Process: This graphic shows five steps of a staircase, each labeled as follows:
- Step 1 (the lowest step) – Performed
- Step 2 – Managed
- Step 3 – Defined
- Step 4 – Quantitatively Managed
- Step 5 (top step) – Optimizing
To the left of Step 1, it is labeled "1. Competent people and heroics (Hope for the best)." To the left of Step 2, it is labeled "2. Process characterized for projects and is often reactive." To the left of Step 3, it is labeled "3. Process characterized for the organization and is proactive." To the left of Step 4, it is labeled "4. Process measured and controlled." To the left of Step 5, it is labeled "5. Focus on process improvement." This shows a proven approach to process improvement. You start with the right people trying to do the right things at Level 1, move to documenting the process on a project-by-project basis at Level 2, and then implement these tested processes for the organization at Level 3. This is a natural progression that results in good processes that support the organization’s business needs and are supported by upper management and organizational policy. Each maturity level provides a foundation for the level above it.)
Figure 3. Systems Engineering is a Repeatable Process
Since it was first developed in the 1980s, the SE Vee model has been refined and applied in many different industries. Figure 4 is a reminder of the Vee model at a very high level. Figure 5 provides the details of the Vee as described in Module 1.
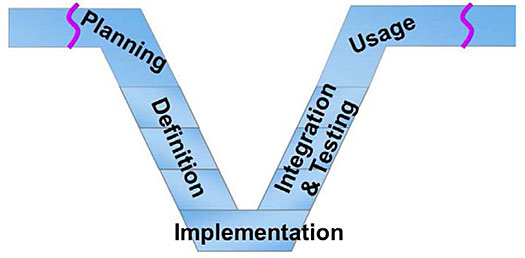
(Extended Text Description: High-level SE "Vee" Model: A graphical illustration indicating the sequence of systems engineering steps in the shape of the V with wings. The left side of the V represents planning and definition. The bottom of the V represents implementation. The right side of the V represents integration and testing, and usage.)
Figure 4. High-level SE Vee Model
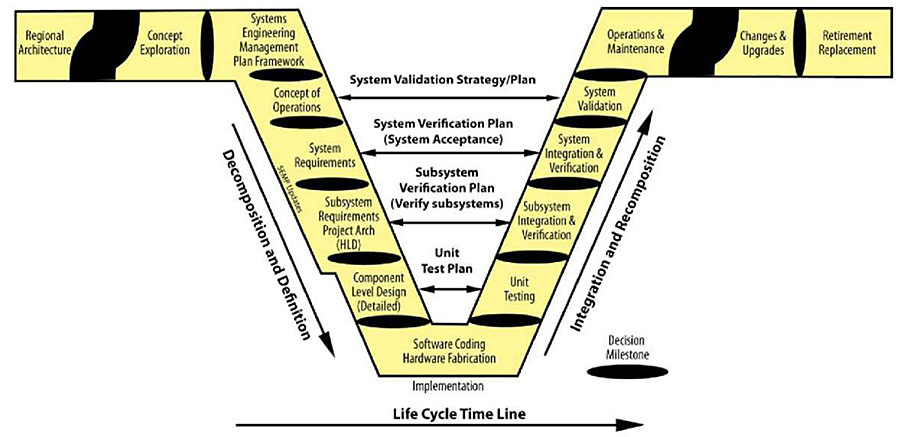
(Extended Text Description: Detailed Vee Diagram: This is an image that describes the V model of the Systems Engineering Process Life Cycle. The left side of the V represents concept development and the decomposition and definition of requirements into function and physical entities that can be architected, designed, and developed. The right side of the V represents integration and re-composition of these entities (including appropriate testing to verify that they satisfy the requirements) and their ultimate transition into the field, where they are operated and maintained. Each step in the life cycle is delineated by a decision gate. Starting from the left wing of the V and working down the V across the life cycle time line, it is broken into Regional Architecture, Concept Exploration, Systems Engineering Management Plan Framework, Concept of Operations, System Requirements, Subsystem Requirements Project Arch (HLD), Component Level Design and finally Software Coding Hardware Fabrication at the bottom of the V. Working up the V on the right side includes Unit Testing, Subsystem Integration & Verification, System Integration & Verification, System Validation, Operations & Maintenance, Changes & Upgrades and finally Retirement Replacement. There is a pullout box on the left side labeled Cost Cutting Activities with the listed elements underneath: Stakeholder Involvement, Elicitation, Project Management, Risk Management, Metrics, Configuration Management, Interface Management, Process Improvement, Decision Gates, Trade Studies, Technical Reviews, Traceability.)
Figure 5. Detailed Vee Diagram
3. Reference to Other Standards
N/A. References will be made in Module 5: Transit Management, Part 2.
4. Case Studies
4.1. Chattanooga Area Regional Transportation Authority (CARTA)
Chattanooga Area Regional Transportation Authority (CARTA) followed the Vee approach, but tailored the approach as indicated on Figure 6 to better suit the scale of their organization and the incremental approach used to develop the overall technology program through a sequence of individual project deployments.
For example, the subsystem and system verification steps were combined in an overall acceptance testing process based on the modest scope of each individual deployment project. There were also opportunities to involve key CARTA end users throughout the project development and implementation process to validate that the system would meet their needs. The concept of operations was incrementally updated when needed to reflect the specific effects of individual projects as they were deployed.
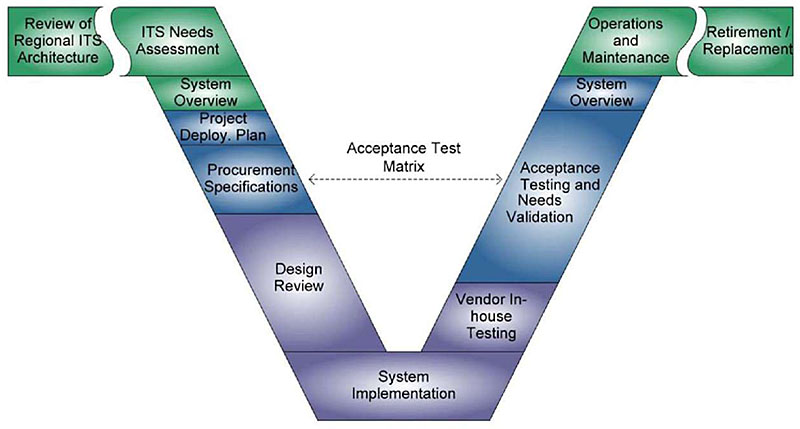
(Extended Text Description: Systems Engineering Process Used by CARTA: This image contains the "V" diagram from the systems engineering process (SEP) adapted by CARTA. The main graphic of the SEP is the V with some additional horizontal "wings" on the left and right side of the top of the V. The left "wing" of the CARTA V has one step: Review of Regional ITS Architecture. This step is in green, indicating that this activity was conducted for CARTA’s entire ITS Program. At this point, after this step, the steps begin to descend the left side of the V with ITS Needs Assessment (also green in color), System Overview (green in color), Project Deployment Plan, Procurement Specifications and Design Review. The Project Deployment Plan and Procurement Specifications steps are blue in color, indicating that these activities were conducted very each technology project. The Design Review step is purple in color, indicating that this activity was performed primarily by project implementation contractors in a collaborative approach involving CARTA review and feedback. The System Implementation step (purple in color) is at the bottom of CARTA’s V. At this point the steps begin to ascend the right side of the V with Vendor In-house Testing (purple in color), Acceptance Testing and Needs Validation (blue in color), System Overview (blue in color), and Operations and Maintenance (green in color). At this point the step on the right "wing" of the V is Retirement/Replacement (green in color). In CARTA’s V, there is a horizontal dashed line between the Procurement Specifications step on the left, descending side of the V and the Acceptance Testing and Needs Validation.)
Figure 6. Systems Engineering Process Used by CARTA
In Figure 6, green shading indicates activities that were conducted for their entire technology program and blue shading indicates activities that were conducted for each project. Purple shading indicates activities performed primarily by project implementation contractors in a collaborative approach involving CARTA review and feedback.
CARTA began its process with a review of the existing Regional ITS Architecture. This included a review of CARTA operations/organization/infrastructure to help identify needs that could be addressed through the deployment of proven technologies and related these needs to the User Services and Market Packages in the ITS Architecture. These efforts helped CARTA explore and define an overall technology program vision - a system concept overview for how existing and additional technologies could be best integrated to address the agency’s needs and situation over the course of developing the overall technology program. This system overview document defined the ongoing and near-term procurement packages and provided general descriptions of medium-and long-term plans for procurement packages. It also served as both a concept of operations for CARTA technology and a planning document.
As individual project procurements were being initiated, CARTA developed a project deployment plan. These plans defined the scope of the individual projects and helped CARTA prepare to successfully transition each project into revenue service once the deployment was completed. It addressed aspects such as organizational impacts, operations and maintenance, monitoring and evaluation, and outreach. The project requirements were documented in the procurement package for the project, including an acceptance matrix that served as the basis for the design review and acceptance testing.
The selected project implementation contractor completed a collaborative design documentation and review process with CARTA, prior to developing and deploying the system hardware, software, and integration. The project implementation contractor was responsible for in-house testing prior to the start of formal acceptance testing, which was witnessed by CARTA for each subsystem and the overall system. The testing followed procedures that were collaboratively planned in advance with the vendor so as to formally verify all acceptance matrix requirements.
CARTA’s keys to success are as follows:
- Documenting the long-term vision for technology. CARTA developed documents that described its long-term vision for technology, and these documents helped keep them on track in its deployments. They also helped ensure that long lead-time activities were completed in time to support its future plans.
- Avoiding the temptation to do too much too fast. CARTA sequenced its deployments so that systems were deployed sequentially, avoiding deployment of dependent systems at the same time. For example, one reason the CARTA data warehouse was its first technology deployment was that so many other systems would need to integrate with it. Deploying it first meant that it could be operating stably before these other integrations occurred.
- Being willing to accept schedule delays when needed to help manage deployment risks. When changes to CARTA’s deployment schedule were needed, CARTA was willing to accept delays in order to control risks. For example, when the bus arrival time prediction system was deployed early to take advantage of an outside funding opportunity, CARTA delayed other deployment activities so as not to overburden its limited IT resources.
- Using a data warehouse. The presence of a data warehouse at CARTA simplified other deployments in two ways. First, the data warehouse provided reporting tools, which eliminated the need for sophisticated reporting tools in other CARTA applications. Second, applications could be integrated with the data warehouse, reducing the total number of interfaces that were required.
- Testing systems thoroughly before introducing them to operations. CARTA displayed a strong commitment to thoroughly testing all systems before accepting them as complete and introducing them to operations. CARTA found and corrected many problems during final testing. If these problems had occurred in an operational system, they could have caused operational problems that could have reduced the confidence of the public and CARTA management in the technology plans.
4.2. LYNX, Orlando FL
LYNX used the Vee systems engineering model to develop and implement their Model Orlando Regionally Efficient Travel Management Coordination Center (MORETMCC) program. Generally, their approach was to address the following:
- Problem: What are you trying to solve?
- Concept: How do you think you will solve the problem? Who are the stakeholders?
- Needs: What do the stakeholders need the solution to do?
- Requirements: How must the solution perform to meet the needs?
- Design: Incorporate the problem statement, concept, needs, and requirements.
LYNX used every step of the Vee model, as shown in Figure 7, to establish a replicable and scalable model of a TMCC that provides one-stop, unified customer-based travel information and trip planning services, and supports coordinated human services transportation operations. They followed the intent of the SEP: Focusing on defining customer needs and required functionality early in the development cycle, documenting requirements, and then proceeding with design synthesis and system validation while considering the complete problem.
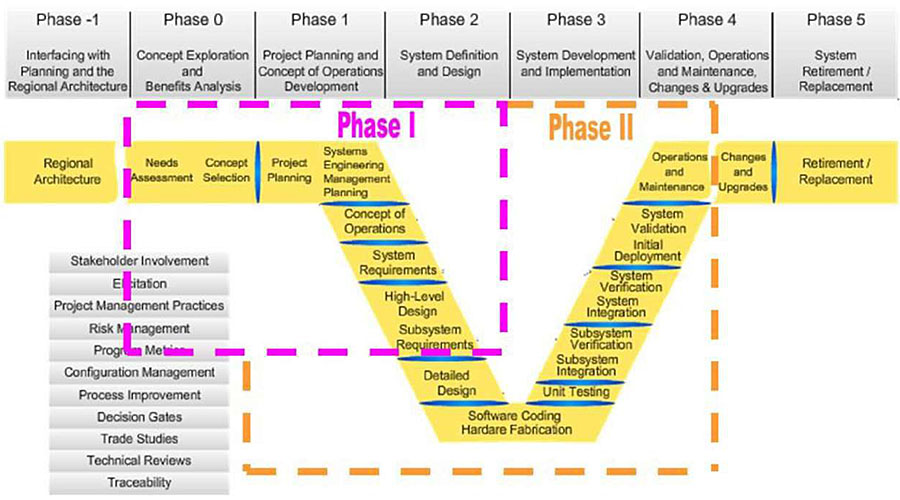
(Extended Text Description: LYNX MORETMCC Use of the Vee Model: This is an image that describes the V model of the Systems Engineering Process Life Cycle as applied by LYNX. The left side of the V represents concept development and the decomposition and definition of requirements into function and physical entities that can be architected, designed, and developed. The right side of the V represents integration and re-composition of these entities (including appropriate testing to verify that they satisfy the requirements) and their ultimate transition into the field, where they are operated and maintained. Each step in the life cycle is delineated by a decision gate. Starting from the left wing of the V and working down the V across the life cycle time line, it is broken into Regional Architecture, Needs Assessment, Concept Selection, Project Planning, Systems Engineering Management Plan Framework, Concept of Operations, System Requirements, High-level Design/Subsystem Requirements, Detailed Design and finally Software Coding Hardware Fabrication at the bottom of the V. Working up the V on the right side includes Unit Testing, Subsystem Integration/Verification, System Integration/Verification, System Validation/Initial Deployment, Operations and Maintenance, Changes and Upgrades, and finally Retirement/Replacement. There is a pullout box on the left side labeled Cost Cutting Activities with the listed elements underneath: Stakeholder Involvement, Elicitation, Project Management, Risk Management, Metrics, Configuration Management, Interface Management, Process Improvement, Decision Gates, Trade Studies, Technical Reviews, and Traceability. Phase I of the MORETMCC project is shown as dashed lines around a portion of the V with the left-hand border to the left of Needs Assessment, the upper border above Needs Assessment, Concept Selection, Project Planning, Systems Engineering Management Planning, the right-hand border to the right of Systems Engineering Management Planning, Concept of Operations System Requirements and High-level Design/Subsystem Requirements, and the bottom border below High-level Design/Subsystem Requirements. Phase II of the MORETMCC project encompasses the following steps within the V: Detailed Design, Software Coding/Hardware Fabrication, Unit Testing, Subsystem Verification/Subsystem Integration, System Verification/System Integration, System Validation/Initial Deployment, and Operations and Maintenance.)
Figure 7. LYNX MORETMCC Use of the Vee Model
4.3. Efficient Deployment of Advanced Public Transportation Systems (EDAPTS)
The Efficient Deployment of Advanced Public Transportation Systems (EDAPTS) project has helped transit agencies across California and other states develop new viewpoints on how ITS systems can help fill unmet needs and resolve nagging problems over the past 15 years. They developed a methodology, guidelines and tools to make the procurement of ITS easier, less costly, more effective and more efficient for smaller agencies. They adapted the Vee model as shown in Figure 8.
EDAPTS identified unique small transit operational and customer service problem areas where ITS might help, developed conceptual solutions, and tested those solutions in a real world environment. Their detailed solutions used the FHWA National ITS Architecture Guidelines and the National Transit Coordinated Interface Protocol’s (TCIP) as integral elements of the design. The conceptual designs incorporated novel, cost saving approaches such as transmission of digital data by time sharing the current analog voice radio link, using a single text paging service to simultaneously update bus arrival data at all bus stop Dynamic Messaging Sign’s (DMS), and using solar power for the signs to allow installation anywhere
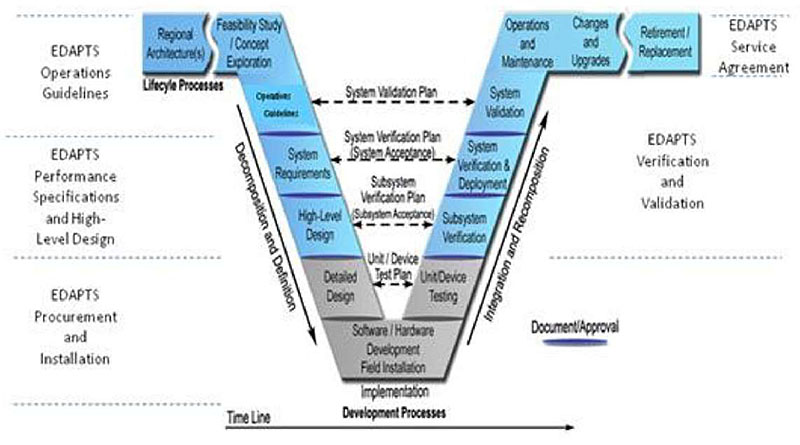
(Extended Text Description: EDAPTS Adaptation of the Vee Model: This image contains the "V" diagram from the systems engineering process. The main graphic of the SEP is the V with some additional horizontal "wings" on the left and right side of the top of the V. Starting from the left "wing" the step is Regional Architecture(s). At this point the steps begin to descend the left side of the V with Feasibility Study/Concept Exploration, Operations Guidelines, System Requirements, High-level Design and Detailed Design. At the bottom of the V is the Software/Hardware Development and Field Installation step. At this point the steps begin to ascend the right side of the V with Unit/Device Testing, Subsystem Verification, System Verification and Deployment, System Validation, and Operations and Maintenance. At this point the steps on the right "wing" of the V are Changes and Upgrades, and Retirement/Replacement. These SEP steps correspond to EDAPTS phases as follows:
- EDAPTS Operations Guidelines consists of the Regional Architecture(s), Feasibility Study/Concept Exploration and Operations Guidelines steps
- EDAPTS Performance Specifications and High-Level Design consists of System Requirements and High-Level Design steps
- EDAPTS Procurement and Installation consists of Detailed Design, Software/Hardware Development and Field Installation, and Unit/Device Testing steps
- EDAPTS Verification and Validation consists of Subsystem Verification, System Verification and Deployment, and System Validation steps
- EDAPTS Service Agreement consists of Operations and Maintenance, Changes and Upgrades, and Retirement/Replacement steps
Figure 8. EDAPTS Adaptation of the Vee Model
5. Glossary
| Term | Definition |
|---|---|
| Communications Layer | One of three layers (along with the transportation and institutional layers) defined by the National ITS Architecture. The communications layer includes all of the communications equipment (e.g., wireline and wireless transmitters and receivers) and the information management and transport capabilities necessary to transfer information among entities in the transportation layer. The application data content and the transportation application requirements are generally transparent to the communications layer. The communication layer’s view of ITS is that of many distributed users, some of them mobile, which require communication services. |
| Equipment Package | The building blocks of the subsystems of the physical architecture subsystems. Equipment packages group similar processes of a particular subsystem together into an implementable package. The grouping also takes into account the user services and the need to accommodate various levels of functionality. |
| Institutional Layer | An integral component of the National ITS Architecture that represents the existing and emerging institutional constraints and arrangements that are the context for all ITS deployments. The transportation layer and communications layer together provide the technical framework within which interoperable systems may be implemented. The institutional layer introduces the policies, funding incentives, working arrangements, and jurisdictional structure that support the technical layers of the architecture. This institutional layer provides the basis for understanding who the stakeholders will be and the roles these implementers could take in implementing architecture-based ITS systems. |
| Logical Architecture | The part of the National ITS Architecture that defines what has to be done to support the ITS user services. It defines the processes that perform ITS functions and the information or data flows that are shared between these processes. |
| Physical Architecture | The part of the National ITS Architecture that provides agencies with a physical representation (though not a detailed design) of the important ITS interfaces and major system components. It provides a high-level structure around the processes and data flows defined in the logical architecture. The principal elements in the physical architecture are the subsystems and architecture flows that connect these subsystems and terminators into an overall structure. |
| Service Package | The service packages, formerly known as market packages, provide an accessible, service-oriented perspective to the National ITS Architecture. They are tailored to fit, separately or in combination, real world transportation problems and needs. Service packages collect together one or more equipment packages that must work together to deliver a given ITS service and the architecture flows that connect them and other important external systems. In other words, they identify the pieces of the physical architecture that are required to implement a particular ITS service. Service packages are implemented through projects (or groups of projects, aka programs) and in transportation planning, are directly related to ITS strategies used to meet regional goals and objectives. |
| Systems Engineering | An interdisciplinary approach and means to enable the realization of successful systems. It focuses on defining customer needs and required functionality early in the development cycle, documenting requirements, and then proceeding with design synthesis and system validation while considering the complete problem. Systems engineering integrates all the disciplines and specialty groups into a team effort forming a structured development process that proceeds from concept to production to operation. Systems engineering considers both the business and the technical needs of all customers with the goal of providing a quality product that meets the user needs |
| Transportation Layer | One of three layers (along with the communications layer and the institutional layer) defined by the physical architecture. The transportation layer shows the relationships among the transportation related elements. It is composed of subsystems for travelers, vehicles, transportation management centers, and field devices, as well as external system interfaces (terminators) at the boundaries. |
| User Service | User services document what ITS should do from the user’s perspective. A broad range of users are considered, including the traveling public as well as many different types of system operators. |
6. References
- National ITS Architecture 7.0: https://www.arc-it.net/
- ITS ePrimer Module 7: Public Transportation: eprimer/module7.aspx
- Systems Engineering for Intelligent Transportation Systems: https://ops.fhwa.dot.gov/publications/seitsguide/section3.htm
- Carol L. Schweigerand Santosh Mishra, "Utilizing Archived ITS Data: Opportunities for Public Transport," Proceedings of the 19th ITS World Congress, Vienna, Austria, 22/26 October 2012, Paper Number AM-00078
- Haas, E. Perry, and J. Rephlo, A Case Study on Applying the Systems Engineering Approach: Best Practices and Lessons Learned from the Chattanooga SmartBus Project, prepared for United States Department of Transportation, Intelligent Transportation Systems Joint Program Office and Federal Transit Administration, submitted by Science Applications International Corporation, November 2009, Contract No.: DTFH61-02-C-00061 Task No.: 61027, http://ntl.bts.gov/lib/32000/32600/32672/61027 se.pdf- content is no longer available.
- NTI course, Systems Engineering for Technology Projects
- ITS PCB T3 Webinars on ITS Transit Standards, t3 archives.aspx, which includes 14 archived webinars about Transit Management
- EDAPTS: https://www.dot.ca.gov/research/operations/edapts/
- Doug Jamison and Bill Hearndon, "MORETMCC: Building ITS Capabilities, One Step at a Time," National Rural ITS Conference, Coeur d’Alene, ID, August 31, 2011, http://www.nritsconference.org/downloads/Presentations11/SessionHST Jamison.pdf- content is no longer available.
7. Study Questions
-
What is the purpose of ITS standards?
- To keep up with technology
- Interoperability, compatibility and interchangeability
- To document data exchange among ITS systems
- All of the above
-
Which of these are not public transportation service packages?
- Transit Vehicle Tracking
- Multimodal Connection Protection
- Multimodal Coordination
- Traffic Metering
-
Which one of these technologies is included in the Fleet Operations and Management category?
- On-board automated voice announcements
- Scheduling software
- Data management and reporting
- All of the above
-
Which of these technologies are in the Safety and Security category?
- G-force monitoring
- Data management
- Geographic information systems
- Traveler information
-
Computer-aided dispatch (CAD) is dependent upon which one of these technologies?
- Voice and data communications technologies
- Automatic vehicle location (AVL) system
- Route and vehicle schedule data
- All of these
-
Within the Maintenance category, is Fuel Management dependent on another technology?
- Yes
- No
-
Does EDAPTS assume Commercial-off-the-Shelf (COTS) using a simplified SEP?
- Yes
- No
-
Which one of these standards is used for CAD/AVL systems?
- GTFS
- SAE J1939
- TransXChange
- All of the above