ITS Transit Standards Professional Capacity Building Program
Module 20: Application of Arterial Management/Transit Signal Priority Standards
HTML of the PowerPoint Presentation
(Note: This document has been converted from a PowerPoint presentation to 508-compliant HTML. The formatting has been adjusted for 508 compliance, but all the original text content is included, plus additional text descriptions for the images, photos and/or diagrams have been provided below.)
Slide 1:
(Extended Text Description: Welcome - Graphic image of introductory slide. A large dark blue rectangle with a wide, light grid pattern at the top half and bands of dark and lighter blue bands below. There is a white square ITS logo box with words "Standards ITS Training - Transit" in green and blue on the middle left side. The word "Welcome" in white is to the right of the logo. Under the logo box is the logo for the U.S. Department of Transportation, Office of the Assistant Secretary for Research and Technology.)
Slide 2:
Module 20:
Application of Arterial Management/Transit Signal Priority Standards
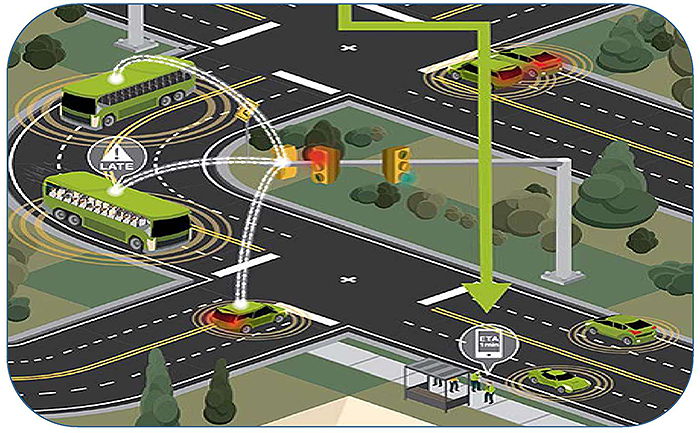
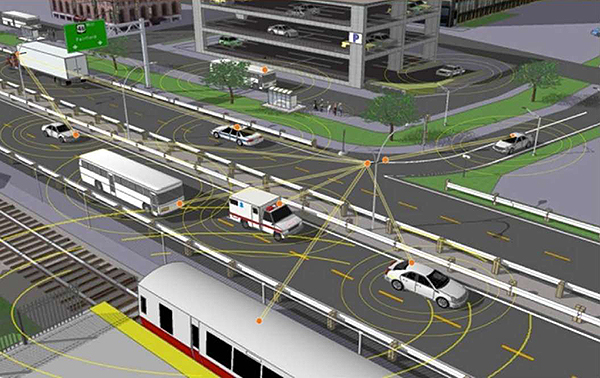
(Extended Text Description: This figure contains a graphic of a connected vehicle environment. On the top, there is a four-way intersection (2 lanes in each direction) with two westbound cars stopped at the signal. The cars have three yellow concentric circles around them, like a ripple effect, this represents a connected vehicle. Downstream of this signal in the southbound direction there are two transit vehicles, also with yellow concentric circles around them approaching a T intersection. There are also white dotted lines drawn from the buses to the traffic signal, depicting a wireless connection (transit signal priority). Northbound, stopped at the T intersection signal there is one car who also has white dotted lines drawn from it to the signal. On the Southeast corner of this intersection there is a bus shelter with four pedestrians, one of which is using a smartphone. The acronym "ETA" is displayed in a smartphone graphic above his head, implying that he is checking the arrival time of the transit vehicle. Two more vehicles are shown on the eastbound side of the T intersection, one driving westbound and the other eastbound, with yellow concentric circles around them as well.)
Slide 3:
Instructor
Patrick Chan, P.E.
Senior Technical Staff
Consensus Systems Technologies
Slide 4:
Learning Objectives
- Specify and Test a Transit Signal Priority Implementation
- Describe how Transit Signal Priority may be provided in a Connected Vehicle Environment
- Explain the Role of Transit Signal Priority in Integrated Corridors
- Review Case Studies where Standards were Used to Provide Transit Signal Priority
Slide 5:
Learning Objective 1
Specify and Test a Transit Signal Priority Implementation
Slide 6:
Identify Potential Issues with NTCIP 1211 v02
NTCIP 1211 v02
- National Transportation Communications for ITS Protocol (NTCIP) Object Definitions for Signal Control and Priority
Review
- Priority Request Generator (PRG)
- Priority Request Server (PRS)
- Controller (CO)
Architectures
- The standards support several different architectures
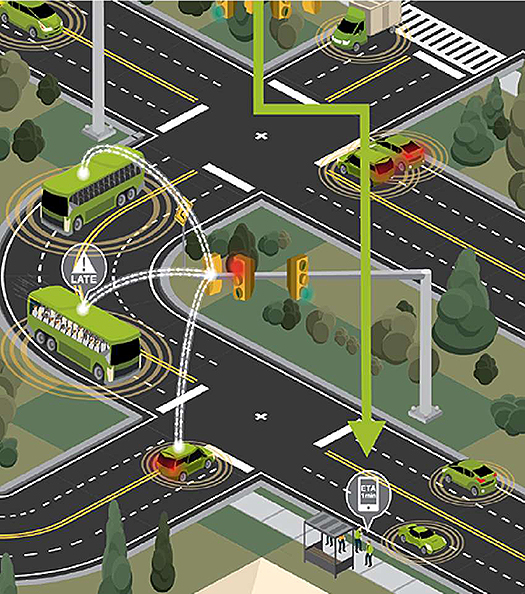
(Extended Text Description: This figure contains a graphic of a connected vehicle environment. On the top, there is a four-way intersection (2 lanes in each direction) with two westbound cars stopped at the signal. The cars have three yellow concentric circles around them, like a ripple effect, this represents a connected vehicle. Downstream of this signal in the southbound direction there are two transit vehicles, also with yellow concentric circles around them approaching a T intersection. There are also white dotted lines drawn from the buses to the traffic signal, depicting a wireless connection (transit signal priority). Northbound, stopped at the T intersection signal there is one car who also has white dotted lines drawn from it to the signal. On the Southeast corner of this intersection there is a bus shelter with four pedestrians, one of which is using a smartphone. The acronym "ETA" is displayed in a smartphone graphic above his head, implying that he is checking the arrival time of the transit vehicle. Two more vehicles are shown on the eastbound side of the T intersection, one driving westbound and the other eastbound, with yellow concentric circles around them as well.)

Slide 7:
Identify Potential Issues with NTCIP 1211 v02
Priority Requests
-
Priority Strategy
- Defines which approaches the requesting vehicle will enter and exit an intersection
- Required within the priority request
- The requestor is expected to maintain a database of priority strategies
Slide 8:
Identify Potential Issues with NTCIP 1211 v02
Priority Requests
- Vehicle Type: Could be public safety or transit vehicles
- Vehicle Class: A category of vehicle type. For example, bus rapid transit vs express vs local transit service
-
Vehicle type and class needs to have an agreed upon regional definition
- Could be an issue for inter-regional vehicles
Slide 9:
Identify Potential Issues with NTCIP 1211 v02
Transit Communications Information Profiles (TCIP)
- ITS standard defining standardized interfaces for the exchange of information (data) among transit business systems, subsystems, components, and devices
- Not widely deployed in the United States
Defining system architecture(s) supported is key
- TCIP identifies 5 transit signal priority (TSP) scenarios
- NTCIP 1211 v02 identifies the same 5 system architectures plus one additional
Slide 10:
Test a Standards-Based TSP Implementation
Why Perform Testing?
- To meet a payment milestone
- To identify errors/bugs so they can be corrected
-
To verify that the system was built correctly
- The system interface must meet the procurement specification and satisfy the requirements (Was the system built right?)
-
To validate that the right system was built
- The system interface must satisfy the initial user needs (Was the right system built?)
Slide 11:
Test a Standards-Based TSP Implementation
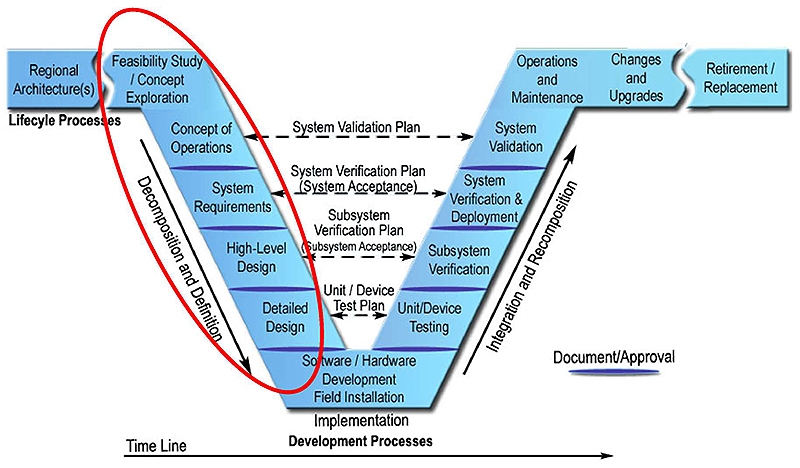
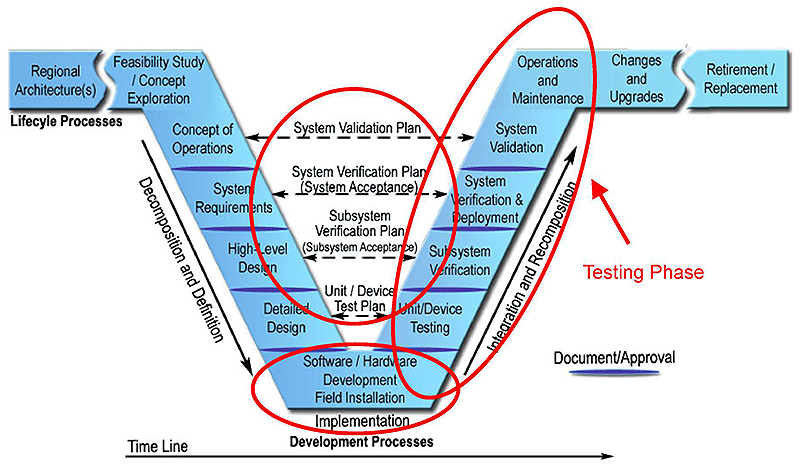
(Extended Text Description: This is a graphic of the systems engineering process (SEP). The graphic of the SEP is a V-shaped diagram in gradated blue with some additional horizontal extensions on the left and right side of the top of the V shape (wings). Each section is separated with dark blue lines. There is a key at the lower right showing the blue separator lines, and designating them as "Document/Approval." The left horizontal extension is labeled as "Lifecycle Processes" and include the sections "Regional Architecture(s)" (separated by a white space) to the second section labeled "Feasibility Study / Concept Exploration." At this point the sections begin to descend the left side of the V with "Concept of Operations," "System Requirements," "High-level Design," "Detailed Design," and "Software / Hardware Development Field Installation" at the bottom juncture of the V shape. Underneath the bottom point of the V shape are the words "Implementation" then "Development Processes" and a long thin arrow pointing to the right labeled "Time Line." There is a long thin diagonal arrow pointing down along the left side of the V labeled "Decomposition and Definition." From the bottom point of the V, the sections begin to ascend up the right side of the V with "Unit / Device Testing," (blue line) "Subsystem Verification," (blue line) "System Verification & Deployment," (blue line) "System Validation," and (blue line) "Operations and Maintenance." There is a long thin arrow pointing up along the right side of the V shaped labeled "Integration and Recomposition." At this point the sections on the right "wing" of the V are labeled with "Changes and Upgrades" and (white space) "Retirement/Replacement." Between the V shape there are a series of black dashed arrows connecting the related sections on each left/right side of the V shape. The first arrow (top) is labeled "System Validation Plan" and connects "Concept of Operations" on the left and "System Validation" on the right. The second arrow is labeled "System Verification Plan (System Acceptance)" and connects "System Requirements" on the left and "System Verification and Deployment" on the right. The third arrow is labeled "Subsystem Verification Plan (Subsystem Acceptance)" and connects "High-Level Design" on the left and "Subsystem Verification" on the right. The last arrow (at the bottom) is labeled "Unit/Device Test Plan" and connects "Detailed Design" on the left and "Unit/Device Testing" on the right. The left side of the V has a red circle drawn around because the instructor is focusing on this particular component in this slide.)

Slide 12:
Test a Standards-Based TSP Implementation
(Extended Text Description: This is the same V model graphic as shown in Slide #11 and described in the exact same way, except now the bottom section, 4 dashed arrows in the middle, and right side of the V now have a red circle drawn around them because the instructor is focusing on these particular components in this slide.)
Slide 13:
Verification
Ongoing process that builds quality into the system through a systematic approach of verification of requirements - i.e., "you built the system right."
- Unit/Device Testing - e.g., test a standalone PRG, PRS or an interface
- Subsystem Verification - e.g., tests a specific interface and its immediate environment, typically under laboratory environment
- System Verification and Deployment - e.g., tests the entire transit signal priority system, including the management center software
Slide 14:
Validation
- Answers the question: Can I operate the system and satisfy all my stakeholder’s user needs?
- Ensures the requirements and the system are the right solution to the stated problem - i.e., "you built the right system."
-
The system is validated when:
- Approved by the key stakeholders and agencies
- All the project requirements are fulfilled
- Corrective actions have been implemented for any anomalies that have been detected
Slide 15:
What are We Testing?
-
Compliance with the procurement specification
- Does the system fulfill all the requirements (shall statements) in the procurement specification?
-
Conformance with the standards
- Does the system fulfill the requirements selected for the system as specified in the standard?
- The system must also fulfill other specified (user-selected) requirements of the standards it references
- Conformance is NOT compliance!
Slide 16:
What are We Testing?
Conformance:
-
Testing that the proper protocols are being used
- E.g., NTCIP 1103 - NTCIP Transportation Management Protocols
-
Testing that the data exchanges occur as defined by the standard
- Correct sequence of events and data content is being exchanged
- Correct handling of error messages
- Correct structure of the data content

Slide 17:
How to Test a Standards-Based TSP Implementation
Recall structure of
NTCIP 1211 v02
- Defines user needs
- Defines requirements
- Defines a single design for each requirement

Slide 18:
How to Test a Standards-Based TSP Implementation
Protocol Requirements List (PRL)
- Traces a user need with the requirements that satisfies the user need
- A completed PRL indicates what features and requirements have been selected for the procurement specification
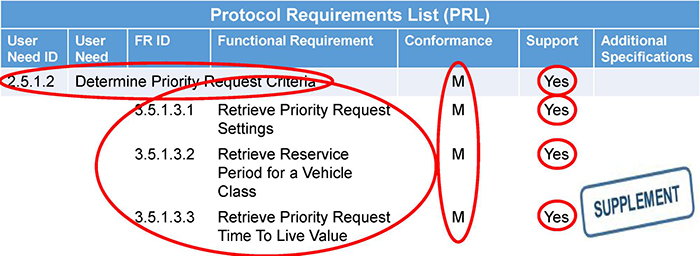
(Extended Text Description: This slide shows an example screen shot of a Protocol Requirements List (PRL), which helps develop a test plan for standards based TSP. The user need ID 2.5.1.2 "Determine Priority Request Criteria," in the first column is circled in red. Below that user need, the requirements identifier and functional requirements in the next three rows (rows 2, 3, and 4) are circled in red, in this case 3.5.1.3.1 Retrieve Priority Request Settings, 3.5.1.3.2 Retrieve Reservice Period for a Vehicle Class, and 3.5.1.3.3 Retrieve Priority Request Time to Live Value. In column 5 labeled "Conformance", in rows 1-4, each cell reads "M," all four cells are circled together in red. The 6th column titled "Support" in rows 1-4 has "Yes" written in each cell, and each individual cell is circled in red. A "Supplement" icon is located in the lower right-hand part of the slide, indicating items or information that are further explained/detailed in the Student Supplement.)
Slide 19:
How to Test a Standards-Based TSP Implementation
Requirements Traceability Matrix (RTM)
- Defines the design (dialogs, messages, and data elements) that must be used to fulfill a requirement
| Requirements Traceability Matrix (RTM) | ||||||
| FR ID | Functional Requirement | Dialog ID | Object ID | Object Name | Additional Specifications | |
|---|---|---|---|---|---|---|
| 3.5.1.3.1 | Retrieve Priority Request Settings | |||||
| 4.3.1.1 | 5.1.2.7 | prsProgramData | ||||
| 3.5.1.3.2 | Retrieve Reservice Period for a Vehicle Class | |||||
| G.1 | 5.1.1.5 | priorityRequestReserviceClass1Time | ||||
| 5.1.1.6 | priorityRequestReserviceClass2Time | |||||
| 5.1.1.7 | priorityRequestReserviceClass3Time | |||||
| 5.1.1.8 | priorityRequestReserviceClass4Time | |||||
Slide 20:
How to Test a Standards-Based TSP Implementation
Requirements to Test Case Traceability Table (RTCTT)
- Traces each requirement selected (in the PRL) to the test case(s) that verifies the requirement is fulfilled
- Indicates the test case(s) that must be passed to fulfill the requirement
- Verifies test case(s) capture testing all requirements at least once
| Requirement | Test Case | ||
| ID | Title | ID | Title |
|---|---|---|---|
| 3.5.1.3.1 | Retrieve Priority Request Settings | ||
| C.1.3.1 | Retrieve Priority Request Settings | ||
| 3.5.1.3.2 | Retrieve Reservice Period for a Vehicle Class | ||
| C.1.3.2 | Retrieve Reservice Period | ||
| C.1.3.3 | Retrieve Reserve Period - No Such Class | ||
Slide 21:
How to Test a Standards-Based TSP Implementation
Multiple test cases may be needed to completely test a requirement
- Each test case may test a different set of values
- Each test case may test different conditions
Each test case should confirm that the interface:
- performs the same sequence of data exchanges (and events) as defined in the standard
- uses the data concepts (messages, data frames or data elements) indicated in the RTM

Slide 22:

Slide 23:
Question
Which of the following is NOT a reason to perform testing?
Answer Choices
- To identify bugs or errors so they can be corrected
- To verify the system fulfills the requirements of the specification
- To validate the right system was built
- To check a box that we did it
Slide 24:
Review of Answers
 a) To identify bugs or errors so they can be corrected
Incorrect. Testing is performed to find and fix problems
b) To verify the system fulfills the requirements of the specification
Incorrect. Testing is performed in order to verify that requirements are fulfilled
c) To validate the right system was built
Incorrect. Testing can be used to verify that the system built satisfies the original user need
 d) To check a box that we did it
Correct! Testing is not done to satisfy a chronological list but completed to ensure that a stable, needed system was created
Slide 25:
Learning Objective 2
Describe How Transit Signal Priority May be Provided in a Connected Vehicle Environment
Slide 26:
What is a Connected Vehicle Environment?
Vehicles broadcast:
- Current position with other vehicles and the roadway
- Sensor information with other vehicles and the roadway
Vehicles receive information:
- Reduce the likelihood of incidents
- Improve mobility (e.g., reduce delays)
Could be a smartphone on a pedestrian or bicyclist
Slide 27:
What is a Connected Vehicle Environment?
Example Vehicle Data
- Latitude and Longitude
- Speed
- Direction
- Turn Signal Status
- Vehicle Length and Width
Example of Infrastructure Data
- Signal Phase and Timing
- Speed limit on roadway
- Estimated Time of Arrival for Transit Vehicle
(Extended Text Description: The slide consists of a graphic of a connected vehicle environment. On the top is a parking garage, next to a four-lane highway (two lanes in each direction). Next to the highway is a commuter rail, with a train in the station. Various vehicles are seen, each with a ring of three yellow concentric circles around them, indicating each vehicle is broadcasting information. Additionally, a yellow line connects a wireless radio on the side of the highway and several vehicles, including the train and a transit bus, to indicate wireless communications between the roadway infrastructure and the vehicles.)
Slide 28:
NHTSA ANPRM
-
August 2014, National Highway Traffic Safety Administration (NHTSA) released an Advance Notice of Proposed Rulemaking (ANRPM) and a supporting research report
- Federal Motor Vehicle Safety Standard (FMVSS) No. 150, to require vehicle-to-vehicle (V2V) communications capability for light vehicles and to create minimum performance requirements for V2V devices and messages
- V2V and vehicle-to-infrastructure (V2I) systems could potentially address 81% of all vehicle crash types
- Notice of Proposed Rulemaking (NPRM) expected in 2016
Slide 29:
What is a Connected Vehicle Environment?
-
V2V communications will open the gates for V2X:
- V2I (Vehicle to Infrastructure)
- V2P (Vehicle to Pedestrians)
-
Opportunity to use the V2V data being broadcasted and vehicle’s ability to receive wireless data to:
- Improve roadway safety
- Improve mobility
- Improve the environment
Slide 30:
What Information is exchanged for TSP in a
CV Environment?
SAE J2735: Dedicated Short Range Communications (DSRC) Message Set Dictionary
Defines the dictionary for connected vehicles
- MAP Data Message (MAP)
- Signal Phase and Timing (SPAT)
- Signal Request Message (SRM)
- Signal Status Message (SSM)
- Also specifies data frames and data elements
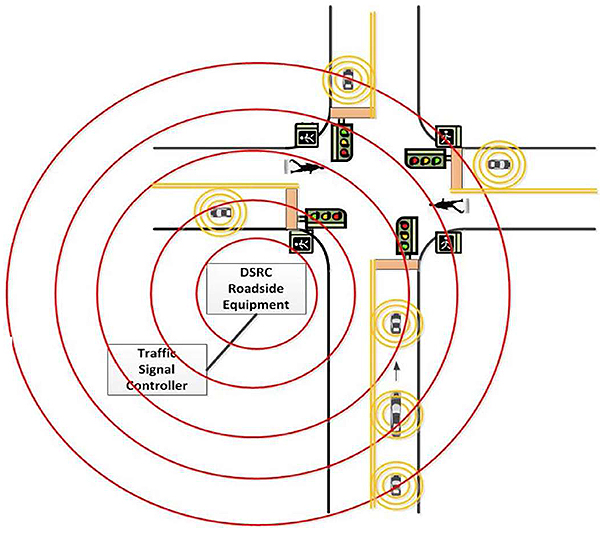
(Extended Text Description: This slide contains a 2-dimensional graphic showing a top-down view of a four-way intersection with one lane in each direction. There are four traffic signal heads, and 4 pedestrian-crossing signal heads, one of each at each corner of the intersection. All vehicles on the diagram are blue and have three concentric yellow circles around them to depict each vehicle broadcasting information. There are 3 vehicles traveling northbound approaching the intersection, 1 of which is a transit vehicle, and 3 other vehicles, one traveling south, one east, and one westbound. In the southwest corner of the intersection there is DSRC roadside equipment that is connected to a traffic signal controller. The DSRC unit has five red concentric circles around it, representing transmitted data messages.)
Slide 31:
What Information is exchanged for TSP in a
CV Environment?
-
Signal Request Message (SRM)
- Broadcast by a vehicle (On-Board Equipment (OBE)) to infrastructure (Road-Side Equipment (RSE))
- Asks for service, including preemption/priority treatment from one or more signal controllers
Slide 32:
What Information is Exchanged For TSP in a CV Environment?
SRM: Mandatory Elements
- Requestor identifier (e.g., vehicle id)
- Request identifier (id of the request)
- Request type (new, update, cancel)
- Lane, approach or connection identifier
SRM: Optional Elements
- Estimated time of arrival
- Estimated duration
- Requestor information (role, vehicle type, priority level)
- Occupancy, schedule adherence information
Slide 33:
What Information is exchanged for TSP in a CV Environment?
Signal Status Message (SSM)
- Broadcast by infrastructure to the vehicles/OBEs
- Response to all the signal priority requests received
-
Contains:
- Identifier of the intersection
- Status of service request(s) for a specific lane or approach
Slide 34:
What Information is exchanged for TSP in a CV Environment?
Example:
- A transit vehicle approaching a signalized intersection enters the DSRC range
- The transit vehicle wirelessly broadcasts a SRM, with its ETA and the identifier of the lane to enter and egress out of the intersection
- The signal controller receives and processes the SRM request
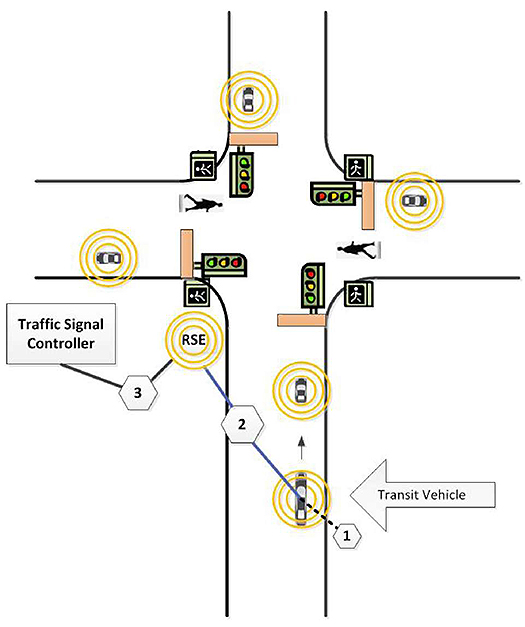
(Extended Text Description: This slide contains a 2-dimensional graphic showing a top-down view of a four-way intersection with one lane in each direction. There are four traffic signal heads, and 4 pedestrian-crossing signal heads, one of each at each corner of the intersection. All vehicles on the diagram are blue and have three concentric yellow circles around them to depict each vehicle broadcasting information. There are 2 vehicles traveling northbound approaching the intersection, 1 of which is a transit vehicle, and 3 other vehicles, one traveling south, one east, and one westbound. There are also 2 pedestrians, one crossing the eastbound lanes and one crossing the westbound lanes. At the southwest corner of the intersection there is DSRC roadside equipment that is connected to a traffic signal controller. The DSRC unit has three yellow concentric circles around it, representing transmitted data messages. This graphic has a "1" next to the northbound transit vehicle, representing the 1st step of TSP in a connected vehicle environment, which is to approach into the DSRC range. There is a small "2" written in between the transit vehicle and the roadside equipment, representing the 2nd step in the process, which is the transit vehicle broadcasts a SRM with its ETA and the identifier of the lane to enter and egress out of the intersection. There is a small "3" placed in-between the RSE and the traffic signal controller, which is the 3rd step in TSP where the signal controller receives and processes the SRM request.)
Slide 35:
What Information is exchanged for TSP in a CV Environment?
Example:
- The signal controller provides the RSE with the SSM data so the RSE can broadcast a SSM with the status of all SRM requests received
- The RSE broadcasts the SSM. The transit vehicle receives the SSM and travels through the signalized intersection when service is provided
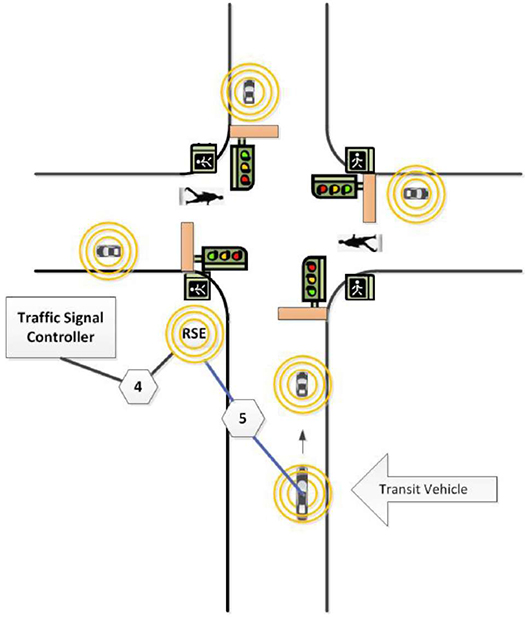
(Extended Text Description: This slide is a continuation of Slide #34, and is the exact same graphic, except without Steps 1 - 3. Also, now a small "4" is drawn between the traffic signal controller and the RSE. This 4th step represents the data from the signal controller to the RSE with the status of all active SRM requests have been received. Last, there is a "5" in-between the RSE and the transit vehicle, showing that the RSE is broadcasting the SSM and the transit vehicle travelling through the intersection when service is provided.)
Slide 36:

Slide 37:
Question
Which ITS standard defines the messages and data elements for a connected vehicle environment?
Answer Choices
- NTCIP 1211 v02
- SAE J2735
- TCIP
- NTCIP 1103
Slide 38:
Review of Answers
a) NTCIP 1211 v02
Incorrect. NTCIP 1211 v02 supports TSP, but not necessarily for a connected vehicle environment
b) SAE J2735
Correct! SAE J2735 was developed specifically to support a CV environment
c) TCIP
Incorrect. TCIP supports transit business, but not necessarily for a CV environment
d) NTCIP 1103
Incorrect. NTCIP 1103 defines the protocols for managing transportation field devices
Slide 39:
Learning Objective 3
Explain the Role of Transit Signal Priority in Integrated Corridors
Slide 40:
Impact of TSP on Integrated Corridor Performance Measures
(Extended Text Description: This slide contains 3 photograph each cropped in an arrow shape, then placed next to one another to create a bigger arrow. The 1st photograph, from left to right, is a top-down view of a congested 4 lane highway in one direction. The next picture is a photograph of a traffic management center, showing shadows of employees watching the cameras and various software systems in the center. The last picture is a photograph of a train next to a 6 lane, 3 lanes in each direction, congested highway.)
What is Integrated Corridor Management (ICM)?
- Optimizes existing transportation infrastructure along a corridor, making transportation investments go further
- Enables travelers to make informed travel decisions and dynamically shift modes during a trip
- Reduces travel time, delays, fuel consumption, emissions and incidents
- Increases travel time reliability and predictability
Slide 41:
Impact of TSP on Integrated Corridor Performance Measures
How can TSP contribute to an ICM?
- Increases transit travel time reliability and predictability
- Can decrease transit travel time, reducing overall delay and making transit more attractive
- Increase capacity of the transit route
- Enforce changes to transit schedules
Slide 42:
Impact of TSP on Integrated Corridor Performance Measures
Examples where TSP contributed to an ICM
- Dallas US 75 ICM
- Minneapolis, MN

Slide 43:
Slide 44:
Question
Which of the following is not a benefit of using TSP in ICM?
Answer Choices
- Decrease travel times
- Improve travel time reliability
- Improve the quality of transit data collected
- Improve throughput and use of transit capacity
Slide 45:
Review of Answers
a) Decrease travel times
Incorrect. TSP can decrease travel time
b) Improve travel time reliability
Incorrect. Travel Time reliability could actually be the most significant benefit of TSP
c) Improve the quality of transit data collected
Correct! The quality of transit data is unrelated to TSP
d) Improve throughput and use of transit capacity
Incorrect. TSP can improve throughput as transit is given priority through the arterial network and can contribute to higher usage of the transit system
Slide 46:
Learning Objective 4
Review Case Studies Where Standards Were Used to Provide Transit Signal Priority
Slide 47:
Slide 48:
Case Study Example - King County Metro (Seattle)
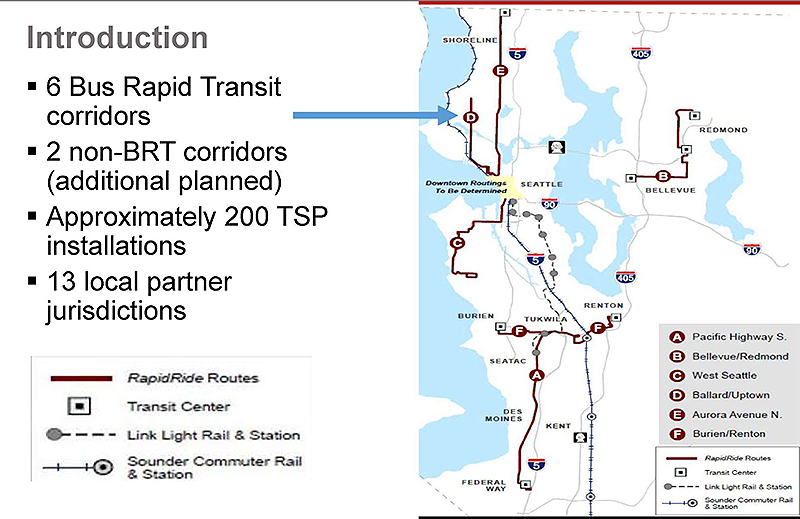
(Extended Text Description: This slide contains a snap shot of a map of King County Metro Bus Rapid Transit corridors in the Seattle, Washington metropolitan area. The map shows the 6 bus rapid transit corridors in red, the location of the transit centers as a square with a dot in the middle, the Link Light Rail route and stations, and the Sounder Commuter Rail route and stations, as well as the interstate and intrastate highways routes. To the left of the map is the following bulleted text:
Introduction
- 6 Bus Rapid Transit corridors
- 2 non-BRT corridors (additional planned)
- Approximately 200 TSP installations
- 13 local partner jurisdictions
Slide 49:
Case Study Example - King County Metro (Seattle)
System Architecture
- Can operate any of the 5 TSP scenarios in TCIP
-
The bus initiates the request based on its location and the location of priority intersection approaches.
- Can be easily changed, based on route or time-of-day
- Accommodates complex strategies such as check-in/check-out and near-side stops
- Transit vehicles communicate directly to the Transit Priority Request Generator (TPRG)
Slide 50:
Case Study Example - King County Metro (Seattle)
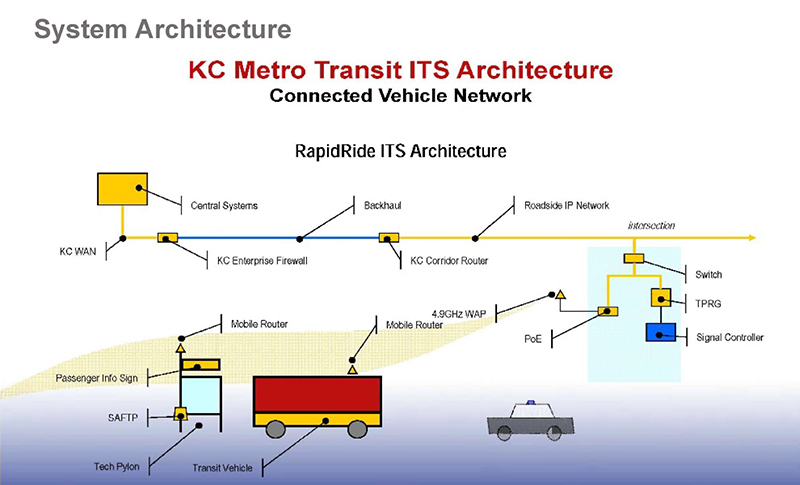
(Extended Text Description: This slide depicts the layout of the King County Metro Transit’s ITS communications architecture, also called the Connected Vehicle Network, and the RapidRide ITS Architecture. Near the top is a horizontal line representing the King County Wide Area Network (WAN). The yellow line connects, from left to right, a large box titled "Central Systems", to a box labeled "KC Enterprise Firewall". From the KC Enterprise Firewall is a blue line, labeled "Backhaul" to a box labeled "KC Corridor Router". From the "KC Corridor Router" is a yellow line, labeled "Roadside IP Network" to a branch labeled "Intersection". On the branch is a box labeled "Switch." Below the Switch are two branches. The right branch has two devices each represented by a box. The first device is a yellow box labeled "TPRG", while the second box at the end of the branch is a blue box labeled "Signal Controller". On the left branch is a yellow box at the end labeled "PoE." At the end of a line extruding from the "PoE" box on the left is a yellow triangle labeled "4.9 GHz WAP". A light yellow object (envelope) projecting from the "4.9 GHz WAP" representing wireless communications. Within the yellow envelope is a small yellow triangle, labeled "Mobile Router" on top of a graphic of a labeled "Transit Vehicle". Also within the yellow envelope is another small yellow triangle, also labeled "Mobile Router" on top of a vertical line representing a pole. Attached to the pole is a yellow rectangle labeled "Passenger Info Sign." At the bottom of the pole is a square labeled "SAFTP" and next to that square is an open square labeled "Tech Pylon.")
Slide 51:
Case Study Example - King County Metro (Seattle)
ITS Standards
- Supports the full TCIP dataset
- Request message: 25 defined fields + 10 user fields. All transmitted, logged, and stored
- Logs phase, PRG action, and priority type
Slide 52:
Case Study Example - King County Metro (Seattle)
Lessons Learned
- Systems engineering process helpful, especially specifications and testing
- TSP algorithms vary between vendors
-
Took advantage of standards
- Use of IP/Ethernet standards made design, implementation, and O&M more cost-effective
- High bandwidth communications do not limit size or frequency of data
Slide 53:
Case Study Example - New York City
Introduction
- 12,400 signalized intersections, nearly all under computer control
- MTA has a fleet of approximately 6,000 buses, approximately 5,000 buses on the street at a time, all with GPS and wireless communications with the transit management center
- Previous trials showed decreases of 15-23% in travel time
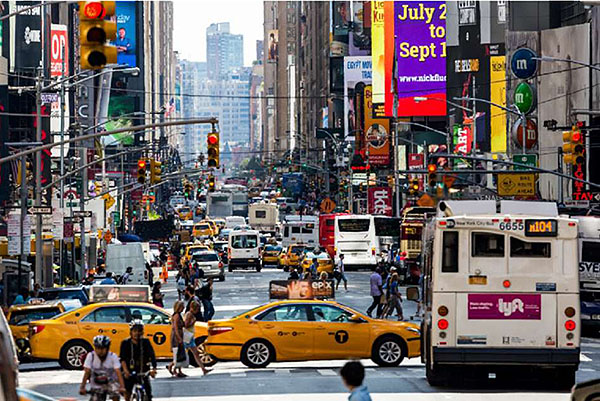
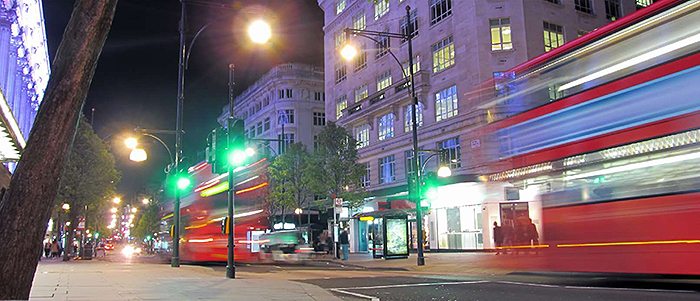
(Extended Text Description: This slide contains a photograph of Times Square in New York City. The street shown is lined with buildings and has several mast arm traffic signals that you can see on each block descending into the distance. There are several yellow taxi cabs, transit vehicles, trucks, vans, and cars. The scene is congested and also has pedestrians walking in every which way. Image Source: thinkstock.com)
Slide 54:
Case Study Example - New York City
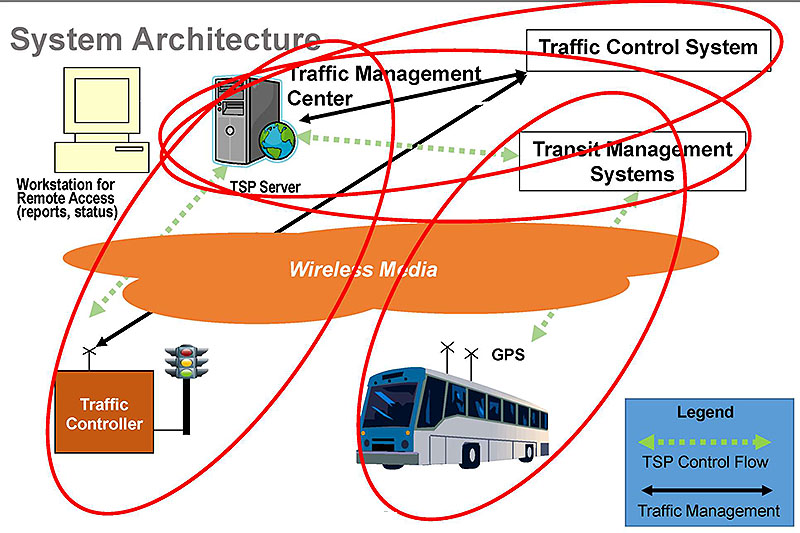
(Extended Text Description: This slide shows graphics that depicts the existing system architecture and the current communications network in New York City for its TSP. Starting with the top left of the slide, there is a desktop computer clip-art titled "Workstation for Remote Access." To its right is a clip-art of a computer tower with a globe next to it titled "TSP server" written underneath it. These two graphics together represent the Traffic Management Center. There is a green dashed, double headed arrow, with one head pointing to the TMC graphics and the other pointing to an orange box with "Traffic Controller" writing inside of it, located at the bottom left corner, which has a traffic signal pole next to it. The traffic controller box has a small antenna on top of it. There is a black solid, double headed arrow, with one arrow head pointing to this antenna and the other pointing to a black outlined square with the words "Traffic Control System" inside of it, located at the upper right corner. There is another solid black double headed arrow point from/to this box from/to the Traffic Management Center Graphics. The Traffic Management Center has another green dashed, double headed arrow pointing from/to itself from/to a black outlined square with "Transit Management Systems" written inside. From this square (TMS) there is a dashed green, double headed arrow pointing from/to a transit vehicle clip-art with two antennas and "GPS" written next to it. In the center of the slide and also all of the clip-arts there is an orange cloud with "Wireless Media" written inside. There are red circles drawn around each of the arrows and what they are connecting to emphasize the instructor’s lesson for this slide. There is a blue square legend in the corner with a green dashed double headed arrow and "TSP Control Flow" written under it. Also inside this legend there is a black solid double headed arrow with "Traffic Management" written under it. Image Source: TransCore ITS.)
Slide 55:
Case Study Example - New York City
ITS Standards
- Already using NTCIP for communications between the TMC and signal controllers.
-
Adopted NTCIP 1211 with extensions
- NOT Conformant to NTCIP 1211
- Priority request: Objects to support latency (absolute time), vehicle speed, vehicle location, intersection identifier, route identifier
- Priority status: intersection identifier, priority response status
Slide 56:
Case Study Example - New York City
Lessons Learned
- Took advantage of existing communications infrastructure
-
Implementation issues with NTCIP 1211 v01
-
Communications network latency has an impact
- Function of the communications network
- High latency can impact operations
-
Was addressed in NTCIP 1211 v02
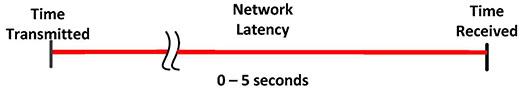
(Extended Text Description: In the middle of the slide is a timeline. At the left end of the red, horizontal timeline is a vertical line, labeled "Time Transmitted." At the middle of a timeline is a break to indicate variable time. Above the timeline is a label, "Network Latency," and below the timeline is another label, "0 - 5 seconds." At the right end of the timeline is a vertical line, labeled "Time Received.")
-
Clock source
- Can be an issue if the time for a component has a different source (e.g., GPS, Coordinated Universal Time, electrical power grid)
-
Communications network latency has an impact
Slide 57:
Case Study Example - Chicago
Introduction
Regional Transit Signal Priority Implementation Program (RTSPIP)
- Goal: Develop and implement a regional TSP system for Metropolitan Chicago
- $40 million, with 100 miles of roadway, 400 intersections, 13 arterial corridors and 4 counties
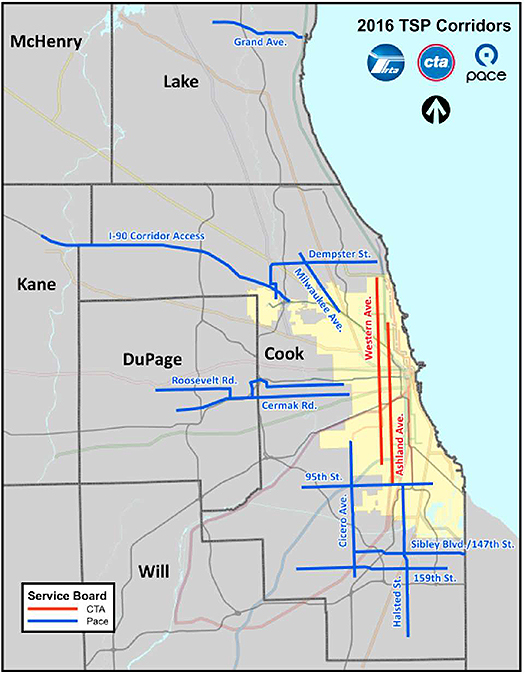
(Extended Text Description: Relevant author’s notes: This slide shows a snap shot of a map of Greater Chicago with CTA transit routes with transit signal priority in red and Pace (a suburban transit provider) transit routes with transit signal priority in blue, extending through and outside Chicago and to the west on different routes with the goal to develop and implement a regional TSP system that works for both CTA and Pace buses in the Chicago Metropolitan region. $40 million, 5-year program (2013-2017) involving 100 miles of roadway, 400 intersections, 13 arterial corridors, and 4 counties.)
Slide 58:
Case Study Example - Chicago
Introduction
Previous demonstrations yielded benefits
- Improved schedule adherence
- Reduced travel time - up 15% reduction
- However, difficult to evaluate performance
Developed Regional Open Standards
- Not tied to a single TSP vendor
- Simplify Operations and Maintenance (O&M)
- Centralized monitoring of TSP activity
Slide 59:
Case Study Example - Chicago
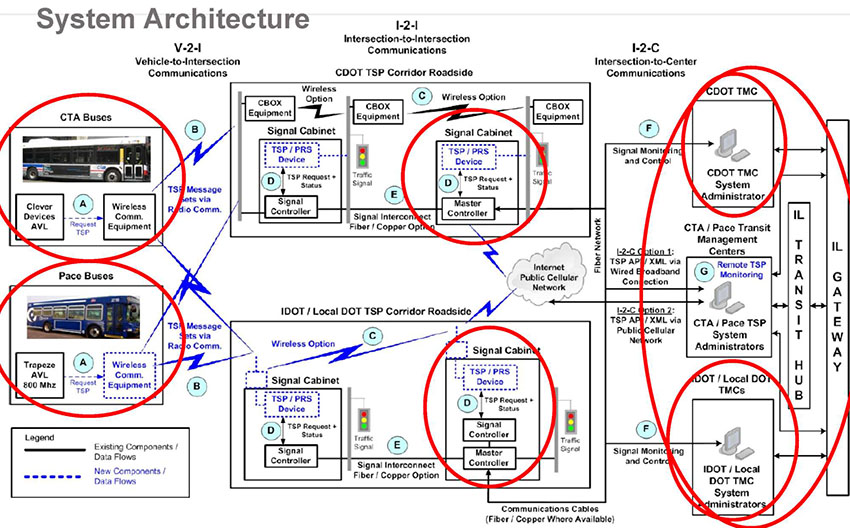
(Extended Text Description: This slide depicts the system architecture for the RTSPIP. At the bottom left corner is a legend. The legend is a black line labeled Existing Components / Data Flows, and a blue dotted line labeled New Components / Data Flows. Across the top of the graphic are labels, V-2-I Vehicle-to-Intersection on the left, I-2-I Intersection-to-Intersection Communications in the middle, and I-2-C Intersection-to-Center Communications on the right. Below the labels are two rows of boxes. On the left, top row is a box labeled "CTA Buses." Within the box is a photograph of a CTA Bus on top and below the photograph is a box labeled Clever Devices AVL and a second box next to it labeled Wireless Comm. Equipment. There is a blue dashed line with an arrow labeled "Request TSP" from the Clever Devices AVL box to the Wireless Comm. Equipment box. On the left, bottom row is a box labeled "Pace Buses." Within the box is a photograph of a Pace Bus on top and below the photograph is a box labeled Trapeze AVL 800 MHz and a second box, with blue dashes, next to it labeled Wireless Comm. Equipment. There is a blue dashed line with an arrow labeled "Request TSP" from the Trapeze AVL 800 MHz box to the Wireless Comm. Equipment box. There are two Roadside boxes in the middle of the diagram, and blue radio lines from both the CTA Buses and Paces Buses boxes to both Roadside boxes. The radio lines, in the shape of lightning, indicates radio communications from both Buses to both boxes, and the radio lines are labeled "TSP Message Sets via Radio Comm."
The middle box on the top row is labeled "CDOT TSP Corridor Roadside." Within the box is three poles with a box at the top of each pole labeled "CBOX Equipment." Between each of the CBOX Equipment boxes is a black radio line labeled "Wireless Option." Between the left and middle pole is a box labeled "Signal Cabinet." With the Signal Cabinet box are two boxes, one above another. The top box is a blue, dashed line labeled "TSP / PRS Device" while the lower box is a black solid line labeled "Signal Controller." There is a two-headed black arrow between the upper and lower box labeled "TSP Request + Status." The signal cabinet box is mounted on the middle pole. Also attached to the middle pole is a traffic signal head, with a red, yellow, and green heads. A box and traffic signal head are also mounted on the third pole. This box is also labeled "Signal Cabinet" with two boxes within it, one above another. The top box is a blue, dashed line labeled "TSP / PRS Device" while the lower box is a black solid line labeled "Master Controller." There is a two-headed black arrow between the upper and lower box labeled "TSP Request + Status." There is a black line labeled "Signal Interconnect Fiber / Copper Option" between the Signal Controller within the first Signal Cabinet and the Master Controller in the second Signal Cabinet. The middle box on the bottom row is labeled "IDOT / Local DOT TSP Corridor Roadside." Within the box are two poles, and on each pole is a traffic signal head and a box labeled "Signal Cabinet" mounted on the pole. Within the "Signal Cabinet" on the left are two boxes, one above another. The top box is a blue, dashed line labeled "TSP / PRS Device" while the lower box is a black solid line labeled "Signal Controller." There is a two-headed black arrow between the upper and lower box labeled "TSP Request + Status." Within the "Signal Cabinet" on the right are three boxes, one above another. The top box is a blue, dashed line labeled "TSP / PRS Device," the middle box is a black solid line labeled "Signal Controller," and the bottom box is a black solid line labeled "Master Controller."
There is a two-headed black arrow between the upper and middle box labeled "TSP Request + Status" and there is a black solid line between the Signal Controller and Master Controller. There is also a black solid line between Signal Controller in the other Signal Cabinet and the Master Controller, and that line is labeled "Signal Interconnect Fiber / Copper Option." Between each of the poles is a blue radio line labeled "Wireless Option." Between the middle boxes is a cloud labeled "Internet Public Cellular Network." There are a blue radio lines between the right-most Signal Cabinet in both middle boxes to the "Internet Public Cellular Network" cloud. On the right side of the overall graphic are three Management Center boxes, one above another, representing centers. The top box is labeled "CDOT TMC" and within the box is a graphic of a workstation with a keyboard labeled "CDOT TMC System Administrator." The middle box is labeled "CTA / Pace Transit Management Centers" and within the box is a graphic of a workstation with a keyboard labeled "CTA / Pace TSP System Administrators" and separately, in blue letters, "Remote TSP Monitoring." The bottom box is labeled "IDOT / Local DOT TMCs" and within the box is a graphic of a workstation with a keyboard labeled "IDOT / Local DOT TMC System Administrators." Between the Master Controller of each Roadside box (CDOT TSP Corridor Roadside and IDOT / Local DOT TSP Corridor Roadside) and each Management Center (CDOT TMC, CTA / Pace Transit Management Centers, IDTO / Local DOT TMCs) box is a black line labeled "Communications Cables (Fiber / Copper Where Available)" representing the communications network between the roadside and the centers. The branch entering the CDOT TMC is labeled "Signal Monitoring and Control," the branch entering the IDOT / Local DOT TMCs is labeled "Signal Monitoring and Control" also, and entering the CTA / Pace Transit Management Centers is labeled "I-2-C Option 1: TSP AP / XML via Wired Broadband Connection." There is also a black solid line between the Internet Public Cellular Network cloud and the CTA / Pace Transit Management Centers labeled "I-2-C Option 2: TSP AP / XML via Public Cellular Network." This slide represents the system architecture for the MMITSS system. The graphic consists of 3-dimensional boxes. On top, in blue, is a box labeled "Security Certificate Server (USDOT SCMS)". There is a line, labeled "IPV6," to a cream-colored box, labeled "RSE Radio" below it. To the right of the RSE Radio is another cream-colored box labeled "OBE" with an arrow from the RSE Radio to the OBE labeled "DSRC Service Channel 182" and an arrow from the OBE to the RSE Radio labeled "DSRC Channel 172." To the left of the RSE Radio is another cream-colored box labeled "Nomadic Device" with a line, labeled wireless (DSRC, WiFi) between them. Slightly above and between the RSE Radio and the Nomadic Device are two orange-colored boxes labeled, from the left, "NomadicTravelerServer" and "MMITSS Central System.")
Slide 60:
Case Study Example - Chicago
ITS Standards
- Determined stakeholder needs
- Developed regional message set
- Based on NTCIP 1211 v01.38 and leveraged SAE J2735_200912
- Updated dialog definitions
- Developed test tools to verify correct usage of data objects
- Proprietary node for object extensions
Slide 61:
Case Study Example - Chicago
ITS Standards
Object Extensions
- priorityRequestVehicleID_chi
- priorityRequestTSPPhaseRequired_chi
- priorityRequestVehicleLatitude_chi
- priorityRequestVehicleLongitude_chi
- priorityReqestAgencyID_chi
- priorityRequestScheduleLateness_chi
- priorityRequestRouteID_chi
- priorityRequestRunNumber_chi
- priorityRequestVehicleOccupancy_chi
Slide 62:
Case Study Example - Chicago
Lessons Learned
- Developed a flexible system architecture
- Lots of agencies / but cooperation has been great
- Field data is cumbersome but AVL data is promising
- Many traffic signal controllers are dated but testing new Advanced Traffic Controllers
- Intersection-to-Center communication is limited but TSP could help fill some communication gaps
Slide 63:
Case Study Example - MMITSS
Introduction
Multi-Modal Intelligent Traffic Signal Systems Goals
- Develop a comprehensive traffic signal system that services multiple modes of transportation in a connected vehicle environment
Two locations
- Arizona Connected Vehicle Test Bed
- California Test Network
Slide 64:
Case Study Example - MMITSS
System Architecture
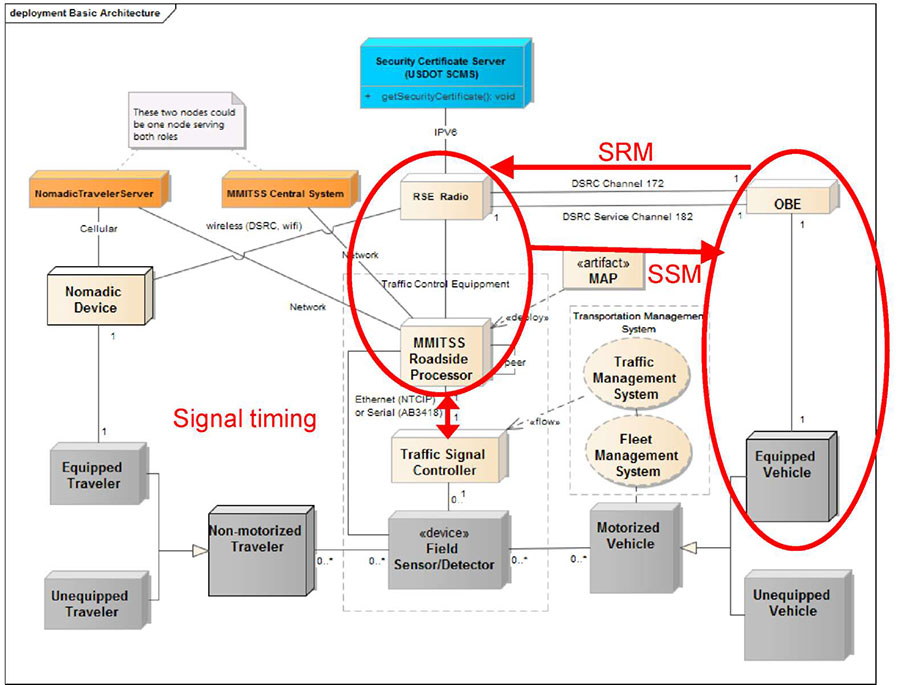
(Extended Text Description: This slide represents the system architecture for the MMITSS system. The graphic consists of 3-dimensional boxes. On top, in blue, is a box labeled "Security Certificate Server (USDOT SCMS)". There is a line, labeled "IPV6," to a cream-colored box, labeled "RSE Radio" below it. To the right of the RSE Radio is another cream-colored box labeled "OBE" with an arrow from the RSE Radio to the OBE labeled "DSRC Service Channel 182" and an arrow from the OBE to the RSE Radio labeled "DSRC Channel 172." To the left of the RSE Radio is another cream-colored box labeled "Nomadic Device" with a line, labeled wireless (DSRC, WiFi) between them. Slightly above and between the RSE Radio and the Nomadic Device are two orange-colored boxes labeled, from the left, "NomadicTravelerServer" and "MMITSS Central System." Above these two boxes is a note, "These two nodes could be one node serving both roles," with a dotted line pointing to these boxes. There is a cream-colored box in the middle of the graphic labeled "MMITSS Roadside Processor" with a line, labeled "Network" to the NomadicTravelerServer and the MMITSS Central System. There is also a line to the RSE Radio. There is a cream-colored box below MMITSS Roadside Processor labeled "Traffic Signal Controller" with a line between them labeled "Ethernet (NTCIP) or Serial (AB3418)." Below the Traffic Signal Controller is a grey-colored box labeled "<<device>> Field Sensor/Detector" with a line between them. The MMITSS Roadside Processor, Traffic Signal Controller and Field Sensor/Detector are contained within a light, dashed box labeled "Traffic Control Equipment." There is a cream-colored box labeled "<<artifact>>MAP" to the right and above MMITSS Roadside Processor, with an arrow labeled "Deploy" from the MAP to the MMITSS Roadside Processor. Under the MAP are two cream-colored circles, labeled from the top "Traffic Management System" and "Fleet Management System." The two circles are within a light, dashed box labeled "Traffic Management System." There is dashed line between the two circles, and a dashed arrow, labeled <flow> pointing from the Traffic Management System to Traffic Signal Controller. Below the Fleet Management System is a grey-colored box labeled "Motorized Vehicle" with a dashed line between them. The Motorized Vehicle also has a line between it and Field Sensor/Detector. To the right of the Motorized Vehicle are two grey-colored boxes on top of another labeled "Equipped Vehicle" on top and "Unequipped Vehicle," with both boxes having an arrow pointing to the Motorized Vehicle. There is also a line between the OBE and Equipped Vehicle. Below the Nomadic Device are two grey-colored boxes on top of another labeled "Equipped Traveler" on top and "Unequipped Traveler." There is a line between the Nomadic Device and the Equipped Traveler. The Equipped Traveler and the Unequipped Traveler both have an arrow that point to a grey-colored box labeled "Non-motorized Traveler" to the right. There is a line between the Non-motorized Traveler to the Field Sensor/Detector. The OBE and the Equipped Vehicle are circled in red as an animation is the RSE Radio and MMITSS Roadside Processor to show the instructor’s focus on these components. There is also a red arrow animation labeled "Signal Timing" between the MMITSS Roadside Processor and Traffic Signal Controller; a red arrow animation labeled "SRM" between the OBE and the RSE Radio; and a red arrow animation labeled "SSM" between the RSE Radio and OBE.)
Slide 65:
Case Study Example - MMITSS
ITS Standards
-
Adopted SAE J2735_200911
- SRM and SSM
- MAP and SPAT
- Modified SSM to acknowledge receipt of an SRM
- Used NTCIP 1202 to exchange information between the RSE and the signal controller (with extensions)
Slide 66:
Case Study Example - MMITSS
Lessons Learned
Independent analysis found that MMITSS applications effectively:
- Improved vehicle travel time and travel time reliability
-
Reduced delay for equipped vehicles (including transit) on the test facility
- Reduced delay for equipped transit vehicles by 8.2%
- Opinion of the evaluators: MMITSS appears to be effective in allowing system managers to allocate and prioritize system capability/mobility but may not always reduce delay or aggregate system performance
Slide 67:
Slide 68:
Question
How can ITS standards be used in TSP implementations?
Answer Choices
- Extensions to an ITS standard can be used to satisfy a need not supported by the ITS standards
- NTCIP 1211 v02, TCIP and SAE J2735 must be used in TSP implementations to conform to TSP standards
- All messages and objects defined in the standard must be used to conform
- An implementation is allowed to support only one of the system architectures defined in the standard
Slide 69:
Review of Answers
a) Extensions to an ITS standard can be used to satisfy a need not supported by the ITS standards
Correct! The ITS standards allow an implementation to define an extension if the user need is not supported by the standard
b) NTCIP 1211 v02, TCIP and SAE J2735 must be used in TSP implementations to conform to TSP standards
Incorrect. All 3 standards do not need to be used to conform
c) All messages and objects defined in the standard must be used to conform
Incorrect. The standards do not require that all messages and data elements be supported
d) An implementation is allowed to support only one of the system architectures defined in the standard
Incorrect. An implementation may support more than one system architecture defined in a standard, or use a system architecture not defined in the standard
Slide 70:
Module Summary
What We Have Learned
- How to identify requirements that are to be tested and how to test a standards-based TSP implementation.
- Define what a connected vehicle environment is and what information is exchanged in regards to TSP.
- Understand and explain the impact of TSP on integrated corridor performance measures.
- Take away knowledge from each of the case studies reviewed on how to correctly use standards to execute TSP.
Slide 71:
Thank you for completing this module.
Feedback
Please use the Feedback link below to provide us with your thoughts and comments about the value of the training.
Thank you!