ITS Transit Standards Professional Capacity Building Program
Module 5: Transit Management Standards, Part 2 of 2
HTML of the PowerPoint Presentation
(Note: This document has been converted from a PowerPoint presentation to 508-compliant HTML. The formatting has been adjusted for 508 compliance, but all the original text content is included, plus additional text descriptions for the images, photos and/or diagrams have been provided below.)
Slide 1:
(Extended Text Description: Welcome - Graphic image of introductory slide. A large dark blue rectangle with a wide, light grid pattern at the top half and bands of dark and lighter blue bands below. There is a white square ITS logo box with words "Standards ITS Training" in green and blue on the middle left side. The word "Welcome" in white is to the right of the logo. Under the logo box is the logo for the U.S. Department of Transportation, Office of the Assistant Secretary for Research and Technology.)
Slide 2:
(Extended Text Description: This slide, entitled "Mac Lister" has a photo of Mac Lister, Program Manager Knowledge and Technology Transfer, ITS Joint Program Office, on the left hand side, with his email address, Mac.Lister@dot.gov. A screen capture snapshot of the home webpage is found on the right hand side - for illustration only - from August 2014. Below this image is a link to the current website: www.its.dot.gov/pcb - this screen capture snapshot shows an example from the Office of the Assistant Secretary for Research and Development - Intelligent Transportation Systems Joint Program Office - ITS Professional Capacity Building Program/Advanced ITS Education. Below the main site banner, it shows the main navigation menu with the following items: About, ITS Training, Knowledge Exchange, Technology Transfer, ITS in Academics, and Media Library. Below the main navigation menu, the page shows various content of the website, including a graphic image of professionals seated in a room during a training program. A text overlay has the text Welcome to ITS Professional Capacity Building. Additional content on the page includes a box entitled What's New and a section labeled Free Training. Again, this image serves for illustration only. The current website link is: https://www.its.dot.gov/pcb.)
Slide 3:
(Extended Text Description: This slide, entitled "Jeffrey Spencer" has a photo of Jeffrey Spencer, ITS Team Leader, Federal Transit Administration, Office of Research, Demonstration and Innovation, on the left hand side, with his email address, Jeffrey.Spencer@dot.gov. A screen capture snapshot of the home webpage is found on the right hand side - for illustration only - which is the same screen snapshot from Slide 2. Below this image and to the right is the Federal Transit Administration (FTA) logo.)
Slide 4:
ITS Transit Standards Professional Capacity Building Program
Module 5:
Transit Management Standards, Part 2 of 2
Slide 5:

Slide 6:
Instructor

Carol L. Schweiger
President
Schweiger Consulting LLC
Wakefield, MA
Slide 7:
Target Audience
- Transit agency technical staff in planning, operations, maintenance, and information technology
- Technology vendors and consultants
- Transit agency procurement and grants staff (optional)
Slide 8:
Recommended Prerequisite(s)
| Decision-Maker | Project Manager | Project Engineer | |
|---|---|---|---|
| Module 1: Introduction to ITS Transit Standards | N/A | ✓ | ✓ |
| Module 2: Transit Management Standards, Part 1 of 2 | N/A | ✓ | ✓ |
-
Recommend prior knowledge includes:
- Basic understanding of transit-related portions (e.g., Service Packages) of the National ITS Architecture
- Basic knowledge of systems engineering, which can be found in the National Transit Institute (NTI) course on Systems Engineering for Transit ITS Projects
Slide 9:
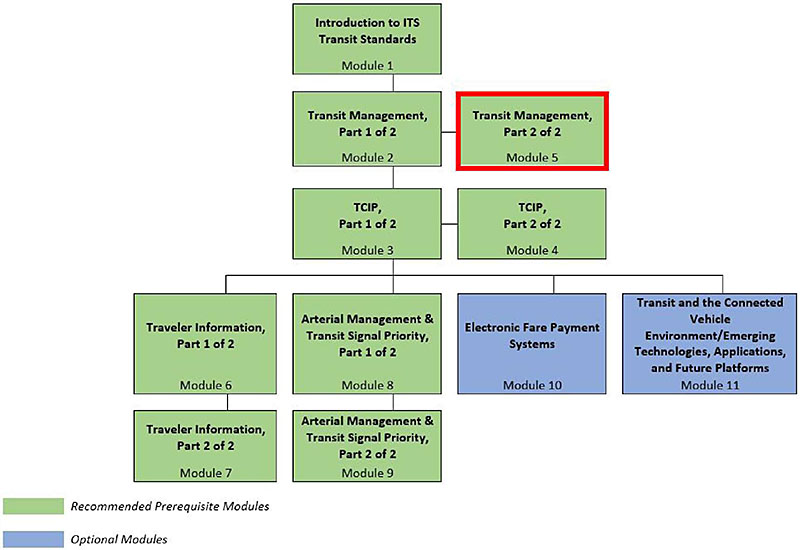
Curriculum Path (Project Manager)
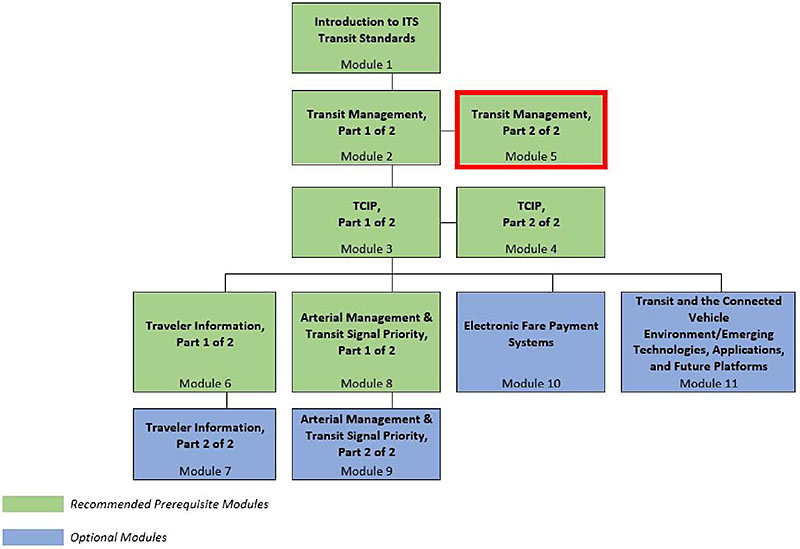
(Extended Text Description: Curriculum Path for Project Manager: A graphical illustration indicating the sequence of training modules and where this module fits in. Each module is represented by a box with the name of the module in it and a flow chart showing the logical flow of the modules with the current module boxed in red. The first three horizontally sequenced boxes are green, which means that it is a Recommended Prerequisite Module. The first box is "Introduction to ITS Transit Standards, Module 1." Below that, connected by a line, is a box with the text "Transit Management, Part 1 of 2." To the right of this box, is "Transit Management, Part 2 of 2," which is outlined in red. Below "Transit Management, Part 1 of 2", connected by a line, is a box with the text "TCIP, Part 1 of 2." To the right of this box, is "TCIP, Part 2 of 2." Below "TCIP, Part 1 of 2," the lines branch out into four boxes that are horizontally sequenced. The first two: "Traveler Information, Part 1 of 2" and "Arterial Management & Transit Signal Priority, Part 1 of 2" are green; the other two: "Electronic Fare Payment Systems," and "Transit and the Connected Vehicle Environment/Emerging Technologies, Applications, and Future Platforms" are blue. Blue indicates that the module is optional. Below "Traveler Information, Part 1 of 2," is the text box "Traveler Information, Part 2 of 2 coded in blue. Below "Arterial Management & Transit Signal Priority, Part 1 of 2", is the text box "Arterial Management & Transit Signal Priority, Part 2 of 2," coded in blue.)
Slide 10:
Curriculum Path (Project Engineer)
(Extended Text Description: Curriculum Path for Project Engineer: A graphical illustration indicating the sequence of training modules and where this module fits in. Each module is represented by a box with the name of the module in it and a flow chart showing the logical flow of the modules with the current module boxed in red. The first three horizontally sequenced boxes are green, which means that it is a Recommended Prerequisite Module. The first box is "Introduction to ITS Transit Standards, Module 1." Below that, connected by a line, is a box with the text "Transit Management, Part 1 of 2." To the right of this box, is "Transit Management, Part 2 of 2," which is outlined in red. Below "Transit Management, Part 1 of 2", connected by a line, is a box with the text "TCIP, Part 1 of 2." To the right of this box, is "TCIP, Part 2 of 2." Below "TCIP, Part 1 of 2," the lines branch out into four boxes that are horizontally sequenced. The first two: "Traveler Information, Part 1 of 2" and "Arterial Management & Transit Signal Priority, Part 1 of 2" are green; the other two: "Electronic Fare Payment Systems," and "Transit and the Connected Vehicle Environment/Emerging Technologies, Applications, and Future Platforms" are blue. Blue indicates that the module is optional. Below "Traveler Information, Part 1 of 2," is the text box "Traveler Information, Part 2 of 2 coded in green. Below "Arterial Management & Transit Signal Priority, Part 1 of 2", is the text box "Arterial Management & Transit Signal Priority, Part 2 of 2," coded in green.)
Slide 11:
Learning Objectives
- Summarize key concepts from Transit Management Standards, Part 1 of 2.
- Illustrate the structure and use of data exchange standards for Transit Management systems.
- Select appropriate ITS standards for data exchange among Transit Management systems, and between Transit Management systems and Traveler Information, Fare Collection, and other systems (e.g., Traffic Management systems).
- Illustrate how to apply standards to the development of procurement specifications.
Slide 12:
Learning Objective #1: Summarize Key Concepts from Transit Management Standards, Part 1 of 2
- Transit Management taxonomy and technologies
- Relationships and information exchanges among Transit Management technologies
- Using systems engineering (SE)
- National ITS Architecture Service Packages related to Transit Management
Slide 13:
Learning Objective #1
Fleet Operations and Management
| Category | System/Technology | Dependent on |
|---|---|---|
| Fleet Operations and Management | Communications technologies | Public/private voice and data communication backbones |
| Computer-aided dispatch (CAD) | Voice and data communications technologies Automatic vehicle location (AVL) system Route and vehicle schedule data | |
| Automatic vehicle location (AVL) | Data communications technologies Global positioning system (GPS) or other location enabling technologies, such as Wi-Fi | |
| Automatic passenger counters (APCs) | AVL system Route and vehicle schedule data | |
| Scheduling (fixed-route and paratransit) systems | Stop database (contains data such as stop name, location, routes that stop at this stop, direction of travel from this stop, list of amenities available at this stop) |
Slide 14:
Learning Objective #1
Fleet Operations and Management (cont.)
| Category | System/Technology | Dependent on |
|---|---|---|
| Fleet Operations and Management | Transfer connection protection (TCP) | AVL system CAD system |
| Transit signal priority (TSP) | AVL system CAD system (when TSP used based on schedule adherence status) Roadside signal infrastructure | |
| Yard management | Indoor positioning systems (e.g., radio frequency identification [RFID]-based, Wi-Fi-based) | |
| Intelligent vehicle technologies (e.g., collision warning and precision docking) | Varies by technology application and deployment | |
| Lane control technologies | AVL system CAD Virtual mirror Lane guidance systems Roadside signal infrastructure |
Slide 15:
Learning Objective #1
Example of Central System Technology Relationships
Main Point: Shows the relationships among central Transit Management and other transit ITS technologies.
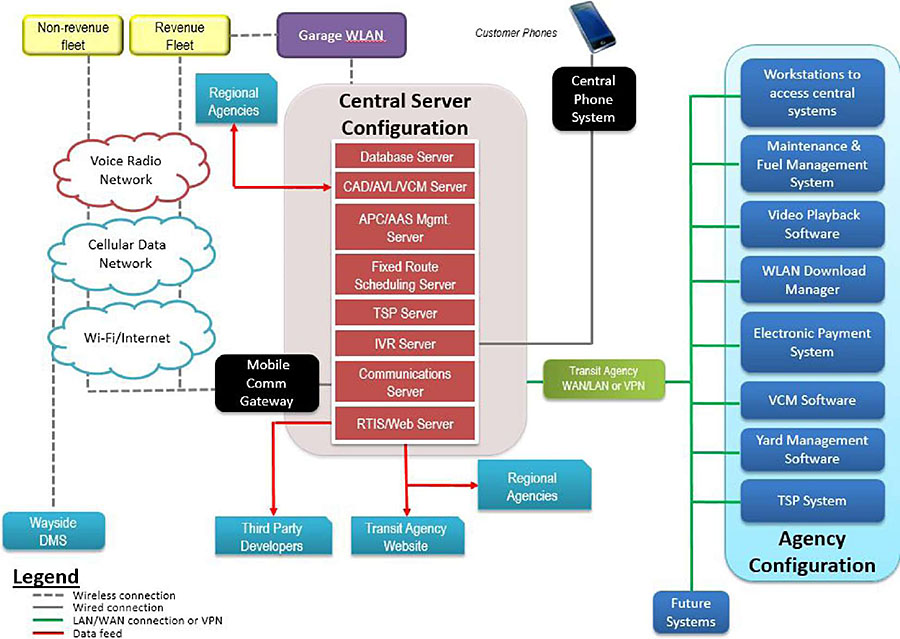
(Extended Text Description: Author's relevant notes: Example of Central System Technology Relationships: This graphic shows the relationships among various Central System Technologies. Beginning in the center of the graphic, there is a red rectangular column representing the Central Server Configuration. In this column the following servers are represented in individual blocks from top to bottom: Database Server, CAD/AVL (Computer Aided Dispatch and Automatic Vehicle Location) Server, APC/ASA Mgmt. Server, Fixed Route Scheduling Server, TSP Server, IVR Server, Communications Server, and RTIS/Web Server. From the IVR Server, there is a gray line representing a wired connection that leads to a black box labeled "Central Phone System" with a smart phone icon above it. From the RTIS/Web Server, a red line representing data feed points down to a blue box labeled "Transit Agency Website." Coming from the left side of the RTIS/Web Server is another line pointing to blue box labeled "Third Party Developers." From the left side of the Communications Server, there is a dotted gray line that goes to a black box labeled "Comm Gateway" and branches upwards through three cloud networks (bottom to top: the Wi-Fi/Internet, Cellular Network, and Radio systems), going on to two separate yellow boxes. These boxes are labeled "Revenue Fleet" and "Non-revenue Fleet." From the Cellular network cloud, there is another dotted gray line going downwards representing the wireless connection to the Wayside DMS. Coming from the entire Central Server Configuration, there is a solid green line representing the LAN/WAN connection or VPN. This line goes through a light green box labeled "Transit Agency WAN and LAN" and branches out to a light blue section identified as the "Agency Configuration." Within the "Agency Configuration," the following items are represented in individual dark blue boxes (top to bottom): Electronic Payment System, Maintenance Management System, Video Playback Software, WLAN Download Manager, and Workstations to access central systems, VCM Software, and TSP System. Outside the "Agency Configuration," the LAN/WAN connection also leads to a dark blue box labeled as "Future Systems."))
Slide 16:
Learning Objective #1
Example of On-board Technology Relationships
Main Point: Shows the relationships among on-board Transit Management technologies
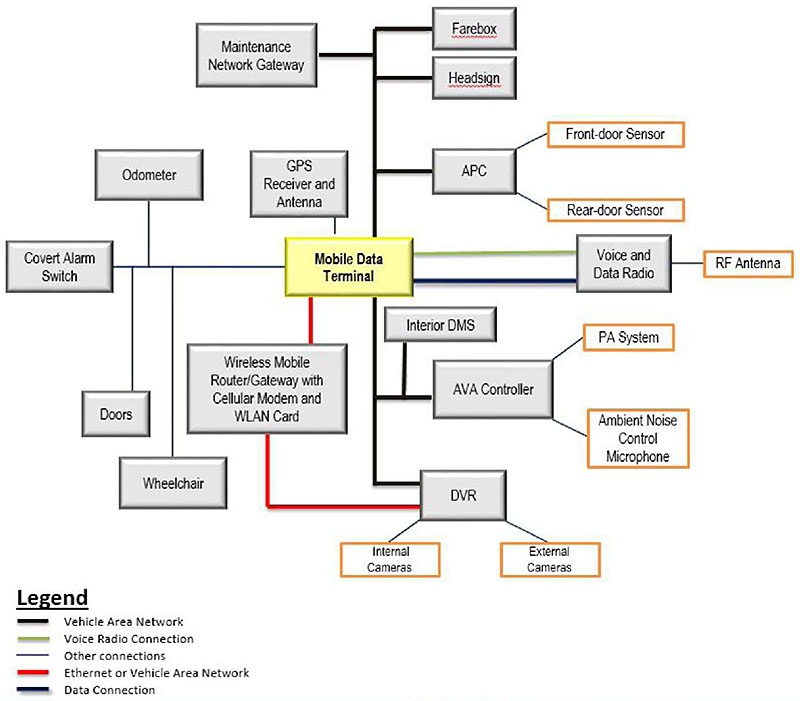
(Extended Text Description: Author's relevant notes: Example of Onboard Technology Relationships: This graphic shows an example of the relationships among various ITS technologies onboard a vehicle. In the center of the diagram is a box labeled MDT (Mobile Data Terminal). Coming from the top of MDT, is a box labeled "GPS Receiver and Antenna" connected via a voice radio connection. Connected to the MDT via a vehicle area network are the Maintenance Network Gateway, farebox, headsign and APC. The APC is connected to the front-door sensor and rear-door sensor via an alternative link. Utilizing both a Voice Radio Connection and a Data Connection, the MDT is connected to the Voice and Data Radio. This is then connected to the RF antenna. Connected by another vehicle area network are the Interior DMS, the ASA Controller, and the DVR. The ASA controller is then connected to the PA System and Ambient Noise Control Microphone. The DVR is connected to internal and external cameras. Coming from the bottom of the MDT rectangle is a red line representing an Ethernet link. This link connects a Wireless Mobile Router/Gateway with cellular modem and WLAN card. This link continues and also connects to the DVR. To the left, the MDT is also connected to the following: Collision Avoidance, Odometer, Covert Alarm Switch, Doors, and Wheelchair.))
Slide 17:
Learning Objective #1
Safety and Security
| Category | System/Technology | Dependent on |
|---|---|---|
| Safety and Security | Fixed video surveillance | Data communications technologies |
| Covert emergency alarm and covert live audio monitoring | Voice and data communication technologies CAD system AVL system | |
| On-board digital video surveillance | No dependence on other systems | |
| G-force monitoring | AVL system |
Slide 18:
Learning Objective #1
Maintenance
| Category | System/Technology | Dependent on |
|---|---|---|
| Maintenance | Engine and drivetrain systems monitoring | OBD-II or Society of Automotive Engineers (SAE) J1708/J1939 compatibility of on-board computers within engine and drivetrain |
| Maintenance software to schedule and track scheduled and unscheduled maintenance activities, and manage parts inventory | No dependence on other systems | |
| Fuel Management System | No dependence on other systems |
Slide 19:
Learning Objective #1
Data Management
| Category | System/Technology | Dependent on |
|---|---|---|
| Other | Enterprise database/ datawarehouse and reporting | Open databases Data dictionary |
| Technology integration | Multiple dependencies | |
| Geographic information system (GIS) application | Spatial data recording and management systems | |
| Service coordination facilitated by technology | CAD/AVL systems shared across participants Voice and data communications technologies | |
| Open data for third-party application development | Standard format for data such as General Transit Feed Specification (GTFS) and GTFS-realtime |
Slide 20:
Learning Objective #1
What Is the "Vee" Model
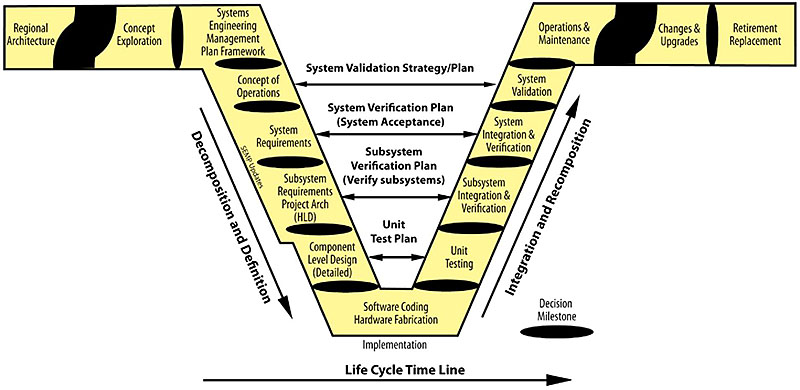
(Extended Text Description: Detailed Vee Diagram: This is an image that describes the V model of the Systems Engineering Process Life Cycle. The left side of the V represents concept development and the decomposition and definition of requirements into function and physical entities that can be architected, designed, and developed. The right side of the V represents integration and re-composition of these entities (including appropriate testing to verify that they satisfy the requirements) and their ultimate transition into the field, where they are operated and maintained. Each step in the life cycle is delineated by a decision gate. Starting from the left wing of the V and working down the V across the life cycle time line, it is broken into Regional Architecture, Concept Exploration, Systems Engineering Management Plan Framework, Concept of Operations, System Requirements, Subsystem Requirements Project Arch (HLD), Component Level Design and finally Software Coding Hardware Fabrication at the bottom of the V. Working up the V on the right side includes Unit Testing, Subsystem Integration & Verification, System Integration & Verification, System Validation, Operations & Maintenance, Changes & Upgrades and finally Retirement Replacement. There is a pullout box on the left side labeled Cost Cutting Activities with the listed elements underneath: Stakeholder Involvement, Elicitation, Project Management, Risk Management, Metrics, Configuration Management, Interface Management, Process Improvement, Decision Gates, Trade Studies, Technical Reviews, and Traceability.)
Slide 21:
Learning Objective #1
Service Packages (SPs)
- Represent slices of physical architecture
- Collect subsystems, equipment packages and architecture flows that provide desired service
-
There are 11 public transportation SPs:
- Transit Vehicle Tracking
- Transit Fixed-Route Operations
- Demand Response Transit Operations
- Transit Fare Collection Management
- Transit Security
Slide 22:
Learning Objective #1
Service Packages (SPs) (cont.)
(11 public transportation SPs cont.):
- Transit Fleet Management
- Multimodal Coordination
- Transit Traveler Information
- Transit Signal Priority
- Transit Passenger Counting
- Multimodal Connection Protection
Slide 23:
Learning Objective #1
Transit Management Service Package Example
Main Point: An example of one transit SP diagram
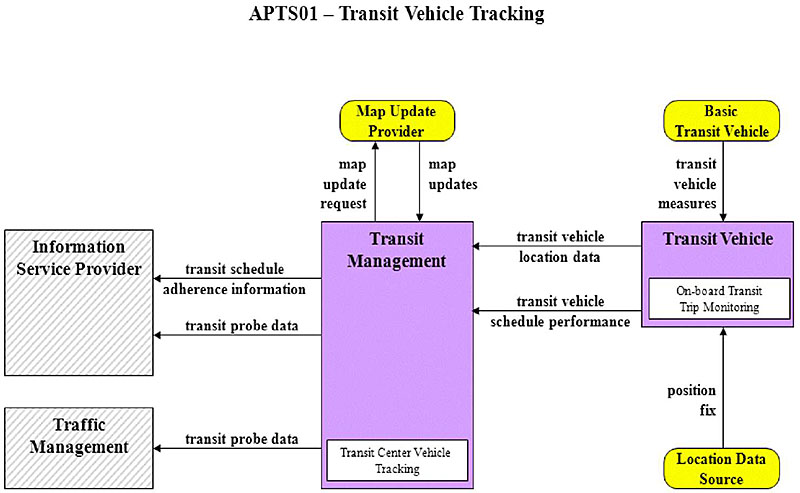
(Extended Text Description: Author's relevant notes: Transit Management Service Package Example: This graphic has a rectangular box in the center which is labeled Transit Management and is purple in color. Within Transit Management is another smaller rectangle labeled Transit Center Vehicle Tracking and is white in color. Above the Transit Management box is an oval labeled Map Update Provider, which is yellow in color. There is a line with an arrow from Transit Management to the Map Update Provider oval, which is labeled "map update request." There is a line with an arrow from the Map Update Provider oval to Transit Management, which is labeled "map updates." To the right of Transit Management is a rectangle labeled Transit Vehicle, which is purple in color. Inside Transit Vehicle is another smaller rectangle labeled On-board Transit Trip Monitoring, which is white in color. Above the Transit Vehicle box is an oval labeled Basic Transit Vehicle, which is yellow in color. There is a line with an arrow from the Basic Transit Vehicle oval to Transit Vehicle, which is labeled "transit vehicle measures." There are two lines with arrows from Transit Vehicle to Transit Management, which are labeled "transit vehicle location data" and "transit vehicle schedule performance." Below the Transit Vehicle box is an oval labeled Location Data Source, which is yellow in color. There is a line with an arrow from the Location Data Source oval to Transit Vehicle, which is labeled "position fix." To the left of Transit Management is a rectangle labeled Information Service Provider, which is white in color with cross-hatching. Below the Information Service Provider box is a box labeled Traffic Management, which is white in color with cross-hatching. There are two lines with arrows from Transit Management to Information Service Provider, which are labeled "transit schedule adherence information" and "transit probe data." There is a line with an arrow from Transit Management to Traffic Management, which is labeled "transit probe data." This service package monitors current transit vehicle location using an Automated Vehicle Location System. The location data may be used to determine real time schedule adherence and update the transit system's schedule in real-time. Vehicle position may be determined either by the vehicle (e.g., through GPS) and relayed to the infrastructure or may be determined directly by the communications infrastructure. A two-way wireless communication link with the Transit Management Subsystem is used for relaying vehicle position and control measures. Fixed route transit systems may also employ beacons along the route to enable position determination and facilitate communications with each vehicle at fixed intervals. The Transit Management Subsystem processes this information, updates the transit schedule and makes real-time schedule information available to the Information Service Provider.)
Slide 24:

Slide 25:
Learning Objective #1
How many Public Transportation Service Packages are there in the National ITS Architecture?
Answer Choices
- 4
- 10
- 11
- 15
Slide 26:
Learning Objective #1
Review of Answers
 a) 4
a) 4
Incorrect. There are 11 Public Transportation Service Packages.
b) 10
Incorrect. There are 11 Public Transportation Service Packages.
 c) 11
c) 11
Correct! There are 11 Public Transportation Service Packages.
d) 15
Incorrect. There are 11 Public Transportation Service Packages.
Slide 27:
Learning Objective #1
Which of these is not a Public Transportation Service Package?
Answer Choices
- Transit Vehicle Tracking
- Multimodal Connection Protection
- Multimodal Coordination
- Broadcast Traveler Information
Slide 28:
Learning Objective #1
Review of Answers
a) Transit Vehicle Tracking
Incorrect. This SP is a Public Transportation Service Package.
b) Multimodal Connection Protection
Incorrect. This SP is a Public Transportation Service Package.
c) Multimodal Coordination
Incorrect. This SP is a Public Transportation Service Package.
d) Broadcast Traveler Information
Correct! It is not defined as a Public Transportation Service Package (but it is related to something that transit agencies do).
Slide 29:
Summary of Learning Objective #1
Summarize Key Concepts from Transit Management Standards, Part 1 of 2
- All fleet operations and management technologies are dependent upon other technologies
- "Vee" Model is systems engineering process (SEP) that facilitates system development and deployment, including the identification and incorporation of ITS standards
- 11 Transit Service Packages (SPs)
Slide 30:
Learning Objective #2: Illustrate the Structure and Use of Data Exchange Standards for Transit Management Systems
- How to meet user needs by using standards
- Structure of standards in addition to TCIP (e.g., GTFS)
Slide 31:
Learning Objective #2
Standards Facilitate Meeting User Needs
-
User need:
- Requirement for system to solve problem experienced by user
- Part of systems engineering process (SEP)
- Federal Transit Administration (FTA) National ITS Architecture Policy includes identification of applicable ITS standards
- May be satisfied by using standards
-
Standards being used to meet user needs:
- Users may not need customized solutions
- Data exchanges facilitated among applications and entities
- Can choose most suitable and cost-effective applications, knowing they use common standards
Slide 32:
Learning Objective #2
Standards Facilitate Meeting User Needs (cont.)
-
Benefits from using standards:
- Reducing complexity and cost in procurement, development, and management
- Ensure wider choice of suppliers
- Certain types of standards strategic to economic performance of systems
Slide 33:
Learning Objective #2
Standards Facilitate Meeting User Needs: Example
- Transit agency provides real-time data to developers for creation of mobile applications
- Using standards makes it easier for developers to create applications
- Require automatic vehicle location (AVL) system to generate information in General Transit Feed Specification (GTFS)-realtime format (considered de facto standard)
- AVL data could be provided in any format to meet user need, but greatly facilitated by use of GTFS-realtime format/standard
Slide 34:
Learning Objective #2
Standards Facilitate Meeting User Needs: Value
-
Protection of investment:
- Modularization and incremental deployment
- Choice of suppliers
- Reuse
-
Interoperability:
- Roadmap for evolution
- Data management
-
Improved quality and value:
- Risk reduction
- Better abstraction
- Better testing
- Process and tool support
- Modularization
- Reuse
Slide 35:
Learning Objective #2
Standards Facilitate Meeting User Needs: Criteria for Evaluating a Standard
-
Technical:
- How well it represents a problem ° What technologies it uses
-
Organizational:
- How mature it is
- If it is actively supported
- How long it will last
Slide 36:
Learning Objective #2
Standards Facilitate Meeting User Needs: Starting Point for Identifying Standards
- National ITS Architecture divided into interface classes
-
Interface classes:
- Defined by type of system at each end of the communications path: center, field (a.k.a. infrastructure), vehicle, and traveler
- Subdivided into application areas
-
Public transit management interface classes (all bidirectional) are:
- Center-to-infrastructure (C2I)
- Center-to-vehicle/traveler (C2V)
- Center-to-center (C2C)
- Example: Application area within C2I includes bidirectional communication between transit dispatch center and dynamic message signs at transit stop.
Slide 37:
Learning Objective #2
Center-to-Infrastructure (C2I) Application Area Capabilities Related to Transit
Covers interface between transit management center and specific type of infrastructure: Dynamic Message Signs (DMS) and Transit Signal Priority (TSP)
-
DMS:
- Provides information to travelers
- May use various technologies capable of displaying messages using any combination of characters
-
TSP:
- Provides intersection control through local traffic signal controller
- Provides interface between traffic management center and on-street master controller
- Based on analysis of transit vehicle's conditions (e.g., schedule adherence) and traffic characteristics for a given time and type of day
- Center invokes appropriate preconfigured traffic signal control system timing plan
Slide 38:
Learning Objective #2
Center-to-Vehicle/Traveler (C2V) Application Area Capabilities Related to Transit: Vehicle
Covers interface between transit management center and transit or paratransit vehicles
- Collecting automated vehicle location information
- Collecting operational and maintenance data
- Providing transit vehicle driver with electronic dispatch and routing instructions
- Providing traveler information to vehicle
- Providing schedule information used to develop corrective actions onboard
- Providing fare management information, including invalid traveler credit identities, to transit vehicles
- Supporting transit vehicle operator authentication and ability to remotely disable vehicle in emergency situations
Slide 39:
Learning Objective #2
Center-to-Vehicle/Traveler (C2V) Application Area Capabilities Related to Transit: Traveler
Covers interfaces between traveler information providers and devices used by traveling public
- General traveler information, including traffic information, transit information (fares, real-time schedules, and transactions), incident information, event information, and parking information
- Emergency traveler information, including alerts and advisories, and evacuation information
- Traveler services information (e.g., dining, lodging, etc.)
- Trip planning, using various modes of surface transportation and route options
- Route guidance
Slide 40:
Learning Objective #2
Center-to-Center (C2C) Application Area Capabilities Related to Transit
- Multimodal coordination between transit agencies and other public transportation modes
- Transit incident information, schedules, and fare and pricing information
- Transit information suitable for media use
- Emergency transit schedule information to other operation centers
- Transit system information to traffic management centers
- Personalized transit routes requested by travelers
- Financial institution approval and status of electronic fare payments
- Law enforcement regarding the notification of violations
Slide 41:
Learning Objective #2
Identifying Appropriate Standards
- Application Areas provide a starting point for identifying appropriate ITS standards
- Use USDOT's ITS Standards website
- Example: Transit Management, which is in the C2C Interface Class
Applicable Standards
In general, the following standards are applicable to Transit Management deployments. To determine which specific standards- are applicable for a deployment you will need to determine which architecture flows will be needed for the Transit Management piece of your deployment. Contact your local FHWA ITS Division Specialist or an ITS Standards Program Field Support Team contact
| Standard | Development Status |
|---|---|
| APTA TCIP-S-001 3.0.0 Standard for Transit Communications Interface Profiles; | Published |
| NTCIP 1102 Octet Encoding Rules (OER) Base Protocol; | Published |
| NTCIP 1104 Center-to-Center Naming Convention Specification; | Published |
| NTCIP 2104 Ethernet Subnetwork Profile; | Published |
| NTCIP 2202 Internet (TCP/IP and UDP/IP) Transport Profile; | Published |
| NTCIP 2303 File Transfer Protocol [FTP] Application Profile; | Published |
| NTCIP 2304 Application Profile for DATEX-ASN (AP-DATEX); | Published |
| NTCIP 2306 Application Profile for XML Message Encoding and Transport in ITS Center-to-Center Communications (C2C XML); | Published |
| NTCIP 3003 Profile Framework; | Published |
| NTCIP 9001 NTCIP Guide; | Published |
| SAE J2266 Location Referencing Message Specification (LRMS); | Published |
| SAE J2354 Message Set for Advanced Traveler Information System (ATIS); | Published |
| SAE J2540 Messages for Handling Strings and Look-Up Tables in ATIS Standards; | Published |
| SAE J2540/1 RDS {Radio Data System) Phrase Lists; | Published |
| SAE J2540/2 ITIS (International Traveler Information Systems) Phrase Lists; | Published |
| SAE J2540/3 National Names Phrase List; | Published |
Slide 42:
Learning Objective #2
Structure of Standards: Open Systems Interconnection (OSI)
- International Organization for Standardization (a.k.a. ISO) standard for worldwide communications that defines networking framework for implementing standards/protocols in seven layers
-
Seven layers:
- Physical
- Data Link
- Network
- Transport
- Session
- Presentation
- Application
Slide 43:

Slide 44:
Learning Objective #2
Which one of these is not a layer within the Open Systems Interconnection (OSI) model?
Answer Choices
- Application
- Data Link
- Service
- Physical
Slide 45:
Learning Objective #2
Review of Answers
a) Application
Incorrect. This is Layer 7 within the OSI model.
b) Data Link
Incorrect. This is Layer 2 within the OSI model.
c) Service
Correct! This is not a layer within the Open Systems Interconnection (OSI) model.
d) Physical
Incorrect. This is Layer 1 within the OSI model.
Slide 46:
Learning Objective #2
Structure of Standards: SAE J1708
- Facilitates vehicle area network (VAN)
-
Only describes two lowest layers
- Physical
- Data Link
-
Used in conjunction with SAE J1587, which:
- Is an application layer
- Defines format of J1708 messages sent between microprocessor devices in transit vehicles
- Supports communication with external devices connected to the vehicle area network (VAN)
- J1708 message consists of Message Identification (MID) character, data bytes, and checksum
Slide 47:
Learning Objective #2
Structure of Standards: SAE J1939
-
High speed ISO 11898-1 Controller Area Network (CAN)-based communications network:
- Supports simple information exchanges and diagnostic data exchanges between on-components physically distributed throughout vehicle
- Allows components associated with different manufacturers to communicate with each other
- Successor to SAE J1708/J1587 low speed networks - those earlier standards provided simple information exchange between on-board components
-
Every J1939 message uses an identifier that defines:
- The message priority
- From whom it was sent
- The data that are contained within it
Slide 48:
Learning Objective #2
Structure of Standards: SAE J1939 (cont.)
- Layer 1 (physical layer) - electric interface with physical medium
- Layer 2 (data link layer) - data communication via Controller Area Network (CAN) (an ISO standard (ISO 11898) for serial data communication) based on CAN 2.OB
- Layer 3 (network layer) - functionality of bridge for transmission of messages between two network segments
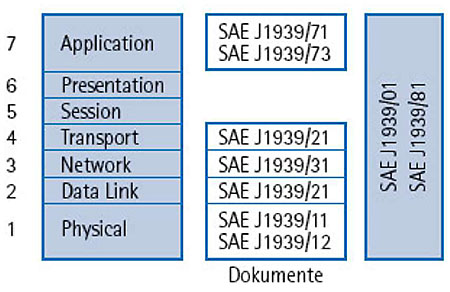
(Extended Text Description: Structure of Standards: SAE J1939 (cont.). To the right of the bullets on this slide, there is a table that describes the layers of SAE J1939. This diagram consists of three columns. The first column has seven rows. The top cell in this column is labeled "Application," representing Layer 7. The cell below it is labeled "Presentation," representing Layer 6. The cell below it is labeled "Session," representing Layer 5. The cell below it is labeled "Transport," representing Layer 4. The cell below it is labeled "Network," representing Layer 3. The cell below it is labeled "Data Link," representing Layer 2. The cell below it is labeled "Physical," representing Layer 1. The second column shows the number of the SAE J1939 document that corresponds to each Layer. The cell next to Layer 7, "Application" is labeled "SAE J1939/71" and "SAE J1939/73." The next cell below it, corresponding to Layer 6, is blank. The next cell below it, corresponding to Layer 5, is blank. The next cell below it, corresponding to Layer 4, is labeled "SAE J1939/21." The next cell below it, corresponding to Layer 3, is labeled "SAE J1939/31." The next cell below it, corresponding to Layer 2, is labeled "SAE J1939/21." The next cell below it, corresponding to Layer 1, is labeled "SAE J1939/11" and "SAE J1939/12.")
Slide 49:
Learning Objective #2
Structure of Standards: SAE J1939 (cont.)
- Layer 4 (transport layer) - various network services for message request mode, acknowledged transmission, and fragmented transmission of large data blocks
-
Layer 7 (application layer):
- Actual data (parameters or network variables with value range, resolution, physical unit, and type of transmission)
- Each message unambiguously referenced by parameter group number
- Network management - automatic allocation or determination of node addresses (plug & play principle)
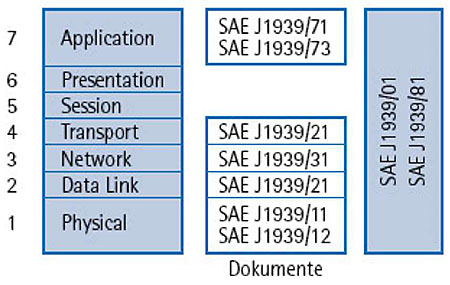
(Extended Text Description: Structure of Standards: SAE J1939 (cont.). To the right of the bullets on this slide, there is a table that describes the layers of SAE J1939. This diagram consists of three columns. The first column has seven rows. The top cell in this column is labeled "Application," representing Layer 7. The cell below it is labeled "Presentation," representing Layer 6. The cell below it is labeled "Session," representing Layer 5. The cell below it is labeled "Transport," representing Layer 4. The cell below it is labeled "Network," representing Layer 3. The cell below it is labeled "Data Link," representing Layer 2. The cell below it is labeled "Physical," representing Layer 1. The second column shows the number of the SAE J1939 document that corresponds to each Layer. The cell next to Layer 7, "Application" is labeled "SAE J1939/71" and "SAE J1939/73." The next cell below it, corresponding to Layer 6, is blank. The next cell below it, corresponding to Layer 5, is blank. The next cell below it, corresponding to Layer 4, is labeled "SAE J1939/21." The next cell below it, corresponding to Layer 3, is labeled "SAE J1939/31." The next cell below it, corresponding to Layer 2, is labeled "SAE J1939/21." The next cell below it, corresponding to Layer 1, is labeled "SAE J1939/11" and "SAE J1939/12.")
Slide 50:

Slide 51:
Learning Objective #2
Which of these standards are on-board vehicle area network (VAN) standards?
Answer Choices
- SAE J1939
- ISO 11898
- SAE J1708
- All of the above
Slide 52:
Learning Objective #2
Review of Answers
a) SAE J1939
This is an on-board VAN standard, but b) and c) are as well.
b) ISO 11898
This is an on-board VAN standard, but b) and c) are as well.
c) SAE J1708
This is an on-board VAN standard, but b) and c) are as well.
d) All of the above
Correct! All of these are on-board VAN standards.
Slide 53:
Learning Objective #2
Structure of Standards: GTFS
-
General Transit Feed Specification (GTFS):
- Defines common format for public transportation schedules and associated geographic information
- "Feeds" allow public transit agencies to publish their transit data and developers to write applications that consume that data in an interoperable way
-
Structure: Comma-delimited text files
- Six mandatory files: agency information, stops, routes, trips, stops times, and calendar
- Seven optional files: calendar dates, fare attributes, fare rules, shapes, frequencies, transfers, and feed info
- Considered "de facto" standard
- Adoption substantially outpaced TCIP and Service Interface for Real Time Information (SIRI) standards in North America
Slide 54:
Learning Objective #2
Structure of Standards: GTFS-realtime
- Feed specification that provides real-time updates about public transit fleet to application developers
-
An extension to GTFS and designed around:
- Ease of implementation
- GTFS interoperability
- Focus on passenger information
-
Currently supports the following types of information:
- Trip updates - delays, cancellations, changed routes
- Service alerts - stop moved, unforeseen events affecting a station, route, or entire network
- Vehicle positions - information about vehicles including location and congestion level
- Updates of each type provided in separate feed. Feeds served via HTTP and updated frequently
- Format based on protocol buffers
Slide 55:
Learning Objective #2
Structure of Standards:
Other Relevant Standards/Formats
- JavaScript Object Notation (JSON)
- Protocol Buffers
- Representational State Transfer (REST)
- Simple Object Access Protocol (SOAP)
- extensible Markup Language (XML)
-
Other transit standards for Transit Management exist in:
- International Organization for Standardization (ISO)
- Comité Européen de Normalisation (CEN) (French for European Committee for Standardization)
- UK - TransXChange, for example
Slide 56:
Summary of Learning Objective #2
Illustrate the Structure and Use of Data Exchange Standards for Transit Management Systems
- Three interface classes: C2C, C2I, and C2V
- On-board standards use OSI layers
-
Other standards are in a variety of formats:
- GTFS and GTFS-realtime
- JavaScript Object Notation (JSON)
- Protocol Buffers
- Representational State Transfer (REST)
- Simple Object Access Protocol (SOAP)
- extensible Markup Language (XML)
Slide 57:
Learning Objective #3: Select Appropriate ITS Standards for Data Exchange Among Transit Management Systems, and Between Transit Management Systems and Traveler Information, Fare Collection, and Other Systems (e.g., Traffic Management Systems)
- Life-cycle cost considerations
- Case study for center-to-infrastructure (C2I) or center-to-vehicle (C2V) flows
- Case study for on-board flows using vehicle area network (VAN) standards
- Using standards to facilitate integration with legacy systems
Slide 58:
Learning Objective #3
Life-Cycle Cost Considerations
-
Standards-based products should:
- Be available from a number of suppliers at lower cost
- Have a longer lifetime providing specific advantages
- Modularization and incremental deployment - technical advantages and allows for incremental approach to adoption, allowing users to spread investment over extended period
- Choice of suppliers - systems using interfaces based on standards can be implemented as discrete, pluggable modules that can be chosen from a wide variety of suppliers in competitive market
- Reuse - significantly reduce costs of specifying, procuring, and integrating system
Slide 59:
Learning Objective #3
Life-Cycle Cost Considerations (cont.)
- Development - standards are complex and expertise is needed to develop and validate
- Availability - must wait for standard to be published
- Maintenance - if standard changes, there can be additional costs to users
- Procurement - if standard is not used, costs associated with additional technical and marketplace complexity
- Adaptation - standard or organization may need to be adapted to meet specific requirements
- Gold-plating - using standards may give organizations items that it does not need
Slide 60:

Slide 61:
Learning Objective #3
Which of these issues typically drives the costs associated with using standards?
Answer Choices
- Adaptation
- Abstraction
- Testing
- All of the above
Slide 62:
Learning Objective #3
Review of Answers
a) Adaptation
Correct! A standard or organization may need to adapt to meet specific requirements.
b) Abstraction
Incorrect. Standards-based products usually have a higher level of generality and abstraction than one-off custom solutions.
c) Testing
Incorrect. Testing does not drive the costs associated with standards since operability was already tested when the standard was created. System components that use standards will work unless you have a proprietary system.
d) All of the above
Incorrect. Only a) is the correct answer.
Slide 63:
Learning Objective #3
Case Study for C2I Flows: Interurban Transit Partnership (ITP), Grand Rapids, MI
- ITP: 264 vehicles operating in max service/49,770,814 annual passenger miles
- ITP deployed real-time information (RTI) in 2013
-
RTI sent from dispatch center-to-field infrastructure (dynamic message signs) located at:
- Major transfer facility (called Central Station)
- One other transfer location (Kentwood Station)
- Vendor originally developed solution using GTFS data
-
GTFS required too much processing at sign:
- Requiring a lot of CPU power from sign
- Resulting slow process
- A lot of unnecessary data being sent down to sign
Slide 64:
Learning Objective #3
Case Study for C2I Flows: ITP (cont.)
-
Decided to use Representational State Transfer (REST) instead of GTFS:
- Provides most flexibility without having to touch the infrastructure (DMS)
- Can be consumed by a wide variety of web clients
- Able to return JSON, XML, HTTP and other web standard formats
- Provides simple ways to filter data
- Includes providing DMS diagnostics on continuous basis
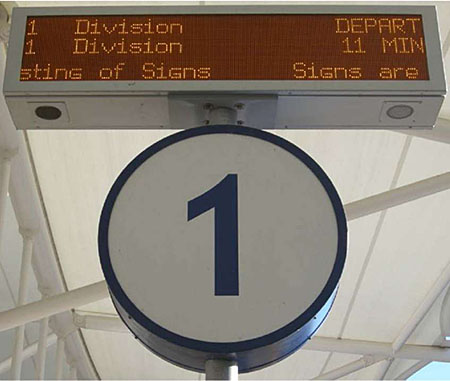
(Extended Text Description: Case Study for C2I Flows: ITP cont. To the right of the bullets on this slide is a photo of one electronic sign that displays real-time information for Route 1 operated by ITP. The first line of the electronic sign says "1 Division Depart." This means that Route 1, of which the final destination is Division, is departing this stop, which is located at ITP's Central Station. The second line says "1 Division 11 min." This means that the next bus on Route 1, of which the final destination is Division, is departing this stop in 11 minutes. The third line is a scrolling message that says "Signs are Currently Under Testing.")
Slide 65:

Slide 66:
Learning Objective #3
What de facto standard did ITP's vendor use to successfully exchange data between the dispatch center and dynamic message signs in the field?
Answer Choices
- General Transit Feed Specification (GTFS)
- Extensible Markup Language (XML)
- JavaScript Object Notation (JSON)
- Representational State Transfer (REST)
Slide 67:
Learning Objective #3
Review of Answers
a) General Transit Feed Specification (GTFS)
Incorrect. The vendor started the project using GTFS, but replaced it in the end.
b) Extensible Markup Language (XML)
Incorrect. The vendor did not address the issues with XML.
c) JavaScript Object Notation (JSON)
Incorrect. The vendor did not address the issues with JSON.
d) Representational State Transfer (REST)
Correct. The vendor used REST.
Slide 68:
Learning Objective #3
Case Study for C2V Flows: Chattanooga Area Regional Transportation Authority (CARTA)
- CARTA: 66 vehicles operating in max service/10,040,856 annual passenger miles
-
Required multiplex system on all buses purchased:
- System connected to SAE J1939 data bus
- Monitor common engine, transmission, and braking faults transmitted on data bus (e.g., high engine oil temperature, low oil pressure, high transmission oil temperature)
- Log data for later retrieval
- Main purpose was for integration with other planned in-vehicle equipment
- Implemented daily upload of bus diagnostic information collected onboard to Automatic Vehicle Monitoring (AVM) server, making data available to maintenance staff
Slide 69:
Learning Objective #3
Case Study for C2V Flows: CARTA AVM
-
Selection of standard(s) to incorporate in functional specifications for AVM system based on:
- Availability
- Applicability
- Maturity
- Vendors' use/acceptance
-
Incorporated into specifications in appropriate location:
- On-board Device Alarms Reporting
- Automatic Vehicle Monitoring: On-board System
- Student supplement contains specification language
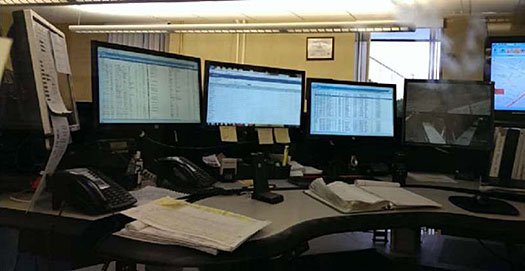
(Extended Text Description: Case Study for C2V Flows: CARTA AVM. To the right of the bullets on this slide is a photo of the Chattanooga Area Regional Transportation Authority (CARTA) dispatch center. The photo consists of three video screens that display dispatch information on a desk where the dispatcher sits.)
Slide 70:
Learning Objective #3
Using Standards to Facilitate Integration with Legacy Systems: TriMet Case Study
- TriMet: 888 vehicles operating in max service/460,913,427 annual passenger miles
- Use ITS standards when developing systems to maximize vendor flexibility and data exchange compatibility
-
Functional Integration example:
- No Transmission Control Protocol/Internet Protocol (TCP/IP) standards for LED sign interface at time of DMS procurement
- Forced to consider sign vendors that had proprietary protocols
- TriMet required sign vendors to interface with TCP/IP protocols
- Advantage to using TCP/IP and standard protocols that would enable use of different communication methods, yet retain same applications
Slide 71:
Learning Objective #3
Using Standards to Facilitate Integration with Legacy Systems: Central Puget Sound Case Study
- Comply with standards and select proven commercial off-the-shelf technology (hardware and software)
-
Seven public transportation agencies in Central Puget Sound region. Modifying or customizing technology:
- Entails greater risks
- Has advantage of closely meeting needs
- Has disadvantage of needing more development and testing
- Only on-board driver display unit significantly customized
- Customized software developed to accommodate partners' existing legacy systems
Slide 72:
Learning Objective #3
Using Standards to Facilitate Integration with Legacy Systems: Portland TriMet Case Study
- Integrating with existing legacy systems can save money associated with implementing a new system
- New real-time bus arrival estimation system built upon same platform as TriMet's existing AVL bus dispatch and rail central control systems
- Saved software development time and system costs
- Few minor changes needed because of different requirements necessary for reporting information to customers
Slide 73:

Slide 74:
Learning Objective #3
Does complying with standards and using commercial off-the-shelf technology help make it easier to integrate existing systems with new ones?
Answer Choices
- Yes
- No
Slide 75:
Learning Objective #3
Review of Answers
a) Yes
Correct! Complying with standards and using commercial off-the-shelf technology can help save money, minimize risks, and make it easier to integrate existing systems with new ones.
b) No
Incorrect. Modifying or customizing a particular technology entails greater risks, as demonstrated in the Central Puget Sound region.
Slide 76:
Summary of Learning Objective #3
Select Appropriate ITS Standards for Data Exchange Among Transit Management Systems, and Between Other Systems
-
Six main areas of life-cycle cost considerations:
- Development
- Availability
- Maintenance
- Procurement
- Adaptation
- Gold-plating
- C2I and on-board flows examples
-
Issues associated with integration with legacy systems:
- Comply with standards and select proven, commercial off-the-shelf technology
- Plan on adequate development time and thorough system testing
Slide 77:
Learning Objective #4: Illustrate How to Apply Standards to the Development of Procurement Specifications
- Read a standard
- Rigidity, flexibility, and change in the application of standards
- Incorporate a standard into a specification for procuring a Transit Management system
- Test and determine conformance with a standard
- Standards and intellectual property
Slide 78:
Learning Objective #4
Read a Standard
-
Transit Management standards not structured the same way:
- SAE J1939 based on OSI layers
- GTFS is a series of comma-delimited text files
- GTFS-realtime format based on Protocol Buffers
- TransXChange (UK standard) is XML format
-
Need to understand enough to:
- Identify appropriate standard(s) based on aforementioned criteria
- Define use of standard(s) in functional requirements/specifications
- Define how compliance with standard(s) can be tested
Slide 79:
Learning Objective #4
Read a Standard: SAE J1939
| CoreJ1939 Standards | |
|---|---|
| J1939 | Recommended Practice for a Serial Control and Communications Vehicle Network |
| J1939-01 | Recommended Practice for Control And Communications Network for Qn-Highway Equipment |
| J1939-02 | Agricultural and Forestry Off-Road Machinery Control and Communication Network |
| J1939-03 | On Board Diagnostics Implementation Guide |
| J1939-05 | Marine Stern Drive and Inboard Spark-Ignition Engine On-Board Diagnostics Implementation Guide |
| J1939-11 | Physical Layer - 250k bits/s, Twisted Shielded Pair |
| J1939-13 | Off-Board Diagnostic Connector |
| J1939-15 | Reduced Physical Layer, 250K bits/sec, Un-Shielded Twisted Pair (UTP) |
| J1939-21 | Data Link Layer |
| J1939-31 | Network Layer |
| J1939-71 | Vehicle Application Layer |
| J1939-73 | Application Layer - Diagnostics |
| J1939-74 | Application - Configurable Messaging |
| J1939-75 | Application Layer - Generator Sets and Industrial |
| J1939-81 | Network Management |
| J1939-82 | Compliance - Truck and Bus |
| J1939-84 | OBD Communications Compliance Test Cases for Heavy Duty Components and Vehicles |
Slide 80:
Learning Objective #4
Read a Standard: SAE J1939 (cont.)
- Most messages intended to be broadcast
-
Data transmitted on the network without a specific destination:
- Permits any device to use data without requiring additional request messages
- Allows future software revisions to easily accommodate new devices
- When a message must be directed to a particular device, a specific destination address can be included within message identifier
Slide 81:
Learning Objective #4
Read a Standard: GTFS
| Filename | Required | Defines |
|---|---|---|
| agency.txt | Required | One or more transit agencies that provide the data in this feed. |
| stops.txt | Required | Individual locations where vehicles pick up or drop off passengers. |
| routes.txt | Required | Transit routes. A route is a group of trips that are displayed to riders as a single service. |
| trips.txt | Required | Trips for each route. A trip is a sequence of two or more stops that occurs at specific time. |
| stop_times.txt | Required | Times that a vehicle arrives at and departs from individual stops for each trip. |
| calendar.txt | Required | Dates for service IDs using a weekly schedule. Specify when service starts and ends, as well as days of the week where service is available. |
| calendar_dates.txt | Optional | Exceptions for the service IDs defined in the calendar.txt file. If calendar_dates.txt includes ALL dates of service, this file may be specified instead of calendar.txt. |
| fare_attributes.txt | Optional | Fare information for a transit organization's routes. |
| fare_rules.txt | Optional | Rules for applying fare information for a transit organization's routes. |
| shapes.txt | Optional | Rules for drawing lines on a map to represent a transit organization's routes. |
| frequencies.txt | Optional | Headway (time between trips) for routes with variable frequency of service. |
| transfers.txt | Optional | Rules for making connections at transfer points between routes. |
| feed_info.txt | Optional | Additional information about the feed itself, including publisher, version, and expiration information. |
Slide 82:
Learning Objective #4
Read a Standard: GTFS (cont.)
agency.txt:
agency_id, agency_name,agency_url,agency_timezone,agency_phone,agency_lang
FunBus,The Fun Bus,http://www.thefunbus.org,America/Los_Angeles,(310) 555-0222,en
stops.txt:
stop_id,stop_name,stop_desc,stop_lat,stop_lon,stop_url,location_type,parent_station
S1,Mission St. & Silver Ave.,The stop is located at the southwest corner of the intersection.,37.728631,-122.431282,,,
S2,Mission St. & Cortland Ave.,The stop is located 20 feet south of Mission St.,37.74103,-122.422482,,,
S3,Mission St. & 24th St.,The stop is located at the southwest corner of the intersection.,37.75223,-122.418581,,,
S4,Mission St. & 21st St.,The stop is located at the northwest corner of the intersection.,37.75713,-122.418982,,,
S5,Mission St. & 18th St.,The stop is located 25 feet west of 18th St.,37.761829,-122.419382,,,
S6,Mission St. & 15th St.,The stop is located 10 feet north of Mission St.,37.766629,-122.419782,,,
S7,24th St. Mission Station,,37.752240,-122.418450,,,S8
S8,24th St. Mission Station,,37.752240,-122.418450,http://www.bart.gov/stations/stationguide/stationoverview_24st.asp,1,
routes.txt:
route_id,route_short_name,route_long_name,route_desc,route_type
A,17,Mission,"The ""A"" route travels from lower Mission to Downtown.",3
Slide 83:
Learning Objective #4
Rigidity, Flexibility and Change in the Application of Standards
- Standards are not perfect
-
Extending standards are acceptable but:
- Must be well documented
- Follow prescribed procedures
- Vendors may claim "conformance to standards" but may not provide all features and value ranges allowed
- Beware of "cherry picking" from manufacturers' datasheets
- Stick to functions needed to meet Concept of Operations (ConOps)
Slide 84:
Learning Objective #4
Rigidity, Flexibility and Change in the Application of Standards (cont.)
-
Avoid specifying proprietary features and objects:
- Both will result in nonstandard, non-interoperable solutions
- If you must have a new or different "feature," document thoroughly for all to use
Slide 85:

Slide 86:
Learning Objective #4
A good approach to defining the functions of your system is to select items from manufacturers' datasheets.
Answer Choices
- True
- False
Slide 87:
Learning Objective #4
Review of Answers
a) True
Incorrect. Selecting items from manufacturers' datasheets is not a good approach.
b) False
Correct! Vendors may claim "conformance to the standards" but may not provide all features and value ranges allowed in the standard, so "cherry picking" from manufacturers' datasheets as you are developing your requirements and specifications is not a good approach.
Slide 88:
Learning Objective #4
Incorporate a Standard into a Specification for Procuring a Transit Management System
- Discussion of Concept of Operations (ConOps)
- Components/devices you expect to be supplied in system
- Functions to be supported, value ranges, and optional capabilities required
- Detailed listing of requirements
- Language requiring use of standardized dialogs
- Testing program
Slide 89:
Learning Objective #4
Incorporate a Standard into a Specification for Procuring a Transit Management System
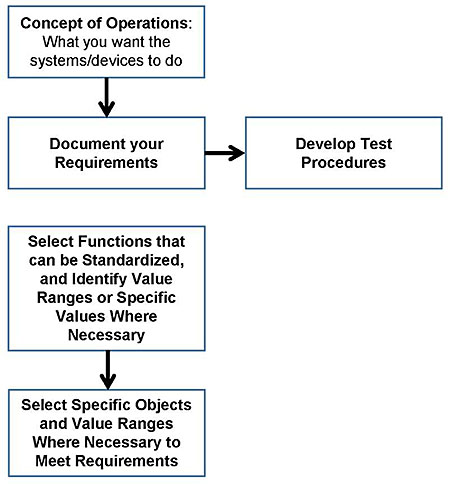
(Extended Text Description: Incorporate a Standard into a Specification for Procuring a Transit Management System: This flowchart indicates the progressive application of the standards. The first box is labeled "Concept of Operations: What you want the systems/devices to do." An arrow points downward toward the next box, which is labeled "Document your Requirements." An arrow points to the right toward the next box, which is labeled "Develop Test Procedures." The box labeled "Document your Requirements" is connected to a box below it with a down-pointing arrow. This box below is labeled "Select Functions that can be Standardized, and Identify Value Ranges or Specific Values Where Necessary." An arrow points downward to the next box, which is labeled "Select Specific Objects and Value Ranges Where Necessary to Meet Requirements.")
Slide 90:
Learning Objective #4
Structure of Standards: Excerpts from Functional Specification using J1708 or J1939
-
On-board:
- The Contractor shall install communications cabling and connections compliant with the Society of Automobile Engineers (SAE) J-1708/1587 or J-1939 network standard....
- The Contractor shall fully document all supported Message IDs (MID) and Parameter IDs (PID) available for communications with on-board devices using the J-1708/1587 or J-1939 interface
- APC Installation/Integration: The Contractor shall integrate the APC controller with the on-board MDT, based on the standard SAE J-1708/J-1587 or J-1939 VAN
- Integration with Interior DMS: The Contractor shall install new interior DMS that shall communicate with the AVA controller over the J1708/1939 network
- Vehicle Component Monitoring (VCM) subsystem: The MDT shall be integrated with existing J1708/1587 and J1939 network on the fixed-route fleet to collect codes from....
Slide 91:
Learning Objective #4
Test and Determine Conformance with a Standard
- Conformance: testing to determine if implementation meets requirements of standard or specification
-
Testing for:
- Performance
- Robustness
- Behavior
- Functions
- Interoperability
- Conformance testing is different - requirements or criteria for conformance must be specified in standard/specification
- Some standards have subsequent documentation for test methodology and assertions to be tested. If criteria or requirements for conformance not specified, there can be no conformance testing
Slide 92:
Learning Objective #4
Test and Determine Conformance with a Standard (cont.)
- Prove beyond any doubt that implementation is correct, consistent, and complete with respect to specification
- Impossible for implementations of nontrivial specifications written in natural language
-
Alternative is falsification testing, which:
- Subjects implementation to combinations of legal and illegal inputs
-
Compares resulting output to set of corresponding "expected results"
- If errors found, implementation does not conform to specification
- If no errors, does not necessarily imply converse
- Can only demonstrate nonconformance
- The larger and more varied the inputs, the more confidence can be placed when testing generates no errors
Slide 93:
Learning Objective #4
Test and Determine Conformance with a Standard: Conformance Clause
- High-level description of what is required of implementers and application developers
-
May specify:
- Sets of functions
- Minimal requirements for certain functions and minimal requirements for implementation-dependent values
- Permissibility of extensions, options, and alternative approaches and how they are to be handled
Slide 94:
Learning Objective #4
Test and Determine Conformance with a Standard: Conformance Testing
- Ensure that "standard-based" products are implemented
-
Benefits:
- Quality products
- Interoperability
- Competitive markets with more choices
-
Conformance involves two major components:
- Test tool/suite - testing program cannot exist without this
-
Testing program (e.g., certification or branding) for those specifications/standards for:
- Critical applications
- Interoperability with other applications
- Security of systems
Slide 95:
Learning Objective #4
Test and Determine Conformance with a Standard: Conformance Testing (cont.)
- Decision to establish program based on risk of nonconformance versus costs of creating and running program
-
Conformance testing program usually includes:
- Standard or specification
- Test tool (e.g., tool, suite) and/or reference implementation
- Procedures for testing
- Organization(s) to do testing, issue certificates of validation, and arbitrate disputes
Slide 96:

Slide 97:
Learning Objective #4
Which of the following elements are included in a conformance testing program?
Answer Choices
- Standard or specification
- Procedures for testing
- Organization(s) to do testing, issue certificates of validation, and arbitrate disputes
- All of the above
Slide 98:
Learning Objective #4
Review of Answers
a) Standard or specification
This is included in a conformance testing program.
b) Procedures for testing
This is included in a conformance testing program.
c) Organization(s) to do testing, issue certificates of validation, and arbitrate disputes
This is included in a conformance testing program.
d) All of the above
Correct! You need all of these elements for a conformance testing program.
Slide 99:
Learning Objective #4
Standards and Intellectual Property
- Best technology for technical standard could be proprietary technology, protected by one or more patents
- Standards development more frequently anticipates technology rather than following it
- Leads to conflicts between standards and patents
- If patented technology is incorporated into standard without patent holder's agreement to share its patent rights, then patent holder may be only entity able to comply with standard
Slide 100:
Learning Objective #4
Standards and Intellectual Property (cont.)
- Agency should verify if any "essential" patent for which license is required, and broad terms and conditions under which license will be granted
- Information generally available from relevant Standards Developing Organization (SDO)
- If license obtained directly from patent holder, patent holder should be contacted and licensing agreement negotiated and signed prior to adopting standard
- Agency may have option of choosing from alternative technologies to comply with a given standard
- May include use of protected or patented technology
Slide 101:
Learning Objective #4
Standards and Intellectual Property (concluded)
- In all such cases, patents would not be considered to be "essential patents" but "useful patents"
- Essential patents may be pooled by patent holders
-
Compliance with given standard or technical regulation may require using one or more patented technologies. In all such cases:
- Required to obtain license from patent holder
- Must be done prior to using the patented technology to conform to the requirements of the standard
- Know rules so you are able to negotiate best possible terms and conditions for use of proprietary or patented technology
Slide 102:
Summary of Learning Objective #4
Illustrate How to Apply Standards to the Development of Procurement Specifications
- Different standards have different structures
-
Standards not static and can change. Standard extensions can be used, but:
- Must be well documented
- Follow prescribed procedures
- Five components to incorporate standard into procurement
-
Conformance testing program includes:
- Standard or specification
- Test tool
- Procedures for testing
- Organization(s) to do testing, issue certificates of validation, and arbitrate disputes
- Agency that plans to adopt standard should verify if any "essential" patent(s) for which a license is required
Slide 103:
What We Have Learned
- Service Packages represent slices of the physical architecture that address specific services like surface street control.
-
The use of standards is desirable for both business and technical reasons. The principal benefits of standards are as follows:
- protection of investment
- interoperability
- improved quality and value
- Application areas provide a starting point for identifying the ITS standards and other resources, and are deployment-oriented categories that focus on commonly deployed ITS services or systems.
- Using standards in a deployment can greatly reduce component development costs, especially if standardized off-the-shelf components are available.
- The requirements or criteria for conformance must be specified in the standard or specification.
Slide 104:
Resources
-
Serial Control and Communications Heavy Duty Vehicle Network: https://standards.sae.org/j1939 201308/. Related standards:
- SAE J1708, SAE J1587, SAE J1128, SAE J1944
- "Introduction to SAE J1708," https://www.kvaser.com/about-can/can-standards/j1708
- General Transit Feed Specification (GTFS): https://developers.google.com/transit/gtfs/
- General Transit Feed Specification (GTFS)-realtime: https://developers.google.com/transit/gtfs-realtime/
- ITS ePrimer: Module 7: Public Transportation, eprimer/documents/module7p.pdf
- Systems Engineering for Intelligent Transportation Systems: https://ops.fhwa.dot.gov/publications/seitsguide/section3.htm
- Webopedia definition of The 7 Layers of the OSI Model, http://www.webopedia.com/quick ref/OSI Layers.asp- content is no longer available.
- A Case Study on Applying the Systems Engineering Approach: Best Practices and Lessons Learned from the Chattanooga SmartBus Project, http://ntl.bts.gov/lib/32000/32600/32672/61027 se.pdf- content is no longer available.
Slide 105:
Next Course Modules
Students who have completed Module 5 may delve into the following PCB modules:
- Module 6: Traveler Information, Part 1 of 2
- Module 7: Traveler Information, Part 2 of 2
- Module 9: Arterial Management & Transit Signal Priority, Part 2 of 2
- Module 10: Electronic Fare Payment Systems
- Module 11: Transit and Connected Vehicle Environment/Emerging Technologies, Applications, and Future Platforms
Slide 106:
Thank you for completing this module.