
‹#›
U.S. Department of
Transportation

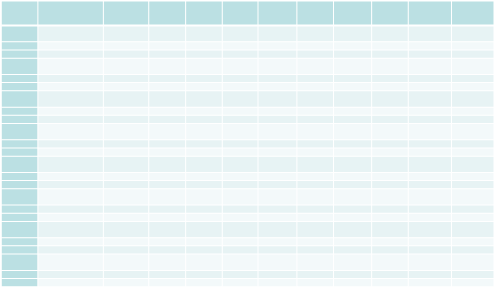
CV Level
Scenario
Probability
Interlink Shock (mph)
Intralink Shock (mph)
VMT Served (1,000s)
VHT
(veh-hr)
(veh-hr)
Speed
(mph)
(mph)
VSQ
(secs/veh)
(secs/veh)
95th %
TTI
TTI
Lane
Change/veh
Change/veh
Stops/veh
0% CV
1. Dry, No Incident
79%
29
18
275
6,453
43
52
1.66
449
71
2. Short Incident
7%
36
20
275
6,755
41
55
1.63
446
83
3. Long Incident
4%
39
26
274
7,587
36
117
1.99
455
255
4. Rain, No Incident
8%
38
27
262
9,765
27
290
3.85
489
850
5. Rain + Shrt Inc.
1%
38
28
258
10,614
24
304
4.11
493
914
6. Rain + Lng Inc.
1%
40
30
250
11,509
22
363
4.56
486
1,167
10% CV
1. Dry, No Incident
79%
21
16
275
6,571
42
46
1.70
428
60
2. Short Incident
7%
25
18
275
6,939
40
62
1.81
430
99
3. Long Incident
4%
28
19
273
7,994
34
133
2.22
429
313
4. Rain, No Incident
8%
28
21
263
10,028
26
271
3.91
468
795
5. Rain + Shrt Inc.
1%
31
22
257
10,836
24
314
4.18
466
983
6. Rain + Lng Inc.
1%
31
24
250
11,727
21
356
4.58
461
1,168
25% CV
1. Dry, No Incident
79%
16
13
275
6,955
40
52
1.78
456
73
2. Short Incident
7%
18
15
275
7,170
38
61
1.90
463
96
3. Long Incident
4%
23
18
273
8,248
33
134
2.27
470
312
4. Rain, No Incident
8%
22
19
260
10,445
25
291
4.26
498
879
5. Rain + Shrt Inc.
1%
23
19
257
11,216
23
309
4.08
491
960
6. Rain + Lng Inc.
1%
24
17
248
12,276
20
356
4.59
482
1,194
50% CV
1. Dry, No Incident
79%
14
13
275
7,169
38
53
1.95
488
74
2. Short Incident
7%
15
14
275
7,295
38
63
2.00
485
102
3. Long Incident
4%
20
14
274
8,405
33
123
2.30
492
287
4. Rain, No Incident
8%
18
17
262
10,637
25
273
4.04
513
826
5. Rain + Shrt Inc.
1%
19
18
257
11,165
23
297
4.11
505
946
6. Rain + Lng Inc.
1%
21
16
249
12,104
21
350
4.57
502
1,165
PRELIMINARY RESULTS FROM
SIMULATION ANALYSIS
SPD-HARM can potentially increase safety benefits,
but impacts on mobility statistically insignificant