Transit Module 24: Transit Signal Priority in Connected Vehicle Environment
HTML of the PowerPoint Presentation
(Note: This document has been converted from a PowerPoint presentation to 508-compliant HTML. The formatting has been adjusted for 508 compliance, but all the original text content is included, plus additional text descriptions for the images, photos and/or diagrams have been provided below.)
Slide 1:

Slide 2:

Slide 3:
Module 24:
Transit Signal Priority in Connected Vehicle Environment

Slide 4:
Instructor

Patrick Chan, P.E.
Senior Technical Staff
Consensus Systems Technologies
(ConSysTec)
Slide 5:
Learning Objectives
- Describe how transit signal priority may be provided in a connected vehicle environment
- Describe Transit Signal Priority (TSP) Standards in a Connected Vehicle Environment
- Describe what agencies need to do to prepare for Connected Vehicle (CV) TSP implementation
- Implementation Considerations
Slide 6:
Learning Objective 1
- Describe how transit signal priority may be provided in a connected vehicle environment
Slide 7:
Describe how transit signal priority may be provided in a connected vehicle environment
- Define what is a connected vehicle (CV) environment
- Describe how Transit Signal Priority (TSP) is currently implemented and the role of NTCIP 1211
- Identify what information is exchanged for TSP in a connected vehicle environment
- Describe potential advantages of a CV implementation over traditional TSP implementations
Slide 8:
What is a Connected Vehicle Environment?
Transportation Challenges

Source: US Department of Transportation, 2019 Urban Mobility Report, TTI

Slide 9:
What is a Connected Vehicle Environment
The CV Environment

Source: US Department of Transportation
CV environment consists of:
- Connected vehicles
- Connected individuals (vulnerable road users)
- Connected infrastructure
CV Communications
- Wireless
-
Mixture of
- Short-range communications
- Remote communications
Slide 10:
What is a Connected Vehicle Environment?

Source: US Department of Transportation
Slide 11:
What is a Connected Vehicle Environment?

Source: US Department of Transportation
Slide 12:
Transit Signal Priority
An operational strategy that provides preferential treatment (priority) to facilitate the movement of transit vehicles through signalized intersections
- Does not degrade the overall performance of the traffic network
- Provides more efficient use of the street network by increasing the throughput of travelers
- Improves reliability (on-time performance and scheduled adherence) of public transportation
Signal Priority applications can apply for emergency and freight vehicles also
- Address mobility and environmental challenges
Slide 13:
How Transit Signal Priority (TSP) is Currently Implemented
Current Systems
Optical Systems
-
An optical emitter on the vehicle requests preemption/priority
- Activated manually by the driver or based on location
- An optical detector near the traffic signal controller

Slide 14:
How Transit Signal Priority (TSP) is Currently Implemented
Current Systems
Optical Systems - Limitations:
- Requires line of sight. The detector must be aligned in the direction of the emitter, optical emitters/receivers could get dirty or misaligned, limited range.
- Limited information transmitted (timestamp, vehicle id maybe)
- Schedule may need to be maintained on the vehicle
- Proprietary. Hinders extending / connecting TSP corridors.
- Requires equipment at each intersection and on each vehicle.
- Lack of security.
Slide 15:
Role of NTCIP 1211 in Transit Signal Priority (TSP)
NTCIP 1211
An information content standard that defines aspects of a communications interface standard for a Signal Control Priority (SCP) system.
- Defines data elements (object definitions) used to monitor, configure and control a SCP system
- References NTCIP 1201 for generic data elements

Slide 16:
How Transit Signal Priority (TSP) is Currently Implemented
NTCIP 1211
- Priority Request Generator (PRG). Generates the priority requests for signal priority
- Priority Request Server (PRS). Receives the priority requests and processes the requests to determine the optimal signal timing to service the priority requests, then transmits service requests to the CO
- Coordinator (CO). Receives the service requests from the PRS and provides the signal priority
Slide 17:
What Information is Exchanged for TSP in a Connected Vehicle Environment
Vehicle to Infrastructure
Priority Requests
-
Requests for preferential treatment
- When is priority needed (i.e., when does the vehicle expects to arrive at the intersection)?
- Where is the vehicle going (i.e., What direction is the vehicle moving and will it turn)?
- How high a priority is the priority request?

Slide 18:
What information is Exchanged for TSP in a Connected Vehicle Environment
Vehicle to Infrastructure
Vehicle Information
- Broadcasts their location and kinematics

Slide 19:
What Information is Exchanged for TSP in a Connected Vehicle Environment
Infrastructure to Vehicle
Priority Status
-
Acknowledges that the priority request was received
- Indicates the status of the priority request
- Indicates what priority treatment is being provided (if any)?
- Indicates when will priority treatment will be provided?

Slide 20:
What Information is Exchanged for TSP in a Connected Vehicle Environment?
Infrastructure to Vehicle
-
Signal Phase and Timing (SPaT) information, which provides dynamic signal phase and timing data from one or more traffic signal controllers
- What movements (by lane) are currently allowed and when will the movement state is likely to end
-
MAP (roadway geometry) provides static roadway geometric information (e.g., lane information)
- May be required from the infrastructure to support TSP
- Both messages are defined in SAE J2735
- For additional information, see CV273, Introduction to SPaT/MAP Messages
Slide 21:
Potential Advantages of a CV Implementation over Traditional TSP Implementations
-
Low initial costs if vehicles and infrastructure is already connected
- V2V safety applications
- Signalized intersection applications
- See Module 11, Transit and the Connected Vehicle Environment/Emerging Technologies, Applications, and Future Platforms for other transit applications
- Just need to add support for TSP application
Slide 22:
Potential Advantages of a CV Implementation over Traditional TSP Implementations
-
Standardized messages
- Also supports emergency vehicles and freight vehicles
- Standardized security measures among all vehicle types and services
- Additional performance metric information
- Line of sight not required
Slide 23:

Slide 24:
Question
What is a disadvantage of using a traditional optical TSP system?
Answer Choices
- Special equipment is required for each intersection
- Line of sight is required
- Limited amount of information can be transferred
- All of the above
Slide 25:
Review of Answers
 a) Special equipment required for each intersection
Incorrect. Optical equipment is required on each intersection and vehicle.
b) Line of sight is required
Incorrect. The required line of sight has a relatively high possibility of being obstructed.
c) Limited amount of information can be transferred
Incorrect. Relatively little information about the vehicle can be obtained.
 d) All of the above
Correct! All of the above are disadvantages.
Slide 26:
Learning Objective
- Describe TSP Standards in a Connected Vehicle Environment
Slide 27:
TSP Standards in a Connected Vehicle Environment
- Previously described what data is needed to support TSP in a Connected Vehicle Environment
- The next several slides describe how the standards define this data
Slide 28:
Relevant Standards and the Maturity of the Standards
SAE J2735 Standard
- Dedicated Short Range Communications (DSRC) Message Set Dictionary
-
A data dictionary for the CV environment.
- Defines messages and data elements
- Includes vehicle kinematic information, position correction information, traveler information

Slide 29:
Relevant Standards and the Maturity of the Standards
SAE J2735 Standard

Slide 30:
SAE J2735
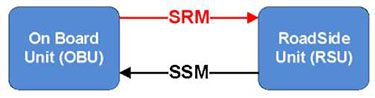
Signal Request Message (SRM)
- Broadcast by a vehicle (On-Board Unit) to infrastructure (Roadside Unit)
-
Asks for preferential (preemption/priority) treatment for one or more signalized intersections
- Includes approach and desired egress lane, and estimated times
- Must be configured to work reliably and with security protections

Slide 31:
SAE J2735
Signal Request Message (SRM)

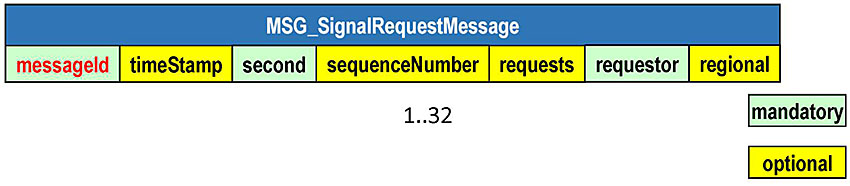
messageId. DE_DSRCmsgID = 14
timestamp. Number of elapsed minutes in the year
second. Number of milliseconds within the minute
sequenceNumber. Message counter
requests. Data for the priority request (up to 32)
requestor. Data about the requesting vehicle
regional. Regional extensions
Slide 32:
SAE J2735
Signal Request Message (SRM)


- id. Identifies the target intersection for the priority request
- requestID. An identifier for the priority request
- requestType. Request type (new, update, cancel)
- inboundLane. Identifier of the lane the requestor expects to enter the intersection
Slide 33:
SAE J2735
Signal Request Message (SRM)


- minute. Estimated time of arrival (ETA) in number of elapsed minutes in the year
- second. Estimated time of arrival (ETA) in number of elapsed seconds into the minute
Slide 34:
SAE J2735
Signal Request Message (SRM)

- duration. Represents milliseconds after the ETA, to create a window that the requestor will arrive at the intersection
- outboundLane. Identifier of the lane the requestor expects to exit the intersection
Slide 35:
SAE J2735
Signal Request Message (SRM)


- id. Identifier of the requestor. Generally, a fixed id.
-
type. Represents the type of requestor (emergency, public transit, truck, fire, police, cyclist, pedestrian, etc.)
- May include regional subroles
- Importance level
- Highway Performance Monitoring System (HPMS) classification type
Slide 36:
SAE J2735
Signal Request Message (SRM)


- position. Latitude, longitude, elevation (optional)
- heading. Direction of travel of the requestor
- speed. Transmission state and vehicle speed
- name. A descriptive name for debugging
- routeName. A route name for transit use
Slide 37:
SAE J2735
Signal Request Message (SRM)

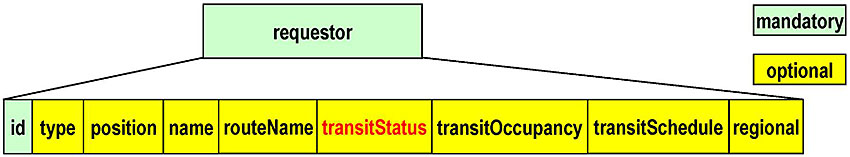
- transitStatus. Status of the transit vehicle. E.g., parked, ADA access in progress, loading bicycle, vehicle door open, at stop line.
- transitOccupancy. Relative level of ridership (7 levels from Empty to Full).
- transitSchedule. Schedule adherence delta of the requesting vehicle in 10 second steps.
Slide 38:
SAE J2735
Signal Request Message (SRM)

Mandatory Elements
- second. Time message was generated
- id. Identifier of the requestor. Generally a fixed id.
Request for Service
- id. Identifies the target intersection for the priority request
- requestID. An identifier for the priority request
- requestType. Request type (new, update, cancel)
- inboundLane. Identifier of the lane the requestor expects to enter the intersection
Slide 39:
SAE J2735
Signal Request Message (SRM)

Example
- A transit vehicle enters DSRC range and approaches two signalized intersections
- The transit vehicle wirelessly broadcasts a SRM, with its ETA and the identifier of the lanes to enter and egress at both intersections
- The RSU for at both intersections receives the SRM and relays the request to the PRS, which processes the request.

Slide 40:
SAE J2735
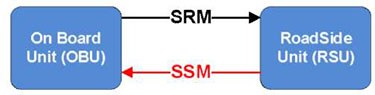
Signal Status Message (SSM)
- Broadcast by the infrastructure (Roadside Unit) and can be received by a vehicle (On-Board Unit)
- Provides the status of each priority request received by one or more signalized intersections

Slide 41:
SAE J2735
Signal Status Message (SSM)


- messageId. DE_DSRCmsgID = 15
- timestamp. Number of elapsed minutes in the year
- second. Number of milliseconds within the minute
- sequenceNumber. Message counter.
- status. Data about an intersection and received requests
- regional. Regional extensions
Slide 42:
SAE J2735
Signal Status Message (SSM)


- sequenceNumber. Message counter for the intersection. Increments when the status changes.
- id. Regionally unique intersection identifier.
- inBoundOn. The identifier of the lane for entering the intersection.
Slide 43:
SAE J2735
Signal Status Message (SSM)


- status. Status of the priority request. Values include processing, granted, rejected, maxPresence, reserviceLocked
- requester. Data about the priority request - vehicle identifier, requestID, and message counter.
Slide 44:
SAE J2735
Signal Status Message (SSM)

- outboundOn. The identifier of the lane for exiting the intersection.
- minute. Estimated time of arrival (ETA) in number of elapsed minutes in the year
- second. Estimated time of arrival (ETA) in number of elapsed seconds into the minute
Slide 45:
SAE J2735
Signal Status Message (SSM)

Example
- A RSU receives two SRM requests and the PRS processes the request
- The signal controller provides the PRS with the status of the requests, then the PRS generates a SSM that is broadcasted by the RSU with the status of all SRM requests received.
- Transit vehicles receive the SSM and travel through the signalized intersection when service is provided.

Slide 46:
SAE J2735
Basic Safety Message (BSM)

-
Broadcasted by an OBU
- Provides the location, kinematics, and sensor information about the vehicle
- Optionally, provides the type of vehicle
- If certified, indicates what (security) permissions it has
- BSMs may be used to determine if priority should be granted based on the location, vehicle type and (security) permissions of the vehicle
- Must be configured to work reliably and with security protections
Slide 47:
SAE J2735
Basic Safety Message (BSM)


- messageId. DE_DSRCmsgID = 20
- coreData. Critical data elements included with every basic safety message including location, positional accuracy, transmission, speed, heading, acceleration, brake status and vehicle size
- Part II. Optional extensions including event states, exterior light status, path history, and vehicle classification (type)
- regional. Regional extensions
Slide 48:
SAE J2735
Basic Safety Message (BSM)

Example
- A transit vehicle enters DSRC range and approaches two signalized intersections, while wirelessly broadcasting BSMs
- The RSU receives and processes the BSM information to determine its location, vehicle type and service permissions
- If the transit vehicle satisfies the established criteria for signal priority, the RSU sends a priority request to the priority request server (PRS)
Slide 49:
IEEE
IEEE 1609.2
- IEEE Standard for Wireless Access in Vehicular Environments (WAVE) - Security Services for Applications and Management Messages
- IEEE 1609.2 Certificates
-
Part of the CV security system
- Participants in the CV environment trusting the validity of information received from other system participants
- Indicates that the sender is trusted and has been granted the privileges to transmit the messages
Slide 50:
IEEE
Service Specific Permissions (SSP)
-
Included as part of the IEEE 1609.2 certificates to indicate additional privileges
- Such as the ability to request preferential treatment.
- Equipping authorized transit and emergency vehicles with these certificates authorizing the TSP requests, requests from non-eligible vehicles can be excluded from the priority services.
- See CV265, Introduction to IEEE 1609 Family of Standards for Wireless Access in Vehicular Environments (WAVE)
- See CSE201, Introduction to Security Credential Management System (SCMS)
Slide 51:
Early Adoption of the Standards
-
Few actual TSP in CV implementations at this time
- Most are single agencies
- Several implementations are planned
- Need regional interoperability
- TSP applications are communications technology neutral
- Same standards/messages used for emergency vehicles/freight vehicles
Slide 52:

Slide 53:
Question
What is a mandatory element of the SRM? Answer Choices
- Request Identifier
- Requestor Identifier
- SequenceNumber (message counter)
- Estimated time of arrival
Slide 54:
Review of Answers
a) Request Identifier
Incorrect. A request identifier is not mandatory unless a specific request is made
b) Requestor Identifier
Correct! The identifier of the requestor must be included in all Signal Request Messages
c) SequenceNumber (message counter)
Incorrect. The message counter is optional.
d) Estimated Time of Arrival
Incorrect. The estimated time of arrival of the requestor is optional.
Slide 55:
Learning Objective 3
- Describe What Agencies Need to Do to Prepare for CV TSP Implementation
Slide 56:
What Agencies Need to do to Prepare for CV TSP Implementation
- Define the roles and responsibilities of the traffic and transit agencies
- Define the physical architecture
- Present additional deployment guidance (security, authorization, vehicle priority, check-in/check-out, nearside vs farside)
Slide 57:
Roles and Responsibilities of the Traffic and Transit Agencies
Transit Agencies
-
Responsible for identifying the business rules when Priority Requests are generated
- Schedule adherence
- Transit vehicle load
- Transit vehicle in service/not in service
- Identify the goals and objectives (performance measures) for the TSP system
-
Outreach to other local agencies that may need preferential treatment to fit within the priority structure
- Emergency vehicle operators
- Freight operators
- May include cost-sharing
Slide 58:
Roles and Responsibilities of the Traffic and Transit Agencies
Traffic Agencies
- Responsible for granting priority requests based on the business rules provided by the transit agency
- Identify constraints on the business rules based on the traffic signal system infrastructure
Slide 59:
Physical Architecture
NTCIP 1211
-
Describes six common but different system architectures for SCP, including the physical components, the logical components (PRG, PRS, CO) and the interfaces between them.
- Implementations are allowed to use a different architecture, and may support multiple architectures.

Slide 60:
Physical Architecture
Connected Vehicle Environment
-
What communications technology to use?
- DSRC vs. 3GPP PC5 Mode 4
- How is security provided?
Slide 61:
Physical Architecture
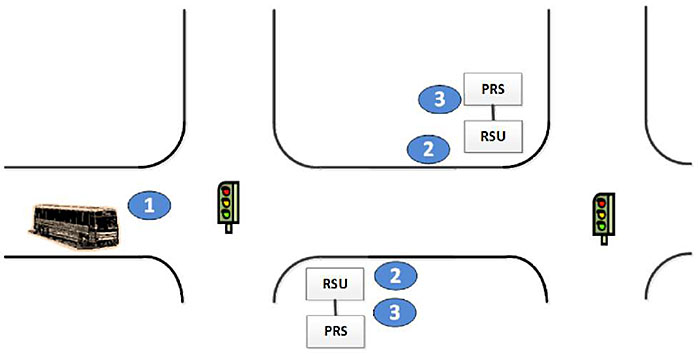
SRM / SSM
- The SAE J2735 SRM and SSM are exchanged between the OBU and the RSU
-
PRG generates the priority request
- May be part of the vehicle on-board systems, the OBU, or a separate physical device
-
PRS receives the priority requests and generates a service request to the CO
- May be part of the Coordinator (controller), the RSU, a separate device in the cabinet or a central location
Slide 62:
Physical Architecture
SRM / SSM

Slide 63:
Physical Architecture
BSM
- The SAE J2735 BSM is broadcasted by the OBU and received by the RSU
-
PRG generates the priority request based on the vehicle's current location, current kinematics (speed, heading), (vehicle) type, and / or permissions
- May be part of the RSU or a separate physical device in the cabinet or a central location

Slide 64:
Physical Architecture
BSM
-
PRS receives the priority requests and generates a service request to the CO
- May be part of the Coordinator (controller) or a separate device in the cabinet or a central location

Slide 65:
Additional Deployment Guidance
Vehicle Type/Class
- Used to determine priority
- Different type of vehicles (e.g., railroad, emergency vehicles, transit vehicles, freight)
-
Can also distinguish between different classes of the same vehicle type (e.g., for transit vehicles: LRT, BRT, express bus, or local bus)
- Called subRole in SAE J2735
- Called vehicle class in NTCIP 1211

Slide 66:
Additional Deployment Guidance
Check In / Check Out
Check In
-
When should the PRG begin generating priority requests?
- Consider the transmission signal strength of the OBU and the receiving strength (sensitivity) of the RSU
- Consider the transmission rate and latency of the communications technology (and the AVL system)
Check Out
- When will the traffic signal controller know that the requestor has checked out?
Slide 67:
Additional Deployment Guidance
Nearside / Farside
Nearside
-
Estimated Time of Arrival for nearside bus stops varies widely, impacting signal coordination
- How long will the vehicle be stopped?
- Door open/left turn signal indication is helpful
- Right turning vehicles are another issue
Slide 68:
Additional Deployment Guidance
Nearside / Farside
Nearside
-
Queue jumps may be effective
- The check-in point may be the stopbar
Farside
- Approach speeds toward the intersection will not vary much (more predictable)

Slide 69:

Slide 70:
Question
Where would a PRS NOT likely to be located? Answer Choices
- A transit vehicle
- A traffic management center
- A traffic signal controller cabinet
- A traffic signal controller
Slide 71:
Review of Answers
a) A transit vehicle
Correct! A PRS is not likely to be found aboard a transit vehicle
b) A traffic management center
Incorrect. The functions of the PRS may be performed at a centralized server at a traffic management center.
c) A traffic signal controller cabinet
Incorrect. A PRS could be a physical device in the cabinet.
d) A traffic signal controller
Incorrect. The functions of the PRS may be performed by the traffic signal controller
Slide 72:
Learning Objective 4
- Implementation Considerations
Slide 73:

Slide 74:
Implementation Considerations
Case Studies
- Multi-Modal Intelligent Traffic Signal Systems (MMITSS)
- Tampa Hillsborough Expressway Authority (THEA) Connected Vehicle Pilot
- Redwood Road, Salt Lake City, Utah
- SANDAG Bus-on-Shoulders
Slide 75:
Multi-Modal Intelligent Traffic Signal Systems (MMITSS)
Introduction
-
First implementations of signal priority in a CV Environment
- Anthem, AZ
- Palo Alto, CA
- Funded under the Connected Vehicle Pooled Fund Study.
-
Used SAE J2735_200911
- SRM, SSM, MAP, SPaT messages
- Some minor differences with the SAE J2735_201603 version
- Used NTCIP 1202 to exchange data between the RSU and the signal controller
Slide 76:
Multi-Modal Intelligent Traffic Signal Systems (MMITSS)
System Architecture

Slide 77:
Multi-Modal Intelligent Traffic Signal Systems (MMITSS)
Lessons Learned
- Supports emergency vehicles and transit vehicles.
-
This implementation considered priority based on performance measures such as overall delay
- Prior signal priority implementations were generally on a first come, first serve basis, particularly based on vehicle class (e.g., emergency vehicles).
- Improved vehicle travel time and travel time reliability
- Reduced delay for equipped transit vehicles by 8.2%
Slide 78:
Tampa Hillsborough Expressway Authority (THEA) Connected Vehicle Pilot
Introduction
- One of the sites for USDOT's CV Pilot Deployment Program
- Multimodal deployment in downtown Tampa, Florida
-
Includes a transit signal priority application
- 10 Hillsborough Area Regional Transit (HART) buses
-
Based on the MMITSS implementation, but with some modifications
- Adds support for coordination
- Converts SRM to NTCIP 1211 priority requests to the controller and NTCIP 1211 priority status objects from the controller to SSM
Slide 79:
Tampa Hillsborough Expressway Authority (THEA) Connected Vehicle Pilot
System Architecture

Source: https://www.its.dot.gov/pilots/pilots_thea.htm
Slide 80:
Salt Lake City, Utah
Introduction
-
Utah DOT (UDOT) - deployed DSRC
- Redwood Road - 27 signalized intersections
- Utah Valley Express (UVX) Bus Rapid Transit in Provo, Utah - 47 signalized intersections
- Opportunity to gain experience with connected vehicles
- Goal of the TSP project is to improve schedule reliability and meet the SPaT Challenge
- Modified Arizona MMITSS to integrate the buses' current on-time performance and passenger loading in the priority decision
Slide 81:
Salt Lake City, Utah
System Architecture

Source: Utah DOT
Slide 82:
Salt Lake City, Utah
Lessons Learned
-
Same equipped intersections provide signal preemption to UDOT snowplow vehicles in addition to other signalized intersections
- 46 snow plows
- Evaluation study underway for the UVX BRT Project and the Snow Plow Pre-emption Project
- More TSP and Snow Plow Pre-emption Corridors being added.
Slide 83:
SANDAG Bus On Shoulders
Introduction
-
Pilot project to explore technologies to support buses traveling in transit-only lanes of a freeway
- SANDAG, in partnership with San Diego Metropolitan Transit System (MTS), the California Department of Transportation (Caltrans), and the US Department of Transportation (USDOT)
- The transit-only lanes are in the shoulder lanes so where the shoulder lanes and the on-ramp lanes merge is a conflict area.
- Using CV technology with ramp meters to hold vehicles on the on-ramps as transit vehicles approach the conflict (merge) area
Slide 84:
SANDAG Bus On Shoulders
Concept

Source: SANDAG
Slide 85:
SANDAG Bus On Shoulders
System Architecture
-
OBUs are installed on the transit vehicles and RSUs are installed at the ramp meters
- Using V2I communications and WSMs
- Transit vehicles broadcast BSMs
- Ramp meters broadcast SSMs
Slide 86:

Slide 87:
Question
Which of the following is an important consideration when deploying TSP in a CV environment?
Answer Choices
- Security
- Physical architecture
- Criteria for granting priority requests
- All of the above
Slide 88:
Review of Answers
a) Security
Incorrect. Security is an important consideration for CV.
b) Physical architecture
Incorrect. The physical architecture is an important consideration for TSP system.
c) Criteria for granting priority requests
Incorrect. The criteria for granting priority requests is an important consideration for a TSP system.
d) All of the above
Correct! All of the above are important considerations for a TSP system in a CV environment.
Slide 89:
Module Summary
- Describe how transit signal priority may be provided in a connected vehicle environment
- Describe TSP Standards in a Connected Vehicle Environment
- Describe what agencies need to do to prepare for CV TSP implementation
- Implementation Considerations
Slide 90:
We Have Now Completed the TSP Curriculum
Module 8:
Arterial Management and Transit Signal Priority: Understanding User Needs for Signal Control Priority (SCP) Based on NTCIP 1211 Standard - Part 1 of 2.
Module 9:
Arterial Management and Transit Signal Priority: Understanding User Needs for Signal Control Priority (SCP) Based on NTCIP 1211 Standard - Part 2 of 2
Module 20:
Application of Arterial Management/Transit Signal Priority Standards
Slide 91:
Modules of Interest
Module 11:
Transit and the Connected Vehicle Environment/Emerging Technologies, Applications and Future Platforms
Module 23:
Leveraging Communications Technologies for Transit On-Board Integration
CV273:
Introduction of SPaT / MAP Messages
CSE201:
Introduction to Security Credential Management System
CV265:
Introduction to IEEE 1609 Family of Standards for Wireless Access in Vehicular Environments (WAVE)
Slide 92:
Thank you for completing this module. Feedback
Please use the Feedback link below to provide us with your thoughts and comments about the value of the training.
Thank you!