ITS ePrimer
Module 4: ITS Data in Decision Making
Authored by Vaishali Shah, Severna Park, MD, USA
2021
Table of Contents
Purpose
The purpose of this module is to introduce readers to the fundamentals related to collecting, storing, analyzing, and sharing Intelligent Transportation Systems (ITS) data to manage performance and improve decision making. Transportation agencies are inundated with roadside sensor-based data, crowdsourced and internet of everything (IoE) data, connected vehicle data, and transportation-adjacent data. Modern methods for management, integration, and application of these data can help transportation agencies evolve from experience and insight-based decision making to data-informed, predictive, optimized, and even passive decision making. This module sets the context for how real-time and archived data can improve transportation systems management and operations and broader transportation enterprise-level decision making.
Return to top ↑
Objectives
This module has the following objectives:
- Identify the sources and content of ITS and associated data
- Articulate how ITS and related data applications can inform and improve enterprise, program, and real-time processes and decisions
- Recognize that the techniques and tools transforming data are evolving, enabling individuals to access information as and when needed, rather than waiting for an annual or monthly report
- Introduce the principles for modern data managesment and governance and why both are essential to deriving the most value from data
Return to top ↑
1. Introduction
ITS brought forth real-time data to monitor and operate transportation systems through fixed field devices (e.g., traffic detectors, automatic vehicle identification, Bluetooth sensors, environmental sensors, cameras) as early as the 1960s, with the first traffic management center (TMC), loop detectors, and dynamic message signs (DMS). Nearly four decades later, ITS sensor technologies have evolved and emerged as the staple for most agencies’ traffic operations through advances in communications and mapping. In the 2010’s, greater volumes, variety, and velocity of data emerged from mobile field devices, crowdsourced technologies, connected vehicles, and other technologies (e.g., traffic signal performance, automated vehicle location, mobile friction sensors, mobile cameras, smartphone applications, vehicle probes aggregators, social media, smart cones). When effectively integrated, analyzed, and shared, these varied data help agencies improve traffic operations, systems maintenance, traffic safety, operator workload, and environmental footprint.
To be clear, a single data source can benefit multiple aspects of operations, and conversely, the integration of multiple data sources can transform a specific aspect of road or transit operations. In the transportation industry, we speak of data-driven, data-informed, data-centered, or performance-based decision making. For this module, we will use the term “data-informed decision making” as the encompassing suite of technologies, applications, and practices for the collection, integration, analysis, and presentation of data to help individuals and groups make decisions with greater confidence, accuracy, precision, simplicity, speed, timeliness, and impact.
The following defines the temporal component of data: Real-time data reflects information that is typically updated in under five minutes, ideally with only a few minutes of temporal lag from data collection to visualization. Near real-time data may be updated in the range of five to 30 minutes with temporal lags of up to one hour. Real-time decisions are based on real-time data and typically entail a quick response within a minute or a few minutes. Similar near real-time decisions are based on near real-time data. These decisions will typically have greater time between observing the data and the response to the data. The following three examples of data and how they inform decision making are offered as a preview:
- Automated Traffic Signal Performance Measures (ATSPM) - High-resolution controller event data are now accessible to transportation systems operators for monitoring and improving signal system health, quality of control (e.g., capacity allocation or preemption), and quality of progression (e.g., corridor optimization). The Utah Department of Transportation (UDOT) collects ATSPM at 96 percent of its 1,233 traffic signals using their in-house Department of Technology Services (IT). They estimate an ATSPM implementation cost of approximately $230K. Comparatively, the annual traffic signal program operation and maintenance budget is $4.9M. ATSPM systems transfer data using a file transfer protocol (FTP) to a central server every 15 minutes, as illustrated in Figure 1.
UDOT developed data visualization tools that enhance decision making speed, timeliness, accuracy, and confidence. Using ATSPM, UDOT staff prioritize operation and maintenance efforts to improve traffic flow, reduce congestion and emissions, and improve safety. The UDOT traffic signal operations engineer, Mark Taylor, noted that “We no longer go out to retime signals every three to five years. Now, we do it only when it’s needed, after we’ve looked at performance measurements.” UDOT does not use ATSPM data for real-time decisions but prioritizes work and maintains a traffic signal system that reflects changing traffic demand.
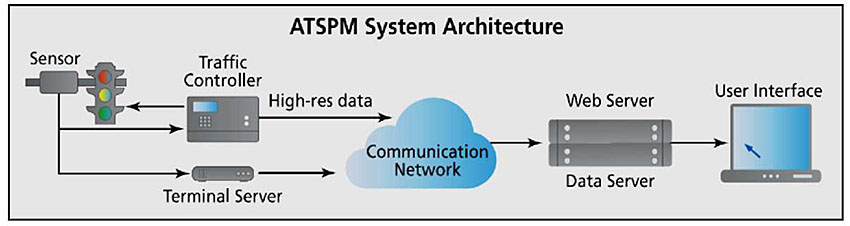
Figure 1. Automated Traffic Signal Performance System Architecture. Source: FHWA, 2018.
“We no longer go out to retime signals every three to five years. Now, we do it only when it’s needed, after we’ve looked at performance measurements.”
- Mark Taylor, Traffic Signal Operations Engineer, UDOT
The agency also makes available a public-facing interface for signal performance analyses (http://udottraffic.utah.gov/atspm/) using near real-time and historical data. Additional ATSPM case studies, benefit cost evaluations, and technical information are available through the Federal Highway Administration (FHWA) Arterial Management Program’s ATSPM site (https://ops.fhwa.dot.gov/arterial_mgmt/performance_measures.htm).
- Incident-Responsive Traffic Signal Systems - By integrating real-time incident and travel time data from a free crowdsourced navigation application partnership with ATSPM data, TMC operators in Lake County, Illinois, can modify signalization to support routing around a roadway temporarily closed due to events such as a roadway crash. The Lake County advanced traffic management system (ATMS) system, called Program for Arterial Signal Synchronization and Travel Guidance (PASSAGE), is the hub for data collection, visualization (Figure 2), signal changes, and broader incident response functions.
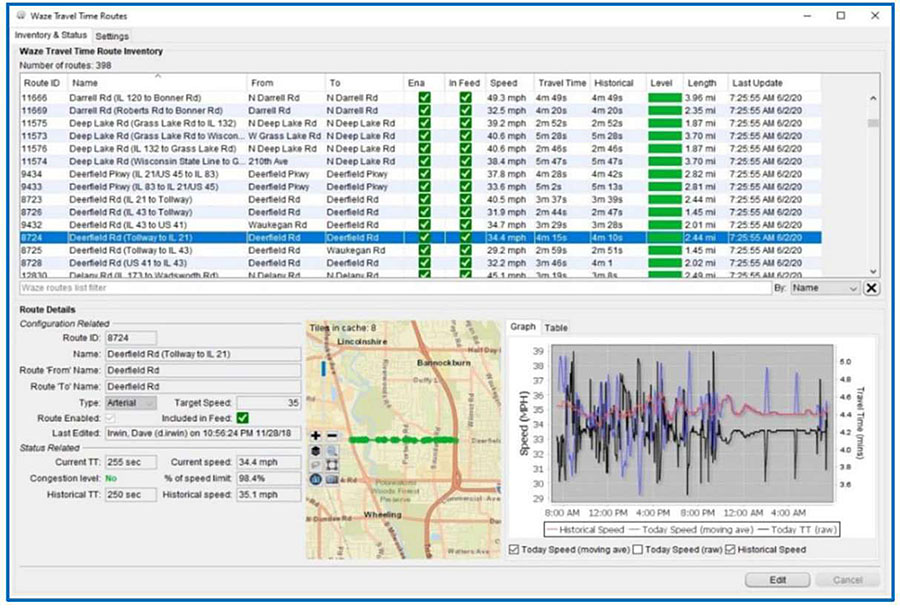
Figure 2. Crowdsourced Data Integration with Automated Traffic Signal Performance Measure Data in the Lake County, Illinois PASSAGE Advanced Traffic Management System. Source: Legare, 2020.
- The crowdsourcing partnership is called Waze for Cities as of 2019, and prior to 2019, the partnership was titled the Waze Connected Citizen Program. Lake County uses the Waze data, pulled every two minutes, for real-time decisions such as posting traveler information (frequently referred to as 511 services) through web, DMS, and mobile app platforms. Lake County changes the corridor signalization in near real-time to alter signal progression for detour routing when a major crash reduces roadway capacity. The PASSAGE operators also monitor the performance of the altered signal progression using both Waze and ATSPM data (acquired at a 15-minute interval) and make adjustments as needed.
Lake County uses the Waze incident, travel time, and archived ATSPM data to conduct before-after studies and modify signalization as regional demand changes. The benefit-cost ratio from timing studies using the combination of the free crowdsourced data and ATSPM data, compared to traditional signal coordination and timing (SCAT) studies, ranges from 49:1 for 2015 to 13:1 for 2019. In March 2020, the agency implemented systemwide changes to all agency-owned traffic signals within two days of the state’s Covid-19 mandated travel restrictions taking effect. As of 2020, Lake County is exploring using the Waze travel time data as an input variable for project selection and weather-responsive signal timing. More information on Waze is provided in Section 2.3.2.
- Friction Sensors Improve Winter Road Operations - The Colorado DOT (CDOT) Division of Highway Maintenance affixed electronic radar devices to the rear of agency trucks to measure roadway temperature, friction, and moisture data, and share the data in real-time with their maintenance decision support system (MDSS). The data from the devices enabled maintenance workers to focus on roadway segments needing treatment rather than treating whole sections of roadways. Figure 3 presents a picture of the radar device as well as data illustrated through a map interface which shows the vehicle route and variations in pavement conditions along the route.
- The improved treatment decisions for a few roadways over three storms saved 21 percent in solid materials use, and 56 percent in liquid materials use, resulting in $180,000 of cost savings, along with significant environmental benefits. Based on these findings, CDOT planned a broader technology deployment and associated changes in treatment decision making.
CDOT plans to implement sensors along corridors with variable weather, where ice and frost conditions are more sporadic, and where making materials use decisions is more complicated. The agency intends to share processed information with Colorado travelers through the agency’s traveler information website, COtrip. During storm events, more than one million visits to the COtrip site may view real-time roadway condition ratings based on the friction sensor data.
The remainder of this module is organized across five sections. Section 2 of this module describes data sources, the types of data generated by each source, and usability considerations. Data are organized into the following five groups: traditional and newer ITS infrastructure data, traffic operations data, crowdsourced data, transportation adjacent data, and emerging big data and sensor technologies.
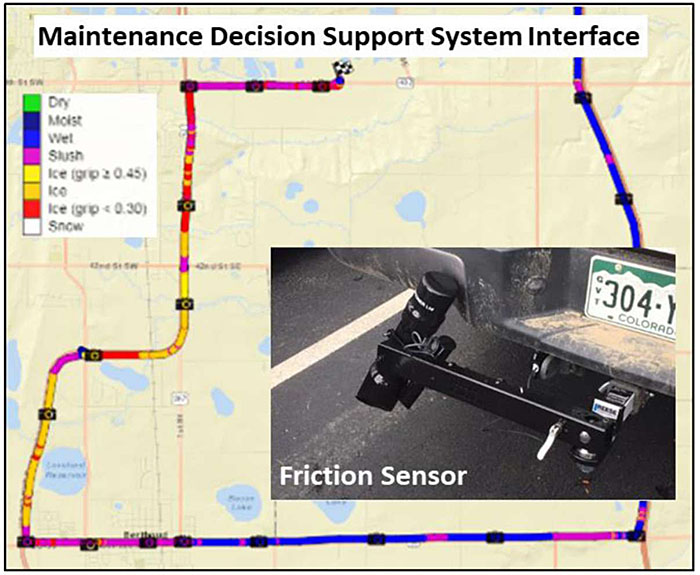
Figure 3. Colorado DOT Uses Real-Time Friction Sensor Data to Guide Operational Decisions Related to Road Segment Treatment Locations and Types. Source: adapted from Reilly, 2018.
Section 3 introduces the concept of performance management along with the analytical techniques to transform data and inform decisions. The use of data—absent the context of a mission or goal—is like navigating a raft through rapids with each person paddling powerfully and faster but in no unified direction. A performance management framework ensures that the various programs within a transportation agency are “paddling efficiently towards a destination.” Section 3.1 introduces the FHWA transportation performance management framework.
The availability of richer, more granular, and more varied data is complemented by readily accessible analytical techniques. From classification analysis and text mining to video and image analysis, existing software and visualization tools support descriptive and predictive uses. These varied types of analytics are highlighted in Section 3.2. The application of any analytical capabilities should first consider the underlying nature of the data. Thus, Section 3.3 presents differences between traditional, real-time, and advanced analytics in the context of understanding data quality to avoid the ‘garbage in, garbage out’ paradigm.
Section 4 introduces key concepts and trends in modern data management and data governance. Data governance is the exercise of authority, control, and shared decision making over data asset management. Traditionally, an authority at the state IT level or at an IT within a DOT will prescribe data governance policies. In some instances, intelligent transportation system (ITS) groups may exercise greater autonomy in how their data are managed, secured, accessed, stored, and more. This is the focus for Section 4.1.
There is a significant shift from centralized data management to a democratization of data. Rather than waiting for formulaic annual or quarterly reports, best practices in data management allow individuals to access and generate analyses as and when needed using real-time and near real-time data. This analytics-on-demand will help improve decision making at all levels of an organization. The democratization of data is highlighted in Section 4.2.
This democratization can only be fully realized with the practice of modern data management principles. Data management, which began for ITS with SQL or other structured databases, storing loop detector aggregated speed and flow data, now requires far more flexibility and access. Section 4.3 introduces the principles of modern data management, while Section 4.4 highlights the shift toward proactive analytics for data management. Section 4 summarizes and excerpts content from the National Cooperative Highway Research Program (NCHRP) Report 952, Framework for Managing Data from Emerging Transportation Technologies to Support Decision Making.
The three examples presented in this introduction illustrate how data can be collected, analyzed, and applied to inform operational decisions, help an agency improve planning for operations, and support project prioritization. Section 5 of this module provides additional examples of ITS and related data applied to improve decisions at the enterprise, program, and front-line levels of operations. The module closes with Section 6, summarizing the growing opportunities and challenges in the use of ITS and related data for transportation agency decision making.
Return to top ↑
2. Data Sources and Types
The data landscape for transportation systems management and operations is evolving from where the public transportation agency generates and controls data to where data are generated and controlled by entities outside the transportation agency. ITS ePrimer Module 9 provides an overview of vehicle detection, monitoring, and tracking technologies. This section describes current and emerging sources of data as of 2020, many of which overlap with and extend Module 9. The section focuses on the types of data from various sources through the lens of broader uses in decision making. Data sources are organized into the following five groups:
- Traditional and newer ITS infrastructure data
- Traffic operations data
- Crowdsourced data
- Transportation adjacent data
- Emerging big data and sensor technologies
The NCHRP report 904, Leveraging Big Data to Improve Traffic Incident Management, assesses transportation and non-transportation data across multiple criteria, including data structure, size, storage/management, accessibility, sensitivity, openness, and costs. This NCHRP resource provides insights specific to data and data management.
2.1 Traditional and Newer ITS Infrastructure Data
Data from ITS infrastructure are typically under the ownership and control of transportation agencies, although potentially managed using vendor products. In instances of vendor-managed data, local or state agencies have at times encountered difficulty changing suppliers and systems, due to scale, compatibility, or learning effects. Agencies may also find it difficult to align data from a previous vendor with a new data provider.
Much of the data are structured, fitting well in a relational database, except for digital video data (e.g., closed circuit television or automated license plate readers). These systems require roadside (either pavement embedded, above the road, or along the side of the road) technology installation and maintenance. They also require information communication from the roadside to a centralized data processing and analysis capability, typically through fiber or cellular services.
2.1.1 Point Traffic Sensor Data
Traditional ITS infrastructure sensors include loop detectors, magnetic sensors and detectors, video image processors, microwave radar sensors, laser radars, passive infrared and acoustic array sensors, ultrasonic sensors, plus combinations of sensor technologies. The third edition of the FHWA Traffic Detector Handbook, published in 2006, details these signalized intersection and freeway sensors technologies, along with their application, design, installation, and maintenance. Since this publication, advances in sensors, and particular over-roadway sensors, support the collection of traffic flow parameters by lane and direction. Sensor applications for arterial roadways are outlined in the FHWA report, “Arterial Data Collection Technology.” A more comprehensive Traffic Monitoring Guide (2016) “provides the most up to date guidance to state highway agencies in the policies, standards, procedures, and equipment typically used in a traffic monitoring program.”
Some detectors directly measure vehicle passage or presence, while others infer traffic flow and speed based on algorithmic data interpretation. This suite of sensors typically generates data including date, time, sensor identity, roadway location, direction, speed, volume, occupancy, and vehicle classification or weight.
- Sensor data is typically collected at sampling intervals (15, 30, or 60 seconds) and aggregated at one, five, fifteen, or even sixty-minute intervals.
- Sensor data, typically stored in a relational database, can be gigabytes or even terabytes in size depending on the entity (state, region, local) and aggregation level before archiving.
- Sensor data, typically collected and owned by the transportation agency, had commonly been managed on-premise and made available for free electronically, but only in aggregate form. Agencies are now are shifting to vendor-based data management systems that integrate storage and analytics (e.g., Statewide Traffic Analysis and Reporting System (STARS II) or Performance Measurement System (PeMS)).
- The quality of this data is tied to the agency’s ability to detect sensor drift and perform routine and timely recalibration, as well as maintain the precise location of sensors.
For example, the Maryland DOT makes real-time sensor speed data available for over 250 road segments through web feeds (Really Simple Syndication, RSS, or Extensible Markup Language, XML) and at five-minute intervals, but aggregates speed data to three speed ranges. Likewise, the Texas DOT makes volume, vehicle class, speed, and other data available through their STARS II system, but not as a real-time product.
The California DOT PeMS system, an Iteris product, collects data from nearly 40,000 freeway detectors and other traditional and new ITS infrastructure data. The PeMS system clarifies, for example, that it provides 24-hour weight in motion (WIM) data from 110 sites calibrated to +/- 5 percent accuracy. Data, including axle weights and gross weight, axle spacing, speed, vehicle classification, and overall length, are processed using algorithms and made available through a web-based user interface that helps the agency conduct pavement studies and accident rate calculations.
While sensors continue to be the mainstay for monitoring traffic volumes, many agencies are shifting to supplementing infrastructure sensors with vehicle probe data. The iPeMS system, an Iteris product, integrates PeMS with probe data from HERE. Regional Integrated Transportation Information System (RITIS) provides probe data from INRIX. When the sensor data is integrated with probe data through vendors, access and sharing become restricted, and issues of data ownership may limit use—a Utah DOT 2-minute video on iPeMS highlights this change.
2.1.2 Point Environmental Sensor Data
An environmental sensing station (ESS) is the hub for an array of sensors to measure pavement condition (e.g., temperature, dry, wet, ice, freeze point, chemical concentration), wind speed/direction, precipitation/accumulation, air temperature, relative humidity, visibility, water level/flooding, snow depth, subsurface conditions and more. Data from field ESS are processed through Road Weather Information System (RWIS) communications, hardware, and software.
- Many state and local agencies use private vendors to manage and tailor RWIS data through proprietary communications and processing, with data typically stored in a relational database.
- This data’s quality is tied to the agency or vendor’s ability to detect sensor drift and perform routine and timely recalibration. Drift refers to the gradual degradation of the sensor and other components that can make readings offset from the original calibrated state. RWIS providers typically embed some quality checks and more advanced data verification and corrections to counter sensor drift. The FHWA Weather Data Environment (WxDE) calculates nearly a dozen quality control metrics, such as checking for data persistence and the rate of change in the data.
- Data and technology challenges cited in the 2020 Road Weather Management Stakeholder Meeting included software or hardware glitches, RWIS station repair needs, system reliability, and data timeliness, accuracy, and availability.
These data feed strategic and tactical winter weather maintenance decisions and are applied by many state DOTs to non-winter weather events such as rain, flooding, or fog. Agencies also use this data to inform travelers and for variable speed limit (VSL) strategies.
2.1.3 Automated Vehicle Identification (AVI) and Bluetooth
Automated vehicle identification (AVI) and Bluetooth technologies use a network of roadside sensors to estimate travel time between and across sensors. Both systems stitch together location and time data from devices passing in the proximity of the sensor to estimate average travel time, travel speed, and travel patterns among sensors. AVI has the primary purpose of toll payment. AVI readers typically reflect tolling points. Additional readers may be strategically positioned to estimate travel time between shorter segments or paths. Bluetooth detectors track the media access control (MAC) address of drivers’ devices.
- AVI data is typically not shared at the granular level due to the concern for personally identifiable information. Instead, the travel time is shared as an average. Similarly, Bluetooth vendors make available only summary statistics and averages rather than vehicle-level data.
- For both systems, the quality of the travel time estimate is degraded with lower AVI transponder or Bluetooth sensor density along the road network. For example, a 20-minute travel time to reach a second toll reader or Bluetooth sensor, reflects the travel time from 20 minutes ago.
- The frequency of communications from the Bluetooth sensor to the central data processing point may further degrade information timeliness.
AVI and Bluetooth data are often used to monitor real-time system performance and have been used to detect potential incidents along major highways. As toll roads expand across the country, operators turn to smartphone applications for payment and sharing toll rates. Archived analyses of smartphone data can provide better congestion pricing toll models; however, most congestion pricing models are proprietary.
2.1.4 Automatic Vehicle Location (AVL) Based Sensors
Automatic vehicle location (AVL) tracks a vehicle (e.g., bus, snowplows, safety service patrol vehicles) typically using global positioning system (GPS) technology and a wireless data communications system. Data generated typically includes vehicle, operator, route, event (e.g., arrival time), and geospatial location data. In addition to the position data, agencies collect additional application-specific data from the onboard vehicle and value-added sensor systems. For example, for transit vehicles, fare collection, ridership, speed profile, stop arrival and departure times, or signal priority data may be coupled with AVL. Data such as pavement temperature, air temperature, materials application rate and type, engine diagnostics, or even dashcam images may be captured and transmitted from road weather maintenance vehicles, as illustrated in Figure 4. These value-add sensors reflect the IoE strategy and computing on the edge, where sensors are embedded on physical objects, often with the sensor collecting, filtering, analyzing, aggregating, and transmitting select performance data to save bandwidth, and provide real-time information.
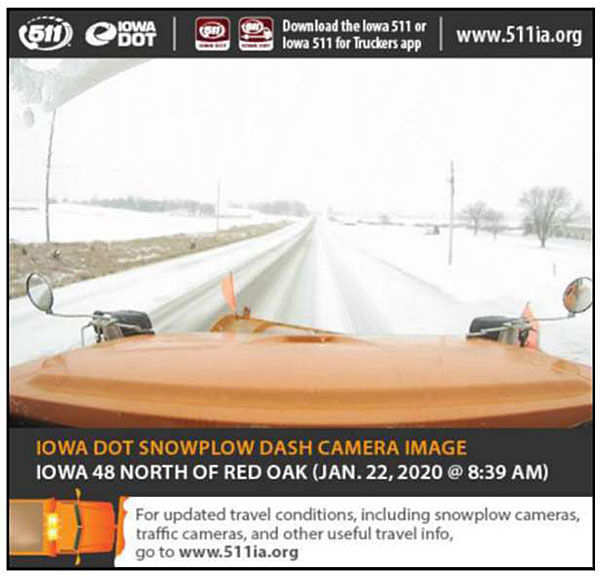
Figure 4. Iowa DOT Snowplow Dash Camera Image. Source: Iowa DOT.
- Depending on the application, AVL data may be captured for real-time and/or archived use at intervals of milliseconds, a few seconds to a few minutes.
- AVL data is typically stored using vendor-hosted cloud-based solutions given the size of this data; some agencies archive the processed data using a GIS database.
- AVL data quality issues do not typically reside with the AVL position data, except when a street is densely populated by tall buildings on both sides. This can cause the GPS signal at the ground level to be degraded. Likewise, in rural and mountainous areas that lack adequate cellular coverage (data gap), GPS quality is an issue.
- Agencies using AVL often note challenges with IoE value-add sensor installation and calibration, and data compatibility and retrieval issues. For example, MDSS may experience challenges with the imprecision of data, such as material application rates.
These data can be used immediately for daily operations such as predicting and sharing a bus arrival time or providing AVL breadcrumb data publicly available through 511 to show both snowplow location and even dashcam images of road weather conditions. These data support real-time operations and maintenance decision support. Archived AVL and accompanying sensor data can be applied to improve routing and schedule adherence. These data can be integrated with broader transportation data to make policy and planning decisions based on performance trends.
2.1.5 Traffic Digital Video
Close-circuit television cameras (CCTV) use optical sensors to derive traffic intelligence from the video. CCTV systems are a central component of TMCs and responder communities. Video data can capture personally identifiable information (PII) and exceed terabytes of data per day; thus, the fixed CCTV video is generally not stored, or stored for a very short duration (e.g., two weeks). The CCTV video is monitored by operators and often shared in real-time with travelers and responder communities.
Several agencies mount CCTV on safety service patrol vehicles with pan, tilt, zoom, and video streaming capabilities. For example, the Maryland and Washington State DOTs use cellular services and AVL/GPS data to transmit CCTV video from their safety service patrol vehicle fleet at the scene of an incident. Some agencies also make available to responders (e.g., law enforcement, fire, or emergency medical services (EMS)) a platform for sharing high-resolution video feeds, different from the lower-quality public video feeds. These feeds help responders conduct a camera tour of the site in advance of the response to understand better the situation, approach direction, and the potential need for additional resources. These are examples of data-sharing without data archiving.
Video can be processed using image analysis for real-time decision making and to archive data for downstream analyses. For example, video can be analyzed to detect and alert operators of potential incidents, wrong-way driving, slow speeds/congestion, or pedestrian on the roadway. Image analyses can also collect data such as vehicle counts (parking or moving traffic), turning movements, vehicle types (truck, car, bicycle, pedestrian), and more. The field of image analysis is an area of significant growth using artificial intelligence, and more specifically, deep learning, further discussed in Section 3. The earliest example of image processing is through automatic license plate reader (ALPR) systems, as illustrated in Figure 5. These systems match images at a downstream sensor to estimate travel time and travel routes. Bluetooth and other lower-cost technologies supplant ALPR use, but ALPR continues to be used for law enforcement (e.g., stolen vehicle detection or toll violation), parking counts, and parking enforcement., An emerging complement to CCTV are unmanned aircraft systems (UAS), often called drones. This technology is introduced in Section 2.5.2.
2.1.6 Traffic Signal Data
Traffic system maturity and connectivity vary significantly, and with it are variations in the quantity, quality, and frequency of data to support all levels of decision making. In the absence of smart signals, traffic engineers use point sensors such as pneumatic tubes to measure traffic volume and estimate turning movements as needed, perhaps every 3 to 5 years. Data from these sources are typically aggregated at 15-minute or hourly counts for a few days. Engineers also use travel time data from vehicles called floating car studies, traversing corridors typically before and after signal improvements to measure changes in travel time and stop time at signals. These older data types are often stored in spreadsheets, potentially on an individual laptop rather than a server that can be accessed by broader users. An intermediary with traditional (non-adaptive) signal systems uses detectors placed a few hundred feet in advance of the signal, typically for demand-responsive timing, which also captures traffic volume data. The volume data may be stored and retrieved from the traffic signal controller.
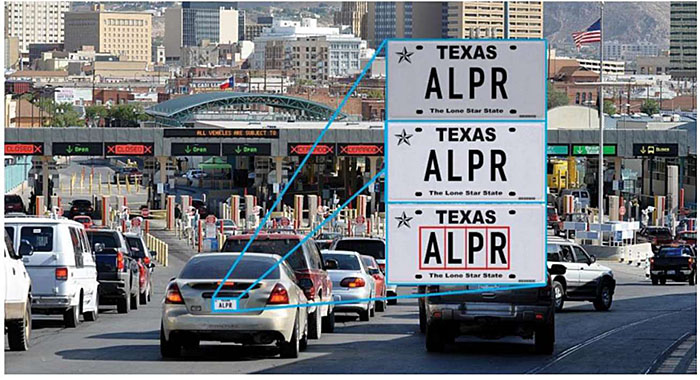
Figure 5. License Plate Reader Data Reduction Process Illustration. Source: Zmud, 2016.
More than a dozen adaptive traffic control systems (ATCS), most notably Split Cycle Offset Optimization Technique (SCOOT) and Sydney Coordinated Adaptive Traffic System (SCATS), collected traffic demand data in real-time to adjust traffic signal timing to optimize traffic flow in coordinated traffic signal systems from 2004 through 2010. These signals use multiple point sensors to improve through and turning movements for an intersection and across a set of intersections. ATCS often applies traffic models to identify signal strategies. ATCS requires communications and can be integrated with the agency’s ATMS. There are numerous vendors for adaptive traffic control systems, and data typically resides within the system. Figure 6 illustrates a conceptual high-level flow diagram for adaptive signal control with network characteristics, types of adaptive operations, and system interfaces.
Through collaboration between FHWA, AASHTO, state and city DOTs, the ATSPM systems technology emerged between 2012-2016, generating high-resolution data-logging and analysis capability to existing traffic signal infrastructure. A 2014 report by Purdue University and the Indiana DOT defined the portfolio of hundreds of discrete signal events captured from the signal controller and connected sensors to support system operations, maintenance, and safety.
With ATSPM, signal systems shift from a cyclical (3-5 years), citizen complaint-based, or emergency-based management to performance-based and preventative management. Figure 7 identifies the various hardware, sensors, communications, and software needed to deliver dashboards and analyses that drive operator decisions while Figure 8 summarizes many of the high-value performance measures from ATSPM.,
Figure 6. Adaptive Traffic System Conceptual Architecture.
Source: FHWA32.
The open-source code from Utah DOT or other vendor systems takes raw data files (1/10th second controller data logs) and aggregates the data to 15-minute bins through postprocessing using a set of metrics algorithms. The setup of ATSPM requires detailed intersection and sensor-specific information along with systems characteristics such as data latency correction for specific sensors or speed limits. ATSPM is not a sensor but rather a system to integrate traffic controllers and other intersection sensor data and make this data available through analytics platforms to support improved systems management decisions. A detailed list of ATSPM resources is available through the FHWA ATSPM site (https://ops.fhwa.dot.gov/arterial_mgmt/performance_measures.htm).
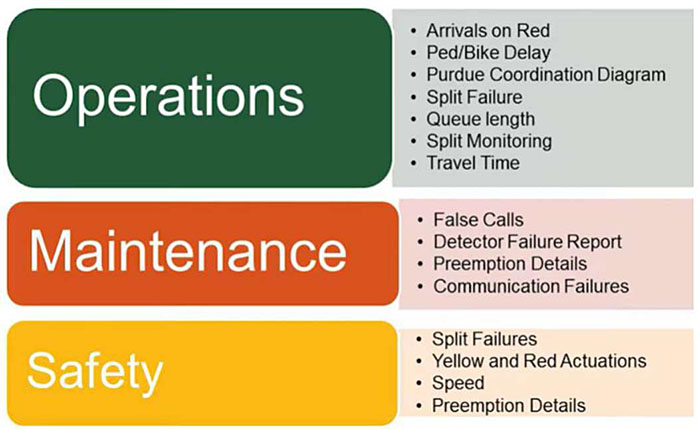
Figure 7. Performance Measure Categories from Automated Traffic Signal Systems. Source: Curtis34
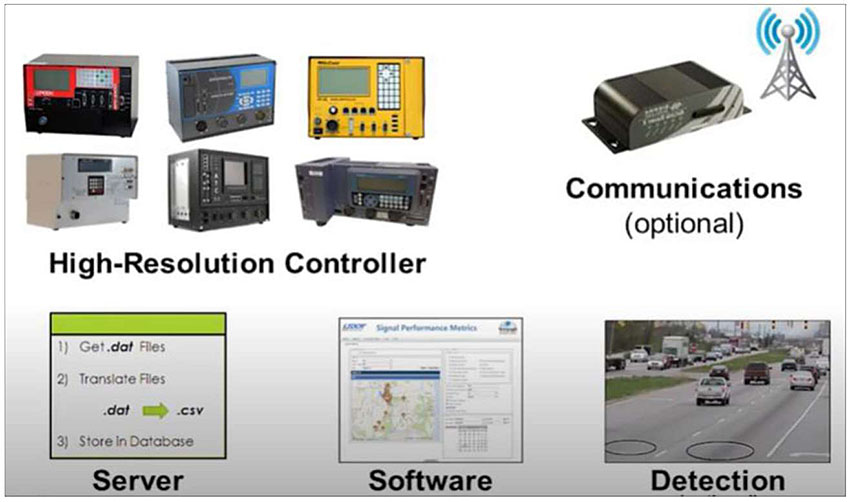
Figure 8. System Requirements for Automated Traffic Signal Performance Measures. Source: Gotfredson35
2.2 Traffic Operations Data
Transportation management centers operated by state and local DOTs generate data related to the operations of the transportation system. For example, the TMC operator will input data specific to incidents, including location, lanes blocked and duration, response deployed, and potentially other data specific to an incident timeline, as illustrated in Figure 9. These data are typically stored within the ATMS with manual/observational entry elements and automated data generation. Most agencies collect T1 and T5, but few collect all seven timeline elements, particularly in locations with limited sensor availability, such as CCTV. Some ATMS also enable operators to enter a checkbox for secondary crashes. With maturing ATMS systems with video analytics and AVL-enhanced vehicles, many of the timeline components may be passively recorded with far greater consistency, accuracy, and precision.
Transportation management center operators may manually log data safety service patrol (SSP) response data (e.g., number, location, and duration of incident response by type of response). Often the SSP will log this data through a mobile in-vehicle platform or paper logs. Data specific to the location and route may be collected from the SSP AVL or may only be available as a static planned log of routes and frequencies by time of day and facility.
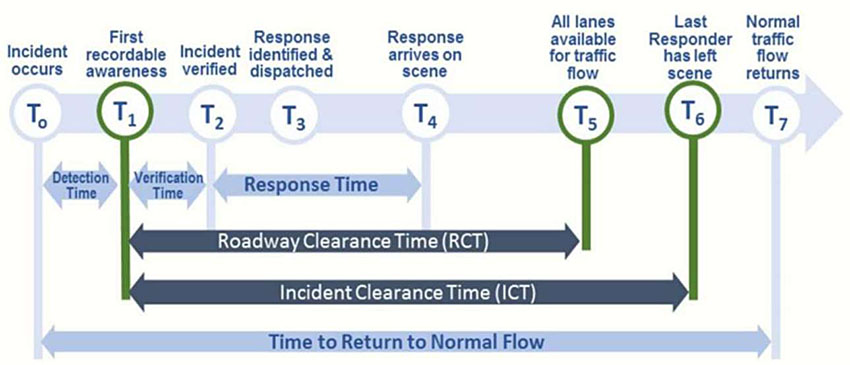
Figure 9. National Traffic Incident Management (TIM) Performance Measures. Source: FHWA36.
Many other operations decision data such as variable message signs postings of travel times, advisories, or variable speed limits are typically automatically logged within the ATMS. The TMC may also log activation and duration for dynamic ramp metering rates, dynamic part-time shoulder use, and other active traffic and demand management strategies. These structured, semi-structured, and often geocoded data support the refinement of operational strategies for traffic and demand management. The quality, completeness, and consistency of these data vary as a function of whether data are manually entered by operators or automated through time stamps of operator actions.
2.3 Crowdsourced data
Broadly defined, crowdsourcing is “the practice of addressing a need or problem by enlisting the services of a large number of people via technologies.” FHWA Every Day Counts Round Five (EDC-5) identifies transportation crowdsourced data as data collected through vehicle probe vendors (e.g., INRIX, HERE, TomTom, Verizon, Google, Street Light Data), mobile applications (apps) data (e.g., Waze, state 511 apps, 311 apps), and social media data (e.g., Twitter, Facebook).
- Data from most of these sources, apart from agency-owned apps, are typically not under the ownership and control of transportation agencies. Often data are black-box products with limited provenance (unclear what sources generate the data) and have limitations in use and sharing.
- Some data are actively submitted by travelers, while the preponderance of data is passively collected from travelers.
- Many of these data are unstructured, textual in nature, and non-standard, varying from one to the next data feed.
Common types of data generated through crowdsourcing include speed, travel time, events (e.g., crashes, stalled vehicle, flooding), infrastructure state (e.g., signal outage, potholes), travel behavior (route and mode choice), sentiment data (e.g., perception of agency or road performance). The following subsections provide details specific to vehicle probe, mobile application, and social media data.
2.3.1 Vehicle Probe Data
Vehicle probe vendors have been aggregating data using fleet and driver navigational GPS, cellular geolocation, and state DOT sensors for over a decade to provide real-time link speed data and archived origin-destination and path data. As of 2020, this data type does not offer traffic volume estimates. Vehicle probe data vendors now use connected vehicle data and provide analytics packages, transforming the data to support real-time decision making through alerts and performance measures. For example, INRIX announced in 2020 an intersection analytics platform that captures stop, go, and turning movements based on granular data from connected cars.
Agencies complement vehicle probe data with ITS infrastructure sensor data for more precise travel time and speed estimation on freeway and arterials roadways. Agencies are beginning to retire ITS infrastructure sensors between interchanges in favor of vehicle probe data while keeping the ITS sensors at interchanges to capture traffic volume and vehicle type data.
Most real-time vendors offer data on traffic message channel roadways segmented, a vendor-independent standard, and subsegment based on vendor-specific standards. For example, INRIX provides INRIX XD segments, dynamically defined with data granularity to a tenth of a mile. Data fields vary by vendor and vendor product. They typically include reference speed (speed limit), current speed, historical average speed, travel time, congestion level, segment identification, and data confidence or quality metric. Vendors also provide graphical representations of road speed parameters, called traffic tiles, used as 511 web or mobile map overlays. Data are transmitted through a web service application programming interface (API), often using Hypertext Transport Protocol (HTTP) through XML or JavaScript Object Notation (JSON) format. HERE, INRIX, and TomTom interface guides available through The Eastern Transportation Coalition (TET Coalition) offer detailed information on road network architecture, data and map specifications, and API calls. The following are general characteristics specific to vehicle probe data:
- Most real-time vehicle probe data are transmitted at a one to two-minute frequency.
- The vendor agreement specifies the terms, conditions, and limitations for the use of their data. These include, for example, who may access the data and for what uses.
- The quality and coverage of vehicle probe data have improved significantly and continues to improve, particularly for arterial roadways. Data users should pay attention to data transmission settings that may embed historical data where real-time data are unavailable. As such, transmission settings may produce data that dramatically misestimates current traffic conditions. Since 2009, the TET Coalition has been validating vendor data from INRIX, HERE, and TomTom, mainly for freeway road segments using Wi-Fi and/or Bluetooth sensors. The TET Coalition also conducted arterial validation in the years 2015 and 2019. Data validation reports are publicly available (https://tetcoalition.org/projects/transportation-data-marketplace/).
- Some agencies validate vehicle probe data using their point infrastructure data. The validation of these data in one region or corridor may not reflect similar accuracies in another region due to the variances in traveler or fleet use of specific smartphone or navigation devices.
- Many agencies use analytics services (e.g., RITIS and iPeMS) to ingest and process vehicle probe data. A few agencies have developed their analytics platforms in-house or through consultant support (e.g., Indiana DOT Traffic Ticker and Delta Speed tools) with support from local universities. These analytics applications are described in Section 4, decision making examples.
- The cost of these data varies by the size of the road network for which data is required, vendor, and level of data sharing, often exceeding a few hundred thousand dollars annually. Moreover, due to network segmentation differences, shifting from one vendor to another is a significant undertaking.
State and metropolitan planning organizations (MPOs) can also access archived probe data on the National Highway System (NHS) from FHWA through the National Performance Management Research Data Set (NPMRDS). This data is made available through RITIS and is based on data from INRIX as of 2017, previously provided by HERE.
Archived data vendors that provide origin-destination and path data also used anonymized location records from smartphones and navigation devices in connected cars and trucks. INRIX Trips and StreetLight Data are two vendors offering this type of data. Analytics also offered by these vendors can provide data such as annual average traffic counts, demand and routes between zones, modal use, turning movements, and other metrics to support transportation planning. As with real-time probe data, validation of these data in one region or corridor may not reflect similar accuracies in another region due to the variances in travelers’ use of specific smartphone service providers or navigation devices.
2.3.2 Mobile Applications Data
The most prevalent source of free mobile application data is through the Waze for Cities partnership (formerly Waze Connected Citizen Program), which uses active and passive data collection. Many state, county, or city agencies also collect data using 511, 311, and other apps, mainly through active reporting by travelers that use their app. These mobile applications generated data are described here.
Waze for Cities derives data from its navigation app users, who actively report traffic and event data, and passively share GPS location data. Hundreds of towns, cities, counties, and states are Waze for Cities partners and access the open-source data. Waze for Cities partners can visually observe data through Waze’s traffic viewer tool and can acquire jams and alerts data every two minutes using XML or JSON formats through an API.
Many agencies now make available Waze reports as a layer within their 511 platforms. For some agencies, data attribution may present a partnering hurdle with Waze. As of 2020, the Waze preference is to only attribute live data when used in the agency’s traveler information system, with requirements to remove Waze attribution as the data becomes old and is used through analyses of archived data. Data from Waze is geospatially tagged and includes timestamp, latitude/longitude location, average speed, jam length, road type, reliability score (16), and confidence score (0-10) data. Alert data also includes a jam category and accident, road closed, and weather hazard categories, each with the following subcategories:
- Accident refers to crashes and is categorized as a major, minor, or unspecified type. These data are based on reports from Waze users with inherent imprecision.
- Jam refers to the level of traffic, with standstill, heavy, moderate, and light subtypes. There is no clarification available between these subtype definitions and the GPS-based travel time Waze pulls from its users.
- Road closed subtypes include construction (typically sourced from the DOT, occasionally input by Waze users), event, hazard, and unspecified.
- Weather hazard is a “catch-all” category with on-road subtypes (car stopped, construction, ice, lane closed, object, pothole, roadkill, or traffic light fault), shoulder subtypes (car stopped, missing sign, animal, or unspecified), and weather subtypes (flood, fog, hail, heavy snow, and many others). These data are generally entered by Waze users. The construction and road closed are also based at times on data shared by Waze for Cities partners.
| Type of Event |
Matching |
| % DOT Matched to Waze |
Average Time that a Waze Event was Reported Before a DOT Event |
| Freeways/Ramps Crashes |
40% |
3 Minutes |
| Primary/Secondary Crashes |
12% |
3 Minutes |
| Freeways/Ramps Disabled Vehicles |
37% |
14 Minutes |
| Primary/Secondary Disabled Vehicles |
4% |
16 Minutes |
Figure 10. Waze Crash Matching for Three State Transportation Agencies. Source: University of Maryland Center for Advanced Transportation Technology.
Validation is one challenge with Waze alert data. For example, travelers may report events based on their perception when approaching an event. A report of a minor crash may actually be a stalled vehicle or vice versa. The Virginia Transportation Research Council (VTRC) compared Waze crash data along a 3-mile urban freeway with CCTV data. Based on the analyses by VTRC, Virginia DOT summarized whether Waze-reported crashes could be confirmed using CCTV data, noting that Waze first reported the incident correctly on 38 percent of instances. A 2018 study by the University of Maryland Center for Advanced Transportation Technology compared data for three States to estimate the percentage of Waze reports that matched transportation data and the average time Waze reports preceded the transportation agencies’ awareness of a roadway crash and disabled vehicles, as illustrated in Figure 10.50
That said, states and local agencies find tremendous value from Waze data for situational awareness, quicker incident detection, and the ability to detect many more incidents than their traditional freeway-centric sensor infrastructure. Each agency varies in how data from Waze is shared, with some posting all crash data without verification, and others only posting data after verification.
The Iowa DOT observed that information from Waze first alerted TMC operators of an incident 23 percent of the time while traditional methods (CCTV, safety service patrol, or 911 calls) first alerted TMC operators of an incident 77 percent of the time. Tennessee DOT uses Waze speed, incident, and jams data to enhance and expand queue detection techniques that previously used roadway detector equipment. Using Waze data, the agency detected crashes, stopped vehicles, and queuing more quickly over greater geography, as shown in Figure 11.
Waze for Cities partners can also specify road segments using the traffic viewer tool and pull travel time data from this tool at two-minute intervals. This data is based on passively collected GPS data from Waze users and other data procured by Waze. Lake County, Illinois, and Rhode Island DOT are two agencies that use the free Waze travel time data rather than vendor probe data. Waze for Cities partners can also designate certain Waze users as “municipal users” and track their vehicle fleet-generated data use Waze’s Traffic Viewer tool.
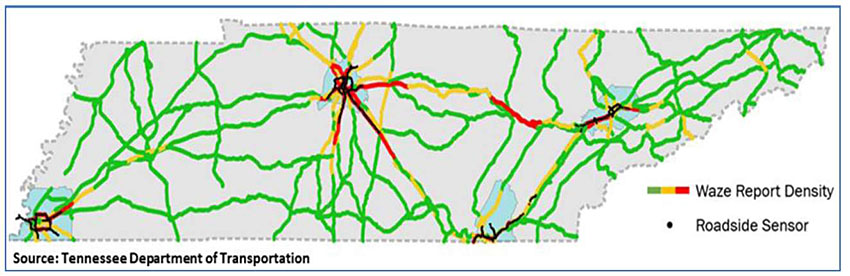
Figure 11. Tennessee DOT Waze Report Density versus ITS Roadside Sensor Coverage.
Waze also sources road closure data from its Waze for Cities partners. The process for sharing this information is evolving. A unique relationship growing among Waze for Cities partners is with their region’s Waze Map Editors, a voluntary group of individuals that Waze geographically sources to update Waze maps. Improving the relationship with the volunteer map editors enables agencies to change Waze road networks more quickly, and consequently, Waze routing algorithms. A few agencies have been fortunate to find that a DOT employee is a Waze map editor (e.g., Maryland DOT and Pennsylvania Turnpike), which streamlines network responsiveness to road closures.
311, 511, and Other Apps can collect data from travelers to provide traffic operators with more timely information on the state of the road system and expedite transportation infrastructure maintenance. In 1997, the Federal Communications Commission designated 311 as the phone number for non-emergency local government services. Since then, 311 has been integrated with web and mobile platforms using customer relationship management (CRM) software that enables citizens to report and geotag signal outages, missing signs, roadway debris, potholes, and other transportation as well as non-transportation issues.
Some cities, counties, and states develop their own 311 apps, but most rely on vendors for 311 app development. Hundreds of agencies use the vendor platforms such as SeeClickFix or PublicStuff, customized to their agency., Illustrated in Figure 12 is the Anne Arundel County, Maryland 311 app, which uses the SeeClickFix platform branded to their County. Illustrated in this figure are two posted reports related to carcass removal and signal timing. These apps more broadly field citizen reports associated with housing, trash collection, zoning ordinance violations, and other issues to be addressed by the governmental agency.
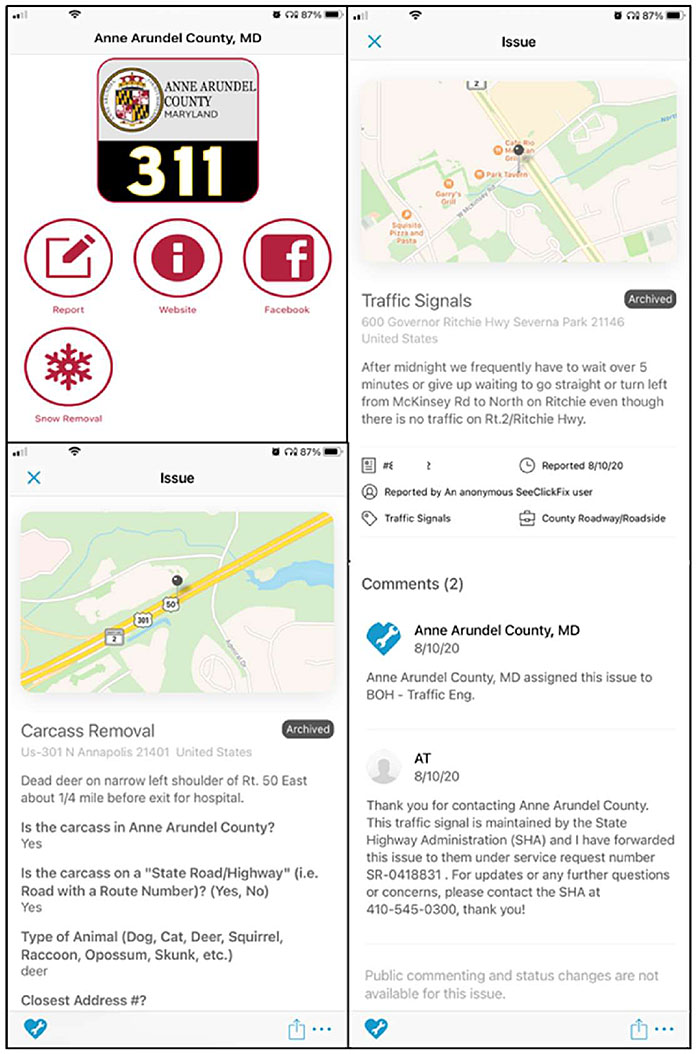
Figure 12. Anne Arundel County, Maryland 311 App. Source: Anne Arundel County, Maryland Mobile App powered by SeeClickFix.
Traditionally, 511 systems offered phone and web-based travel information. Many states and cities expanded their 511 to a mobile platform between 2010 and 2015 (e.g., New York State DOT in 2011, Colorado DOT in 2012). A few agencies now enable 511 app users to report incident information on the app platform. The data is typically semi-structured or unstructured and frequently not integrated with an agency’s ATMS. The user reports are channeled to the agency’s CRM system. For example, Delaware DOT’s 511 app allows users to report over 20 road-related issues, as illustrated in Figure 13. The app enables the user to define the location, share a photo, and provide detailed text on the incident situation. The app also allows the user to provide a contact phone or email for a follow-up response. The app requests that more immediate issues be reported by phone to the TMC and provides the phone number.
Like the Delaware DOT 511 app, the Virginia DOT’s 511 app provides a link to a web-based issue-reporting CRM platform (vdot.virginia.gov/travel/511.asp) with image and geotag capability and a phone option for reporting the more immediate transportation-related issue.
Some state and local agencies have developed apps that focus on a specific need. Utah DOT’s Citizen Reporting Program works to enlist and train volunteers to use an app to consistently report weather and pavement condition-related issues along mountainous and rural terrain. The training module ensures consistency between users in interpreting various pavement and weather conditions. The training and reporting interfaces are illustrated in Figure 14. Incoming data from the app is integrated with road weather information systems, meteorological, and other data to send out information to travelers through the DOT’s 511site and Twitter feed.
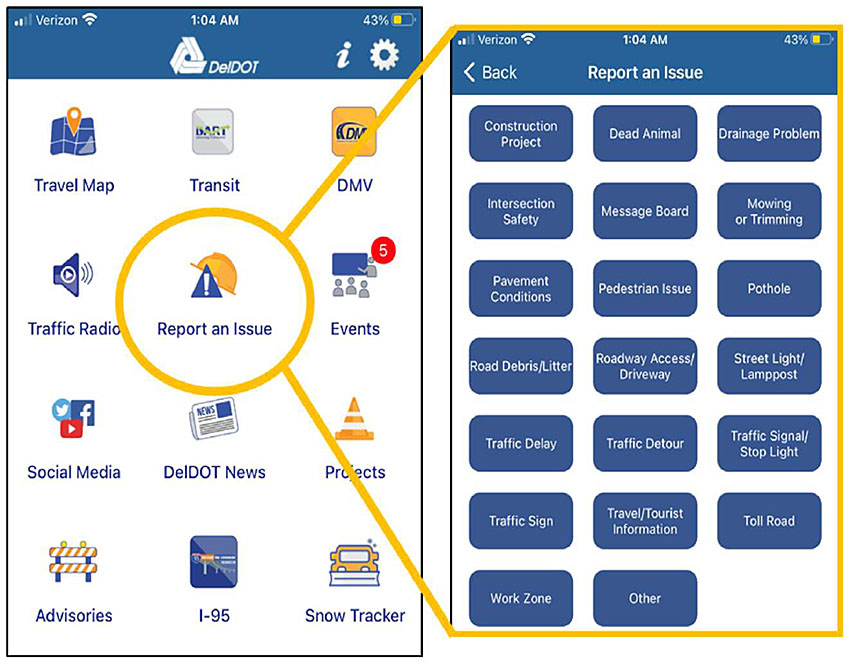
Figure 13. Delaware DOT 511 App Supports User Reporting of Issues. Source: Delaware DOT.
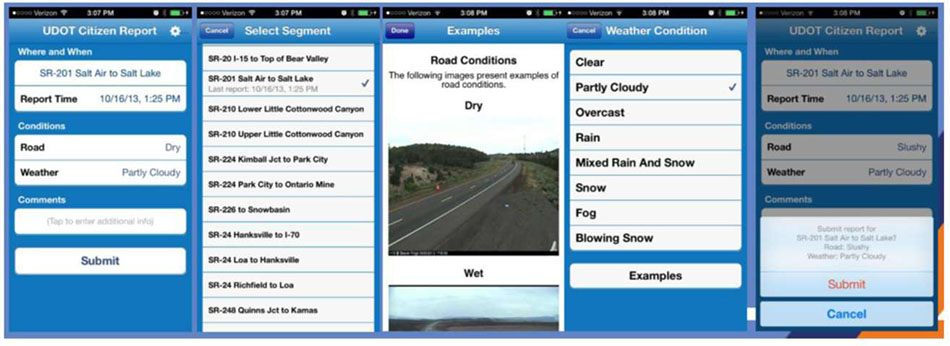
Figure 14. Screenshots of the Utah DOT Citizen Reporter App. Source: Utah DOT.
2.3.3 Social Media Data
Most state and local agencies use Twitter, Facebook, or other platforms to share information with travelers. Agencies differ in their use of social media; some only broadcast information, others engage in two-way communications by monitoring and responding to social media messages. Agencies’ social media broadcasts typically include videos, photos, links, and text information. The information broadcasted typically reflects public safety announcements (e.g., work zone awareness, seat belt use, and Move Over campaigns), road impacting alerts (e.g., blizzard warning, crash, or road closures), new or improved initiatives or programs, or calls for public input (e.g., long-range planning, public engagement, or reporting issues).
Agencies typically have dedicated staff within the communications office to broadcast content. They may use public relations software for media monitoring and business intelligence (e.g., Meltwater, Crison, Hootsuite, or Sprinklr), for example, to assess sentiment towards a new agency initiative. For example, Iowa DOT uses Meltwater to review data related to audience demographics (age, gender) and engagement statistics for Twitter (e.g., likes, retweets, post link clicks) and Facebook (impressions, engagement, and link clicks). From May 2019 to May 2020, their Facebook page outreach improved across three metrics, as illustrated in Figure 15.

Figure 15. Iowa DOT Facebook Performance for Nine Pages with Operations Content. Source: Iowa DOT, 2020.
Some communications offices also engage with the public in creative ways. For example, Texas DOT held a digital sign contest asking their social media followers to submit a creative safe-driving message and vote among ten finalist messages, with winners’ messages to be posted on state DMS (Figure 16).
Specific to operations, many agencies use a Twitter handle with “511,” linked to traveler information. For example, 511SF Bay, the San Francisco Bay area traffic Twitter feed, uses this platform to share broader traffic, transit, rideshare, bicycling, and parking information. State DOTs, such as Ohio and Iowa, often provide district or region-specific 511 Twitter and Facebook feeds. Individuals can subscribe to the feed that reflects their region of travel.
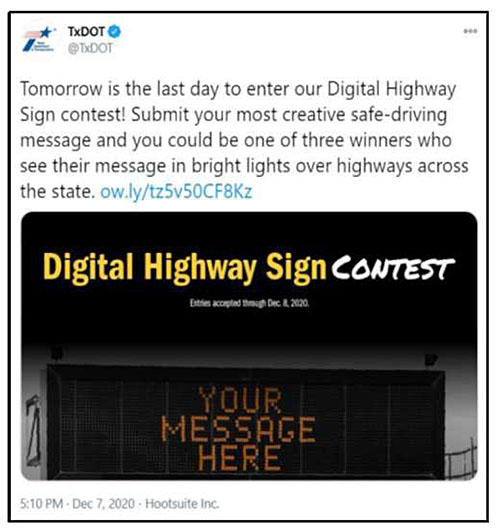
Figure 16. Texas DOT Tweet (Dec 7, 2020).
The two-way operations-focused communication is led by the central communications office, the TMC, or as a joint function. When Twitter, or less frequently Facebook, comments communicate an issue or incident, the transportation agency can make operational decisions based on this information. Iowa DOT, for example, has a policy to respond to every message within 15-minutes and to forward a message to the appropriate district or local authority. The monitoring is generally a manual process limited to messages communicated to the agency’s social media feeds. For example, the Iowa DOT maintains and actively monitors both 511 Twitter and Facebook presence at the state and regional levels. Figure 17 illustrates an example of a Twitter exchange related to signal malfunction.
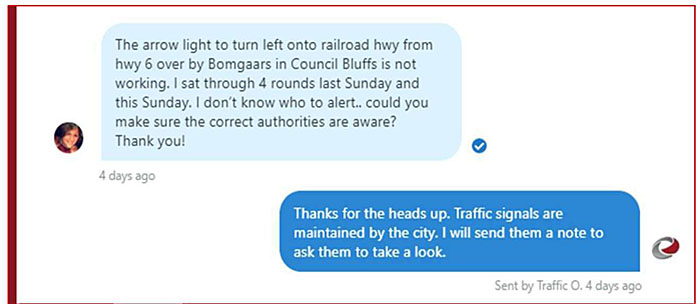
Figure 17. Iowa DOT Responds to 100% Twitter Comments within 15 Minutes. Source: Iowa DOT, 2020.
While some efforts have explored the use of advanced analytics to mine social media data for traffic incident detection, the monitoring function as of 2020 remains a manual process. An example of advanced analytics capability was developed for the Pennsylvania DOT by Qian. This prototype, shown in Figure 18, extracted real-time tweets from Twitter using the representational state transfer (REST) API. The capability filters tweets to pull incident information and enables visualizing the tweets on a map. The interface uses the Twitter text message, timestamp data, and tweet location (latitude, longitude) if the user has allowed Twitter to share their location.
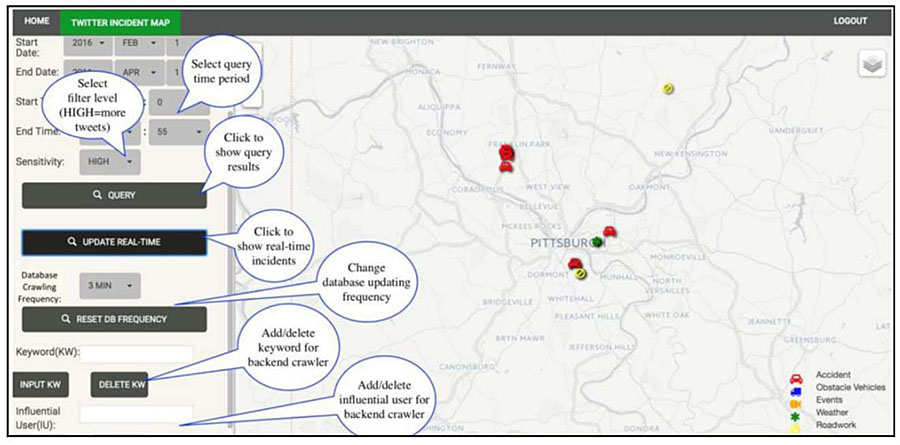
Figure 18. Control Panel for Twitter Real-Time and Archived Visualization. Source: Qian, 2016.
2.4 Transportation Adjacent Data
Often data generated by public and private entities outside transportation hold significant value for transportation operations. Examples of transportation-adjacent data include weather data from the National Weather Service, public safety computer-aided dispatch (CAD) data from law enforcement or fire agencies, or law enforcement crash report data from a Department of Motor Vehicles (DMV). Data from planned events such as concerts, professional sports, or festivals also hold significant value for transportation operations. In this section, crash reports, CAD, and weather data types are discussed in greater detail.
2.4.1 State Traffic Records Data
Each state has its own laws and process for how, when, and if a vehicle crash is to be documented through a police report and aggregated to state traffic records. The National Highway Traffic Safety Administration (NHTSA) states that every state should “maintain a traffic records system that supports the data-driven, science-based decision making.” The traffic records system includes the collection, management, and analysis of traffic safety data. These data are useful in planning for traffic incident management and traffic safety. State traffic records data comprise six core data systems: crash, vehicle, driver, roadway, citation and adjudication, and injury surveillance. NCHRP Report 904 provides a summary of each data system element and guidelines applicable for each data system (e.g., Model Minimum Uniform Crash Criteria (MMUCC) for crash data or Model Inventory of Roadway Elements (MIRE) for roadway data). These data in most states use a combination of electronic and paper records; the latter often results in less precise information and months delay in data upload compared to electronic records. Some data are not available due to PII, and data fields and definitions may vary from one state to another. NCHRP Report 904 classifies the level of data readiness for the six data systems across 10 categories.
2.4.2 Computer-Aided Dispatch (CAD) Data
Public safety agencies (law enforcement, fire and rescue, and EMS) use CAD systems to catalog and coordinate activities. Because most road incidents are first detected through 9-1-1 calls, CAD is an invaluable source of real-time incident data for TMC operators. CAD data support incident detection, notification, and response. Data fields include personnel logs on/off time, timestamped incident detection, field personnel assignment, dispatcher actions, and field personnel actions, including free-form text. Because CAD is recorded using an event database, wherein each row is associated with a single action, processing this data requires extraction and comparison of multiple data rows. Specific data to support TMC operations include incident detection and verification times, responder type and arrival times, incident type and severity, lane block and opening times, secondary crash occurrence, and responder scene departure times. Following are considerations for accessing CAD data:
- Agencies are sometimes challenged in ensuring that the right types of incidents (e.g., roadway crashes and not domestic violence) reach the TMC, and that PII is not transmitted to the TMC operator. For instance, the free-form fields could contain potentially sensitive information. State DOTs must adhere to the Criminal Justice Information Services (CJIS) and the Health Insurance Portability and Accountability Act (HIPAA) requirements for handling sensitive CAD data.
- CAD systems vary by vendor and have proprietary formats or other issues preventing the real-time export of data. Systems may require significant data translation efforts. Consequently, state operations may have gaps in accessing CAD data in some regions.
- There is a cost associated with filtering and sharing CAD data. The financial responsibility/uncertainty about maintaining the data feed may prove a challenge.
- The absence of an interagency agreement, data sharing policies, or data security processes may prevent the CAD provider agency from sharing this data.
The FHWA Every Day Counts Round Four initiative, Using Data to Improve TIM, identified nine state agencies that fully integrated CAD with their ATMS systems (Washington, Oregon, Minnesota, Wyoming, Wisconsin, Oklahoma, Florida, West Virginia, and Delaware). Full integration means automated processes bring select data elements from relevant CAD events (transportation-related events) into the state’s TMC software and potentially update events as the incident proceeds. The software will display incident details and map-based alerts to assist operator response. Many other states have lower integration levels where CAD data may be visible through a dedicated computer screen or window but requires manual entry or copy/paste into the TMC software. In nearly a third of the states, the public safety dispatch centers notify TMC operators of incidents through a call or email, often only when assistance is needed.
2.4.3 Weather Data
Beyond the transportation agency RWIS, managers obtain road weather information from many sources. The National Oceanic and Atmospheric Administration (NOAA) provides raw weather data free of charge, but they come with expertise and cost requirements to process, store, and make them usable. The National Weather Service (NWS), a part of NOAA, provides weather, water, and climate data in addition to forecasts and warnings. The Meteorological Assimilation Data Ingest System (MADIS) integrates NOAA and non-NOAA data (including RWIS and Clarus weather telematics) and shares them in real-time. The Federal Aviation Administration, the US Geological Survey, the Department of Agriculture, the Forest Service, and the Environmental Protection Agency also generate weather data useful for specific regions. Private vendors provide high-resolution, route-specific road weather information for transportation managers and operators. Weather data includes the following:
- Atmospheric fields such as air temperature and humidity, visibility, wind speed and direction, precipitation type and rate, cloud cover, tornado or waterspout occurrence, lightning, storm cell location and track, and air quality.
- Water level data include stream, river, lake levels near roads, and tide levels (i.e., hurricane storm surge).
- Pavement fields include pavement temperature, pavement freezing point, pavement condition (e.g., wet, icy, flooded), pavement chemical concentration, and subsurface conditions (e.g., soil temperature).
These data inform proactive and real-time decisions. For example, Missouri DOT planned road closures based on NOAA/NWS river gauge and hydrograph predictions.
2.5 Emerging Big Data and Sensor Technologies
The availability of low-cost communications and numerous sensors offers new opportunities to collect, analyze, and use data, most promising through connected technologies (vehicles, travelers, and infrastructure), UAS, and other emerging data. These technologies, categorized as emerging as of 2020, are different in terms of volume, variety, velocity, processing, security, and use. Agencies are developing the capacity to access and make use of these data, which hold tremendous potential. This section will highlight the types of data generated from emerging data sources.
2.5.1 Connected Vehicle, Traveler, and Infrastructure Data
Connected vehicles use communication technologies to share data with other vehicles, road infrastructure, and cloud infrastructure without an active driver or passenger input. Automated vehicles, those that have some aspect of control (steering, braking, etc.), are equipped with dozens of sensors (side radar, sonar, GPS, Light Detection and Ranging (LIDAR), camera, engine diagnostics) and microprocessors to store and transmit data. A connected traveler is one who uses a mobile device generating and transmitting status data, including the traveler’s location, trip characteristics (e.g., speed), mode and status (e.g., riding in a car, riding on transit, walking, biking), departure time, and destination choice.
Data from connected and automated vehicles are routinely used in the automotive industry for dealer/maintenance services, infotainment, and location-based services or advertisements. The connected vehicle ecosystem, illustrated in Figure 19, highlights the various data generated from the vehicle and specific data customers.
The USDOT ITS Joint Program Office initiated connected vehicle pilots in 2015, with concept development and testing through 2020 in Wyoming, New York City, and Tampa. These pilots spurred technology development, measured deployment benefits, and addressed technical, institutional, and financial issues. ATSPM is an example of connected infrastructure.
In 2015, Gartner estimated approximately 250 million connected cars globally by 2020, while a 2017 Strategy& PwC report estimated 470 million connected vehicles by 2025. Regardless the projection, multiple vendors process connected vehicle data and offer services to support transportation decision making. For example, Otonomo’s automotive data service platform offers status attributes (door, battery, fuel), traffic data, parking data, and hazard data. Wejo touts 18 million active vehicles, with 52 million accessible vehicles generating 4.8 trillion data points. INRIX and HERE both access and use connected vehicle data to improve their vehicle probe traffic data quality. The volume of data generated by connected vehicles can quickly exceed terabytes per day; thus, for transportation operations and planning, access to connected vehicle data should focus on specific data types and uses.
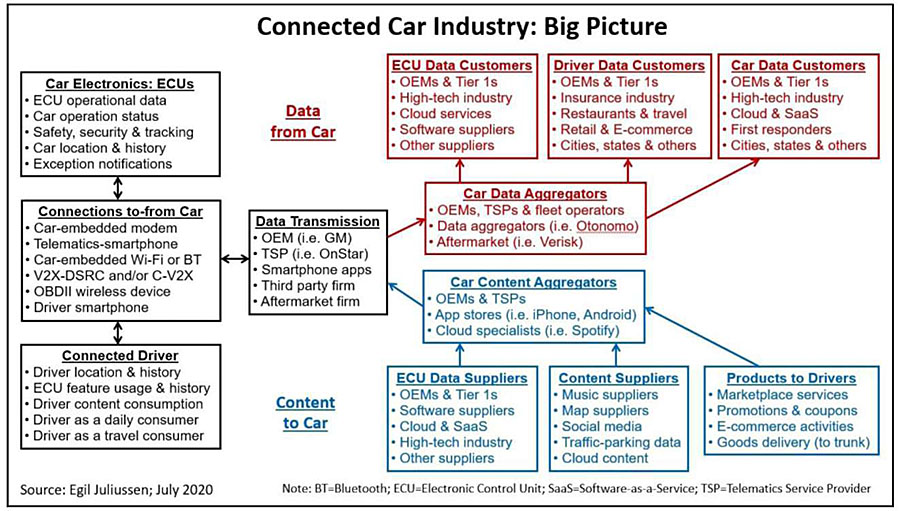
Figure 19. Connected Car Industry Big Picture. Source: Juliussen, 2020.
Many vendors are emerging with technologies that leverage mobile devices, cloud services, and sensors. For example, iCone offers a suite of products that communicate real-time work zone data through a user interface. The Virginia Tech Transportation Institute is testing real-time threat detection and warning algorithms embedded in wearable devices such as work zone vests in conjunction with connected and automated vehicles. HAAS Alert and Make Way now offer responder-to-vehicle and responder-to-responder alert technologies that automate traveler notifications of approaching responders’ activity using the Waze platform., Each vendor provides performance data associated with alert activations. The market for services that improve traffic operations will continue to grow, and in the process, also bring forth newer, more granular data for refining operations.
2.5.2 Unmanned Aircraft Systems (UAS) Data
UAS, commonly called drones, can capture high-resolution video as well as other data, based on the suite of sensors embedded with the UAS, to improve operations, construction, inspection, and safety. UAS can transmit data in real-time/in-flight or store data (flash memory card) for transmission at the flight’s conclusion. Multiple software vendors process data for specific application areas. For example, Figure 20 illustrates a composite image based on 107 images collected over three UAS flight paths for a major roadway crash in Tippecanoe, Indiana. The three flights required a total of 69 minutes to map the entire crash scene.
High-value use cases for UAS include asset inspection, law enforcement crash investigation, and situational awareness. The FHWA EDC-5 UAS and the FHWA EDC-6 Next Generation TIM programs provide details and use cases for high-value applications of this technology, such as monitoring of incidents, alternate routes, and queuing. UAS uses are expanding. For example, a 2019 report by the Massachusetts DOT explored the use of UAS to collect traffic data on roadways and estimated UAS and video processing to have a count accuracy of 93 percent and a speed data error rate of 6.6 percent.
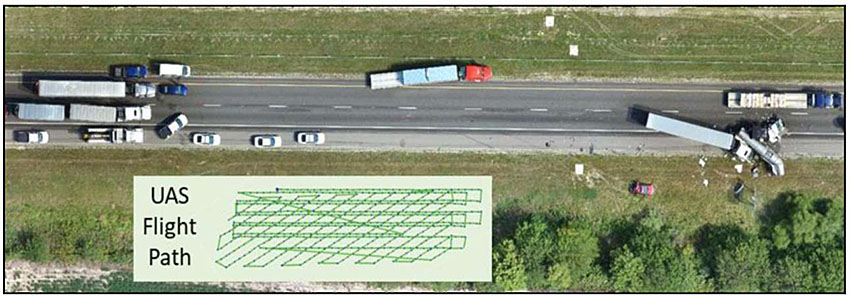
Figure 20. Tippecanoe UAS Mosaic Composed from Three Flights. Source: Tippecanoe Sherriff’s Office.
State and local agencies have demonstrated the benefits of UAS for traffic incident management. For example, a Washington State Patrol pilot test in 2018 estimated an 80 percent reduction in road closure time based on 125 UAS deployments, saving $4.2 million in economic impact. The Tippecanoe County Sheriff’s Office in Indiana estimated a 60 percent reduction in scene clearance time for fatal and serious injury crashes using UAS compared to traditional crash scene investigation methods.
- Agencies are still working towards cohesive strategies for the storage, security, privacy, and accessibility of these. A 2018 UAS Peer Exchange noted that “the datasets being stored can vary dramatically in size. Some agencies found that locally storing data was sufficient for their purposes, while others found they needed to set up complex data transfer and storage architecture, employing sending data over 4G cellular service.” Legal and regulatory considerations on the use of UAS are also evolving with the Federal Aviation Administration (FAA) and state legislation emerging. The National Conference of State Legislatures published in April 2020 a listing of UAS laws.
2.5.3 Other Emerging Data
Transportation agencies can access a host of other emerging data to support operational decisions. In 2019, Georgia DOT completed a test for transforming a single fiber within a roadside fiber-optic cable into an array of distributed sensors to approximate travel speed, queue, congestion, journey time, vehicle count, and flow using acoustic sensing technology. A preliminary test along Interstate 20 in Atlanta, Georgia, indicates that their vendor solution delivered “accurate and timely traffic flow information using an existing roadside fiber as a traffic sensor.”
Some cities can access data related to transportation network companies (TNC) trips, to support policy and investment decisions, particularly as they affect changes in movement and transit use. These data are often truncated to manage PII and generally are a challenge to access, given the for-profit competitive advantage concerns among services such as Uber, Lyft, and Via. Similarly, micromobility data may be available to agencies to support operations and planning functions related to equity, safety, usage, and environmental effects from shared scooters, bicycles, and other shared mobility solutions. The data can range from demographics, temporal and spatial usage, and trip lengths to durations and accessibility. Often data are rounded, for example, trip start and end time rounding to nearest 15 minutes, or fares rounded to the nearest $2.50. Other data examples may include injury-specific data, parking sufficiency, or state of repair. The City of Austin collects and shares aggregate scooter and bicycle mobility data publicly, as illustrated in Figure 21.
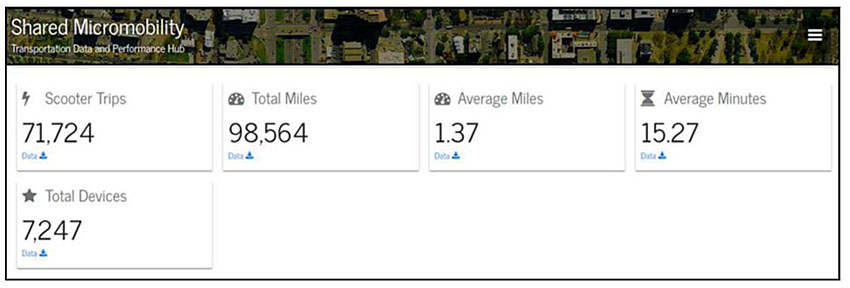
Figure 21. City of Austin Shared Mobility Dashboard. Source: https://data.austintexas.gov/stories/s/Mobility-Dashboard/gzb5-ykym/.
Return to top ↑
3. Techniques and Tools to Transform Data and Inform Decisions
The previous section outlined the broad sources and types of data available to traffic operations to support real-time and strategic transportation decisions. This section first introduces performance management and how it guides the selection and use of data and analytics.
Next, this section delves into the broad classes of analytics available to transform data into information for real-time and strategic decision making. Most transportation professionals are familiar with the concept of capability maturity models (CMM). The FHWA provides CMM frameworks for most aspects of operation programs, through the lens of Transportation Systems Management & Operations (TSMO). In the same vein, there are many models for data and analytics capability maturity. One such example is the TDWI Analytics Maturity Model that describes an agency’s overall analytics maturity across organizational, resources, data infrastructure, analytics, and governance.
This section closes with a discussion on the importance of understanding the nature and quality of data before using it to derive performance measures, and especially before using it to inform decisions.
3.1 Performance Management
Performance management is the process of ensuring activities and outputs meet an organization’s goals in an effective and efficient manner. NCHRP Report 660, Transportation Performance Management: Insights from Practitioners, notes that “performance management provides a framework that can help transportation agencies set realistic goals, focus on the most important challenges, and improve efficiency.” Without a performance management framework, agencies can quickly become overwhelmed with data, complex analytics, and too many performance measures that may collectively even be conflicting in nature.
The Federal Highway Administration provides detailed guidance, case studies, and training in defining goals, objectives, and performance measures. Figure 22 illustrates the FHWA transportation performance management (TPM) framework, which outlines the six numbered components and four-lettered components. For more information, the TPM Guidebook offers a chapter for each of the ten components and relationships between components. The TPM Self-Assessment and Resources Library help agencies, and programs within agencies, define performance goals and measures.
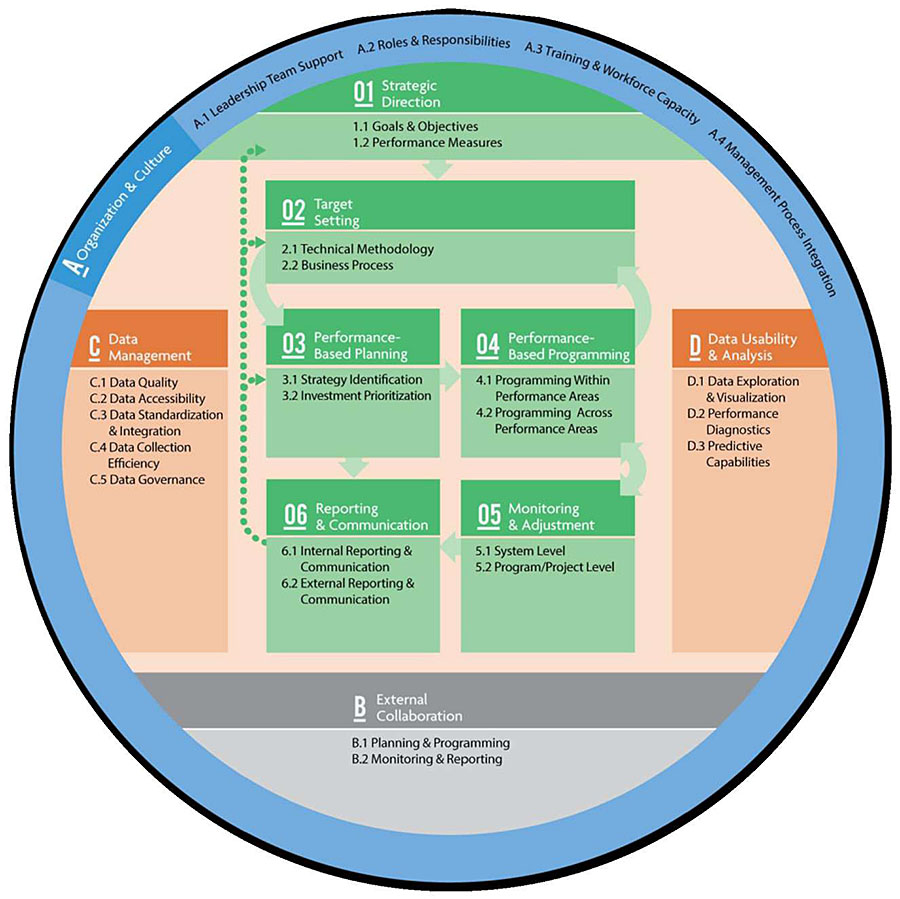
Figure 22. Federal Highway Administration Transportation Performance Management Framework (Federal Highway Administration n.d.)
The FHWA also requires that state DOT and MPOs baseline and set targets for certain transportation performance measures related to pavements, assets, operations, freight, and congestion mitigation, and air quality (CMAQ). These are based on the 2012 Moving Ahead for Progress in the 21st Century Act (MAP-21), which established a national highway performance program (NHPP) with seven federal aid highway program goals related to safety, infrastructure, congestion, system reliability, freight movement, environment, and project delivery. The performance measures also reflect the 2015 Fixing America’s Surface Transportation (FAST) Act, which shortened the time frame for state and MPO progress towards meeting NHPP performance targets, and required agencies that failed to make significant progress towards their freight performance targets to include in their next performance report the actions it will take to achieve the targets. The FHWA published the third and final rule for the FHWA National Performance Management Measures in 2017, with key implementation timeline updates in 2018.
State DOTs and MPOs are required to establish baseline and targets for each prescribed performance measure. For example, one required performance measure, level of travel time reliability, is defined as the ratio of the 80th percentile travel time of a reporting segment to a normal travel time (50th percentile), and requires 2-year targets for the Interstate system and four-year targets for non-interstate roadways.
Data from ITS Infrastructure and related sources is central to national, state, and local performance measures, not only for real-time and strategic transportation systems management and operations (TSMO), but also for broader asset management, investment planning, and workforce planning. For example, data specific to traffic counts and percentage of traffic by weight class often feed pavement management systems tools to predict pavement state of repair and estimate lifecycle. Data related to origin-destination and travel paths are used by transportation planners for calibrating and validating models for future demand and network performance. Data on the specific forthcoming severity of weather events can affect staffing decisions.
Forward-thinking, agencies map their mission to goals, their goals to objectives, and performance measures and targets to each objective. Ohio DOT, for example, defined 20 performance measures across fifteen objectives and four goals (safety, reliability, efficiency, and coordination) for their TSMO program, as illustrated in Figure 23.
They use performance measures such as travel time, volume, crash frequency, and incident clearance times to ranks corridors for improvements, using their Traffic Operations Assessment Systems Tool (TOAST) to support investment decision making.
| Level |
Program Objectives |
Performance Measures |
| Program Measures |
Reduce secondary crashes caused by traffic incidents |
Percentage of secondary crashes to primary crashes on monitored freeways |
| Reduce work zone related crashes |
Frequency of work zone crashes |
| Reduce roadside “struck by” incidents |
Frequency |
| Maximize free flow travel time on Ohio’s freeway system |
Percent of time motorists experience free flow travel time (TTRI) |
| Increase resilience of the transportation system to winter weather events |
Percent of routes that recover speeds within 10 MPH of the expected speeds within 2 hours of a snow event ending |
| Reduce Incident clearance |
Duration |
| Reduce Roadway clearance |
Duration |
| Optimize signalized corridors |
Percentage of corridors retimed per year |
| Reduce work zone traffic delays |
Number of hours the operating speed is less than 35 MPH per monitored work zone |
| Provide consistent incident response and management across the state |
Percentage of TIM trained emergency responders in state (DOT/Public Works, Fire, Police, Towing, EMS) |
| Secondary Measures |
Optimize signalized corridors |
Percent arrival on green |
| Optimize travel time reliability on major freight corridors |
Percent of time freight operators experience free flow travel time {TTRI) |
| Monitoring Measures |
Maximize Equipment and communications reliability |
Percent asset uptime |
| Communications network up time |
| Percent asset beyond service life |
| Respond to and clear heavy vehicle incidents as quickly as possible |
Response < 45 minutes; Clearance < 90 minutes |
| Expand TMC surveillance and management capabilities |
Percent of congested corridors (based on TTRI and LOS analysis) with fixed ITS |
| Number of mobile data collection devices (AVL/GPS, cameras, weather sensors) |
| Manage TMC staff workload |
Number of incidents logged |
| Provide timely, accurate, and comprehensive information to customers |
Increase OHGO impact - average number of notifications opened per incident |
| OHGO usage - number of personalized routes created |
| Incident verification (incident occurrence to time public is notified) |
| Hold after action review (AAR) meetings for 100% of incidents that exceed clearance goals |
Percentage of meetings that occur within 30 days |
| Monitor key transportation assets/events to prevent harmful acts |
Number of assets/events monitored |
| Promote TSMO tools to improve Emergency Management |
Number of agencies with CCTV and ODOT Data Access |
Figure 23. Ohio DOT TSMO Performance Measures. Source: Ohio DOT, 2017.
Virginia DOT developed the SmartScale process for scoring and selecting transportation projects based on six factors (safety, congestion mitigation, accessibility, environmental quality, economic development, and land use), many of which are measured using data from ITS and related data (e.g., person-hours of delay and travel time reliability). The metrics an agency or a program chooses must promote the performance it wants. Usually, it can achieve this only by incorporating several metrics into a balanced scorecard, similar to the Ohio and Virginia examples.
Selecting the right metrics and targets is both science and art. Metrics at one level may have no logical link to those further up the cascade. Agencies must think both top-down and bottom-up in selecting and setting metrics. Once metrics are defined, agencies must recognize the level of influence they exert on the metric compared to external factors (e.g., weather or demand changes) and set targets that are attainable, but with a healthy element of stretch required.
For an agency’s ITS programs, common objectives include improving road safety, energy use, trip reliability, travel time, multimodal efficiency, and cost-effectiveness of road systems operations. Specific operations programs (e.g., work zone, traffic incident, road weather, traffic signal, transit, freight, and integrated corridor management) contribute to agency objectives. Data generated by ITS and related systems are used to monitor the real-time performance of programs, support real-time decision making, and support planning for operations (e.g., efficient maintenance and expansion strategy for ITS sensors). The use of data to improve decisions is categorized across three areas - automating current activities, using new information to improve current decision making, and restructuring the process of decision making for greater efficiencies and outcomes.
Data, technology, and services available to ITS programs aid in all three of the areas described in Figure 24. Examples across these areas are included in Section 5, Examples of Data-Informed Decision Making.

Figure 24. Use of Analytics to Transform Manual Paper-Heavy Processes to Automated Restructured Processes to Improve Decision Making. Source: Shah, 2019.
In summary, A performance management approach creates the path for improvement. A performance management approach enables funding requests and prioritizing investments based on specific performance needs, using data to measure the current state and progress towards the goal. A performance management approach can demonstrate to staff how their work contributes to attaining agency goals and objectives. Performance management supports transparency, sharing of value generated from investments, and fulfilling federal and state requirements.
3.2 Traditional, Real-time, and Advanced Analytics
No single tool, or software, can meet the broad range of decision support needs within an agency. Some provide complex ad-hoc analytics and other advanced capabilities, while others may offer greater real-time geospatial visualization. There are many considerations that affect an agency’s decision to build or buy analytics capabilities to support decision making.
A key shift in analytics is computing on the edge. This is when the processing of the data occurs at the location of the device, with only processed relevant performance measures transmitted via a communications technology, and typically with the raw data discarded. For example, ParkMaster developed an in-vehicle, edge-based video analytics service to detect open parking spaces using the Android smartphone platform. The smartphone app uses the camera, GPS, and inertial sensors to count parked cars through the camera frame view and upload only the count and location data. Computing on the edge is a useful strategy to ensure privacy and limit the bandwidth needed to transmit data from a device to a central system.
This section comprises key content of the forthcoming NCHRP 03-128 Report and NCHRP Report 904. The first subsection describes traditional analytics, while the subsequent six sections each describe analyses that complement traditional statistics expanding their reach to Big Data and streaming data. Big Data analytics rely on a more brute force way to analyze data than traditional statistics, using approximate or distributed variations of traditional statistical algorithms. Within each section are common tools for conducting analytics and example transportation uses.
3.2.1 Traditional Analytics
Data from ITS systems and broader transportation data have been used for nearly three decades to support decision making. These analytics focused on the exploration of numerical data, for inferring characteristics of a population from those in a representative sample. It can be divided into the following three categories:
- Descriptive statistics, also called summary statistics, attempt to quantitatively describe the features of data collection. A measure of central tendency (Mean, Median, Mode), frequency distribution plots, quartiles, and correlations are examples of descriptive statistics. Most real-time dashboards and reports focus on descriptive statistics.
- Inferential statistics, also called inductive statistics, attempt to deduce properties of the population based on data distribution present in a sample. Common inferential statistics methods include analysis of variance (ANOVA), linear regression, moving averages, and neural networks. Inferential statistics seek to understand causation and serve as a basis for investment decision making.
- Exploratory data analysis is an approach to analyzing datasets to characterize and summarize them using various types of analyses, often visual ones. This type of analysis is very common today in the field of data science, where analysts explore “what the data tells us” without necessarily understanding why or testing specific hypotheses.
Traditional analytics are the mainstay of transportation agencies, generating weekly, monthly, and annual reports on trends in major performance measures. The data to support these analyses are housed in spreadsheets (e.g., Excel) and relational databases. Some reporting is automated, while other analyses are conducted manually, as needed. Much of the planning for operations and broader strategic decision making is supported using traditional analytics.
3.2.2 Real-Time Analytics
- The ATMS that are the core of traffic operations centers data had been developed using traditional relational databases, which are costly to evolve for real-time analyses because of the inherent need for high availability and low processing times for real-time information. The storage and computing capabilities available using cloud infrastructure can support very complex real-time data analysis over very large datasets with millisecond, even microsecond, updates. Modern analytics platforms such as Apache Kafka, Apache Storm, AWS Kinesis, Google Cloud Dataflow, and Microsoft Azure Stream Analytics all offer cloud-based real-time analysis solutions that can do the following:
- Perform time-series analyses in real-time, such as volume and speed differentials
- Create metrics and triggers for use in real-time monitoring, notifications, and alarms
- Chain and branch real-time analyses, generating multiple real-time analytics feeds from a single source of real-time data
- Combine real-time data feeds to augment data, detect correlation and divergence
- Feed the results of real-time data analysis to real-time dashboards
- Perform machine learning analysis offline using archived data streams
- Train machine learning algorithms in real-time using a streamed data feed
The INRIX Dangerous Slowdown service, and similar queue detection functions for large road networks with tens of thousands of links developed in-house by some state DOTs, require this type of real-time analysis. The Kentucky Transportation Cabinet applies real-time analyses to send email notifications when the combination of a Waze event and HERE link speed decrease occur using Apache Kafka for processing their Big Data (see Section 5.3).
Real-time analysis for Big Data (vehicle probe, Waze, connected vehicles) uses a combination of unsupervised, supervised, and reinforced learning to identify groupings and alert functions. Some transportation agencies have used data integrators such as Waycare or Genesis Pulse that use a modern cloud-based system to support real-time information. Others build from existing systems or develop interfaces that support real-time analytics.
3.2.3 Classification/Cluster Analyses
Cluster analysis is a data mining task that consists of grouping a set of records in such a way that objects in the same group are more like each other than to those in other groups. It is a common technique used in many fields, including machine learning, pattern recognition, and image analysis. Many different methods serve to identify data clusters (e.g., partitioning, hierarchical, fuzzy, density-based, and model-based clustering). Most software support multiple clustering methods; some common examples include Apache Mahout, Apache Spark, R, and Revolution R Enterprise.
One of the most popular clustering algorithms using a partitioning method is called K-means. The K-means clustering algorithm aims to partition a limited number of data points into a specified number of clusters in which each observation belongs to the cluster with the nearest mean. Cluster analysis has been used for decades in transportation, for example, to identify seasonality in traffic patterns, or identify groups of traveler types for planning purposes. Cluster analysis has been used in the Big Data context to effectively process Bluetooth data collected by the Oregon DOT to approximate counts and speeds for vehicle, bicyclist, and pedestrian travel.
3.2.4 Graph Analysis
Graph analysis consists of methods that structure data as a graph of connected nodes to better analyze the connections between these nodes. Graph analysis often reaches approximate solutions rather than exact ones due to computational requirements and data complexity/size. Apache Spark GraphX, Titan, Neo4j, and Microsoft Azure Cosmos DB are software supporting graph analyses. The following are four types of graph analysis suited for transportation applications:
- Path analysis is used to determine the shortest distance between two nodes
- Connectivity analysis is used to determine weaknesses in networks. This is well suited for transit multimodal connectivity
- Community analysis finds groups of interacting people in a social network, for example, to identify whether they are transient and predict if the network will grow
- Centrality analysis is used to identify nodes or edges that are the most connected to the rest of the graph. This can help identify key individuals that may serve as facilitators or roadblocks for public outreach or an agency policy rollout
Google Maps and Waze use graph analysis to recommend the shortest route. Graph analysis is often combined with text mining. The text mining extracts words and infers topics from written documents which are then organized into a graph to be searched. Graph analysis is also commonly used in fraud detection.
3.2.5 Text Analytics
Text mining, or analytics, is the process of analyzing human-readable text, structured in three steps: the conversion of written text into word vectors, the filtering of word vectors to remove very common words or not needed words such as articles, and the statistical analyses of the filtered word vectors to detect presence and sequence of words. Text mining is frequently applied for categorization, clustering, taxonomies, sentiment analysis (e.g., emotion or beliefs), entity extraction (e.g., phone numbers or names), or entity relation modeling. Examples of software for text mining include NLTK, GATE, Apache Spark Machine Learning Library (MLlib), and Microsoft Azure Cognitive Services text analytics API.95
The FHWA EDC-4 program, Using Data to Improve TIM, analyzed the California Highway Patrol CAD records, which included text transcriptions of officers’ radio calls. In each message, officers describe when they were dispatched, arrived, and departed, as well as the nature and status of the incident using their own lingo and specialized codes. Ten years of text records were analyzed to identify roadway incidents, first awareness time, response arrival time, lane clearance time, and the time at which the last responder departed using text mining. Caltrans was able to uncover 2.7 million incidents and calculate TIM performance measures for 1.4 million incidents.
3.2.6 Video and Image Analytics
- Video and image processing are similar to text mining in that it is taking one type of data that is difficult to analyze in its raw form, in this case, one or more images, and processes it to be machine analyzable. Neural network-based image and video analysis is now moving beyond the simple detection of entities inside an image toward the actual decomposition or segmentation of an image to identify, locate, and track all entities present in the image in real-time, as shown Figure 25. For transportation purposes, this could mean counting the number of unique vehicles on a roadway, collecting demographic information about passengers on a bus, detecting with far greater fidelity incidents from CCTV, and more. Some image and video analysis software include OpenCV, AWS Rekognition, Google Cloud Vision, and IBM Watson Visual Recognition. To note, image recognition can be biased based on the data used for training. For example, facial recognition software has frequently been cited as having bias, and as of June 2020, Amazon announced a one-year pause in law enforcement use of its Rekognition software.
Transportation agencies typically rely on technology vendors to support this video and image analytics capability to detect empty spaces in parking lots, to detect modal mixes at intersections, and for freeway operations, detecting a host of incidents (e.g., stopped vehicles in traffic, wrong-way driving, traffic slow down, a pedestrian on the road, or debris on the road). A number of vendors offer these capabilities, and the use of deep learning technologies is improving both rates of detection and reducing false alarms.
3.2.7 Prediction, AI, Neural Networks, and Deep Learning
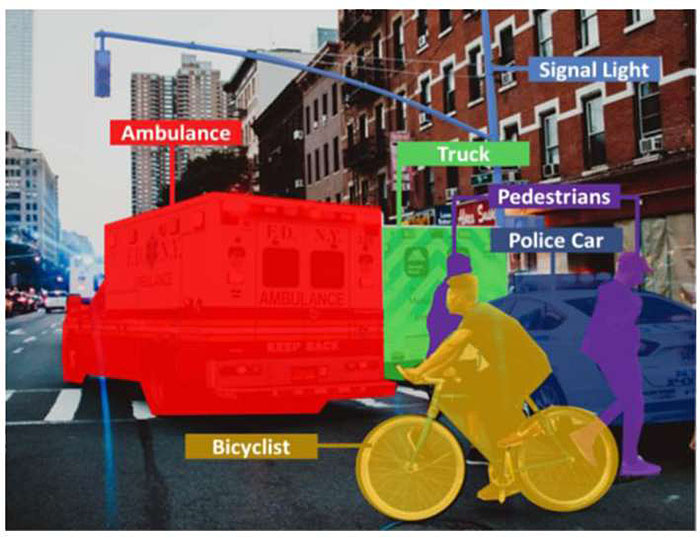
Figure 25. Illustration of Image Decomposition and Detection.
Source: Vaishali Shart.
Regression models are the backbone of predictive analytics. Regression models are used to predict the duration of an incident or the likely growth in traffic. Regression models can be used to predict the volume of materials to spread during snow and ice events. Regression is used in both traditional and Big Data analyses. The goal of regression analysis is to fit a specific type of mathematical equation, or model, to represent the interactions found in the observed data. Many different types of equations can be used to perform regression analysis from linear regression models, which attempt to fit data to a simple linear equation to more complex ones such as random forest algorithm, which creates and combines thousands of different decision trees derived from the data.
- Among transportation professionals, the terms machine learning, deep learning, AI, and even predictive analytics are used interchangeably and often imprecisely. For instance, analysis techniques introduced in Sections 3.2.1 through 3.2.6 (real-time analyses, cluster/classification, graph, text mining, and video analysis) can be applied at scale for prediction using deep learning. There are differences in these terms, and Figure 26 illustrates the relationship among commonly used terms.
- While AI is the use of computer science to mimic human abilities, machine learning is a specific subset of AI that trains a machine how to learn. Machine learning is a traditional branch for classification and predictive analysis. Early models were started in the late 1940s and kept evolving until the early 2000s. Some machine learning method classes include Bayesian, backpropagation, support vector machines (SVMs), recurrent neural networks (RNNs), and support vector clustering. These methods were often very complex and less effective than simple regression models, given the size of data and computational access. Machine learning automates analytical model-building through unsupervised, supervised, reinforcement, or hybrid strategies, each described below:
- Unsupervised Learning lets the computer recognize patterns on its own with minimum or no human supervision. The machine applies clustering and other association methods to the data to discover patterns without analyst supervision.
- Supervised Learning algorithms require examples they could learn from. This process is called training and may require thousands, tens of thousands, or even more examples created by humans to recognize the rule. Typically, a subset of the examples is used to train the algorithm, and the remainder is applied to test the model. For example, individuals can label pictures as having fire engines or not, and the algorithm would use a subset of the labeled pictures to then estimate whether a second set contains fire engines. The user assesses how accurately the algorithm got the estimate. Supervised learning models typically use regression and/or classification strategies.
- Reinforcement Learning enables automated algorithm selection to react to an environment. These algorithms target a solution to a problem. A simple example of reinforced learning may be a self-navigating vacuum cleaner that learns the terrain based on iterative scans of the floor space. This is a trial-and-error method for learning.
- Hybrid strategies include semi-supervised and self-supervised learning. Semi-supervised learning is supervised learning where the training data contains very few labeled examples and a large number of unlabeled examples. Self-supervised learning refers to an unsupervised learning problem that is framed as a supervised learning problem in order to apply supervised learning algorithms to solve it.
Deep learning, a neural network machine learning method, emerged in the 2010 decade to leverage Big Data and low-cost cloud computing capability. Most deep learning models are black-box applications based on the vendor tool, yet they hold tremendous potential in transportation from anomaly detection to carpool/ride-sharing, from transit data-driven operations to vehicle safety monitoring.
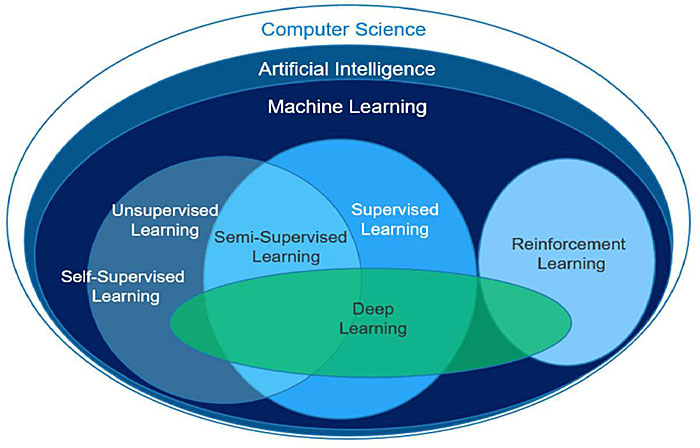
Figure 26. Venn Diagram of Common Computational Strategies. Source: Mysla, 2020.
3.3 Understanding Your Data
Data quality is a measure of the degree to which data meets the purpose of intended use by systems, processes, and people. IBM estimated in 2016 that poor data quality cost the US industry $3.1 Trillion. There are many data quality dimension frameworks available. The Data Management Association (DAMA), a nonprofit and vendor-independent association dedicated to the advancement of data resource management, provides six core data quality dimensions include the following:
- Accuracy - Does the data correctly describe the real-world event being described? Particularly when sampling from the real world, does the sample reflect the real world?
- Consistency - Does the data across systems reflect the same information, in sync with each other? Is there conflicting information?
- Completeness - Are all data items recorded, are there missing records? Data completeness shortcomings may stem from offline sensors or from individuals not entering data.
- Uniqueness - Are the number of data generators or records unique? For example, if there are 30 sensors on a road segment, are there 30 data streams that are unique from each other, or might there be one sensor reporting twice?
- Timeliness - Does the time stamp on the data reflect the reality of when the data are recorded, or are there non-standard lags in data? For example, is the reporting of one sensor significantly delayed, or are the clock times offset? More commonly, have time zones differences been accounted for in data archives?
- Validity - Do data conform with the expected syntax (format, type, range)? Are there traffic volumes that are inconsistent with a road segment capacity, or does a travel time suggest unrealistic speed?
When organizations collect, process, and aggregate data to deliver reports, dashboard statistics, and decision support without first exploring the data, the resultant information can mislead decision making. As far back as ITS data has been collected, agencies focused on data quality. A 2002 report, “Defining and Measuring Traffic Data Quality,” recommends that “if data quality is measured, a data quality report be included in metadata that is made available with the actual dataset.” “The ASTM E2468-05 Standard Practice for Metadata to Support Archived Data Management Systems,” published in 2006, provided guidance on the quality checks and statistics but did not address real-time quality. Agencies must remain vigilant across every facet of data quality.
As agencies move towards simplified, real-time dashboards, key data quality information is often omitted. This may lead to unwarranted decision-making confidence or lead to actions that may otherwise not be pursued. For example, an agency that monitored average roadway clearance times reported by law enforcement through the state’s crash report were surprised to find significant rounding in the data by officers wherein a bell curve distribution of the disaggregate data looked more like a porcupine distribution with spikes at the 15, 30, and 60-minute marks. This data entry approximation meant that the average roadway clearance times were inconsistent with the real world and would likely not reflect improved operations. To improve data-informed operations, the agency needed to train officers to better collect relevant data. Another agency found their data collection of roadway and incident clearance times often inconsistent due to the aggregation of data with significant missing data fields. They needed to use a subset of data for comparing roadway and incident clearance times.
Real-time, link-based average travel speed data from a vehicle probe provider is typically sufficient to approximate DMS travel time but may likely be insufficient for use when assessing roadway speed limits. Other examples associated with understanding the nature of the data were shared in Section 2.3.1 for vehicle probe data, as well as in Section 2.3.2 for mobile applications data.
ITS systems now can compare information from multiple sources to explore accuracy (e.g., vehicle probe, ITS sensor, and mobile navigation app data). Agencies should also recognize that many third-party data providers’ processes are a ‘black box,’ and that there may be data circularity. For example, the vehicle probe vendor may be pulling ITS infrastructure data from the transportation agency to supplement road segments with limited vehicle probes.
The TPM framework (Figure 22) places data quality function within Component C, Data Management, because much of the work for data quality has resided ‘cleaning’ data prior to placement of data into databases and making them available to analysts. Yet, as agencies shift towards a ‘schema-last’ strategy for managing big data (discussed in Section 4.3), the data quality function should also reside within Component D, Data Usability and Analysis. Data quality should be a foundational consideration in the development of every analysis.
Return to top ↑
4. Data Management and Governance
Data management is the practice of collecting, keeping, and using data securely, efficiently, and cost-effectively. The goal of data management is to help people, organizations, and connected things optimize the use of data within the bounds of policy and regulation to advance and optimize goals. DAMA, the global non-profit association, dedicated to advance the practice of data management, identifies eleven knowledge areas illustrated in Figure 27. The Data Management Body of Knowledge, Second Edition (DMBOK2) describes in detail each of the eleven knowledge areas. Data governance may best be thought of as a function supporting an organization’s overarching data management strategy. Section 4.1 summarizes the evolving role of data governance - from centralized, strict IT-controlled policies to distributed governance shared between the central IT entity and specific lines of business. Section 4.2 introduces the modern concept of democratized data.
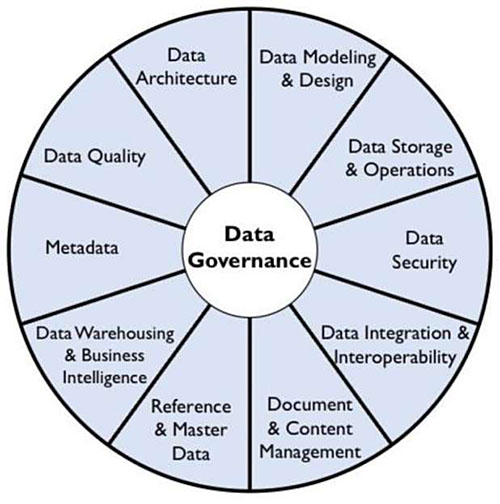
Figure 27. Eleven Data Management Knowledge Areas Defined within the DAMA-DMBOK2.
The 2020 published NCHRP Research Report 952 “Guidebook for Managing Data from Emerging Technologies for Transportation,” provides guidance, tools, and a big data management framework to help agencies shift towards effectively managing data from emerging technologies. Section 4.3 summarizes the key elements of data governance.
4.1 Data Governance
Data governance is the exercise of authority, control, and shared decision making over the management of data assets. While data governance has traditionally been closely associated with managing legal risk, regulatory compliance, and security, data governance needs to become a more flexible, multi-faceted concept that provides tools and processes (e.g., business glossary, semantic data models, data dictionaries, etc.) to foster data understanding throughout an organization, rather than dictate a strict and unique way to access controlled agency data. For that reason, data governance needs to broadly encompass the entire data supply chain rather than mandate data structures and data tools for business units. Data governance has become critical, not only because of the increasing amount of data, but also because of a democratization of data (see Section 3.2). According to the Data Governance Institute, eight principles are at the center of all successful data governance and stewardship programs:
- Integrity - Data Governance participants will practice integrity with their dealings with each other; they will be truthful and forthcoming when discussing drivers, constraints, options, and impacts for data-related decisions.
- Transparency - Data Governance and Stewardship processes will exhibit transparency; it should be clear to all participants and auditors how and when data-related decisions and controls were introduced into the processes.
- Auditability - Data-related decisions, processes, and controls subject to Data Governance will be auditable; they will be accompanied by documentation to support compliance-based and operational auditing requirements.
- Accountability - Data Governance will define accountabilities for cross-functional data-related decisions, processes, and controls.
- Stewardship - Data Governance will define accountabilities for stewardship activities that are the responsibilities of individual contributors, as well as accountabilities for groups of Data Stewards.
- Checks-and-Balances - Data Governance will define accountabilities in a manner that introduces checks-and-balances between business and technology teams as well as between those who create/collect information, those who manage it, those who use it, and those who introduce standards and compliance requirements.
- Standardization - Data Governance will introduce and support standardization of University data.
- Change Management - Data Governance will support proactive and reactive Change Management activities for reference data values and the structure/use of master data and metadata.
Data governance is more rapidly evolving for ITS groups compared to other business units. Some agencies’ operations and ITS groups find themselves requiring greater autonomy in data governance. For example, most connected vehicle pilot projects funded through the USDOT followed well-defined data management practices. They did so, however, within the project and often through outsourced contractor support housed in its own data governance bubble. The state or local agency did not merge or change their data governance or management practices to incorporate the new real-time data. Instead, the broader agency followed the traditional systems engineering and IT management approach, waiting for the conclusion of the pilot before data integration. Agencies are beginning to exercise ‘modern’ data governance at the project or program level, but not at the agency level. NCHRP Research Report 952 proposes a capability maturity self-assessment for the perspective of modern data governance, and excerpted below is the report table.
| Question |
Scoring |
| Low |
Moderate |
High |
| Does the agency have full ownership of and unrestricted access to the data that they obtain from third parties? |
In most cases, the third party owns the data and severely restricts access and use. |
In some cases, the agency owns the data from the third party but must comply with rigid use restrictions. |
In most cases, the agency owns the third-party data and may fully use it with few restrictions. |
| Is the agency limited by high costs in accessing and using data relevant to their needs? |
Very high cast to use data. |
High cost to use data. |
Reasonable cost to use data. |
| Are users restricted to using only certain tools when analyzing data of interest? |
Users are restricted to a small number of proprietary analysis tools. |
Users can use a range of tools (with some restrictions), mostly proprietary but some open source, to analyze the data. |
Users can use any number of tools to analyze the data and with few restrictions. |
| Is access, use, or analysis of data limited by agency data management policies and practices? |
Agency data management policies and practices severely limit access, use, or analysis of data. |
Agency data management policies and practices somewhat limit access, use, dt analysis of data. |
Agency data management policies and practices do not limit access, use, or analysis of data. |
| Is data management software used by the agency? |
No data management software is used. |
Data management software is used, but it is not optimal. |
Optimal data management software is used. |
| Does the agency follow a documented data management plan? |
The agency has no documented data management plan. |
The agency follows a loose, largely undocumented data management plan. |
The agency follows a documented and frequently updated data management plan. |
| Does the agency have in-house data management experts or does the agency outsource data system management to one or more third parties? |
The agency relies on outside parties for data management. |
Some data systems are outsourced while others are managed in-house. |
The agency conducts all data system management in-house. |
| Does the agency actively monitor their data management systems? |
There is no active system monitoring. |
Some system activity dashboards are available. |
The agency employs both reactive and proactive monitoring of their data management system. |
Figure 28. Data Governance Capability Maturity Self-Assessment from NCHRP 952 - Guidebook for Managing Data from Emerging Technologies for Transportation.
4.2 Democratization of Data
The democratization of data is the process of making data accessible enterprise-wide to end-users. This democratization enables individuals within and potentially outside the agency to access data as and when needed, rather than waiting for specialists to create reports or dashboards for the end-user. Moreover, the democratization of data with complementing self-service analytics enables individuals within an organization to develop and customize reports and dashboards based on their specific needs. Some public-facing examples of democratization of data and analytics include the following:
- The Utah DOT ATSPM site (https://udottraffic.utah.gov/ATSPM). This site is quite useful for traffic signal researchers and engineers to conduct analyses. The data may not be useful for the general public’s needs but is still made available to promote transparency in performance.
- The Bureau of Transportation Statistics (https://www.bts.gov/information-gallery) provides a range of statistical products and data related to transportation assets, passenger travel, performance and operations, safety, infrastructure, freight, energy and environment, and more.
- TITAN (https://www.modot.org/sites/default/files/documents/cmr19-006.pdf) provides access to interactive mobility, safety, and transit dashboards; data downloads of crash, detector, and probe data; and predictive analytics related to crash risk.
Data democratization empowers individuals at any level of an organization to use data to improve their decision making. It creates opportunities for new insights by allowing people with different expertise to explore the data. It opens employees’ data-literacy related knowledge and desire to use data to guide decisions. Yet there are risks with democratization, most significantly the potential to incorrectly use or misinterpret data, consequently making poor decisions. There is also a risk of losing the single authoritative source of data-related truths as each group may process and analyze data differently. These risks can be mitigated through effective data governance and management.
For ITS professionals, data democratization means providing access to the wealth of data as well as information on the quality and usability of the data within the organization. It means supporting the integration of data from multiple sources to support real-time dashboards and decision-support tools for TMC operators and traffic engineers. It also requires managing the proprietary nature of certain data and the privacy requirements of data. For these reasons, data management and governance are paramount for transportation operations and ITS groups.
4.3 Modern Data Management
Traditional data management was developed to support consistent, routine reporting functions using relational database systems, through fully define requirements. The requirements include understanding what data will be used; how this data will be cleaned, filtered, and organized; and potentially even what analysis will be performed on the organized data, by whom, and how often. This specification for processing data for storage is referred to as schema-first.
In schema-first data systems, data cannot be stored until the schema tables are defined, and databases are created using the defined schema. The advantage of this traditional system is fast, consistent, and determinant data. As data sources become more varied, change more rapidly, and grow in volume, the schema-first philosophy cannot cope. This data storage strategy cannot be re-designed quickly enough to handle frequent data and business requirements changes. It may impose aggregation or cleaning that precludes opportunities for unforeseen future analytics.
NCHRP Report 952 explains that modern data management circumvents the limitation of the traditional data management architecture by flipping it on its head and taking a ‘schema-last’ approach. Data are stored as they arrive without any changes or transformations. Then different units may apply data modeling and analytics for their intended use. By doing so, the schema-last approach dissociates data storage, analysis, and management to better allow for rapid changes. Yet, there is a cost with the schema-last approach. In the absence of good data governance, the schema-last approach can result in incorrect data interpretation and use, and the loss of a single authoritative data source. This tradeoff is highlighted under “database schema,” and “data” in Figure 29, excerpted from NCHRP Report 952. This table also summarizes the difference between traditional and modern data management across the different elements of data management.
|
Characteristics |
Traditional Data System/ Management |
|
Modern Big Data System/ Management |
| 1 |
System Design |
Systems are designed and built for a pre-defined purpose; all requirements must be pre-determined before development and deployment. |
versus |
Systems are designed and built for many and unexpected purposes; constant adjustments are made to the system following deployment. |
| 2 |
System Flexibility |
System designed as “set it and forget it”; designed once to be maintained as is for many years. Systems are rigid and not easily modified. |
versus |
System is ephemeral and flexible; designed to expect and easily adapt to changes. Detects changes and adjusts automatically. |
| 3 |
Hardware/Software Features |
System features at the hardware level, hardware and software tightly coupled. |
versus |
System features at the software level; hardware and software decoupled. |
| 4 |
Hardware Longevity |
As technology evolves, hardware becomes outdated quickly; system cannot keep pace. |
versus |
As technology evolves, hardware is disposable; system changes to keep pace. |
| 5 |
Database Schema |
Schema on write (“schema first”). |
versus |
Schema on read (“schema last”). |
| 6 |
Storage and Processing |
Data and analyses are centralized (servers). |
versus |
Data and analyses are distributed (cloud). |
| 7 |
Analytical Focus |
80% of resources spent on data design and maintenance; 20% of resources spent on data analysis. |
versus |
20% of resources spent on data design and maintenance; 80% of resources spent on data analysis. |
| 8 |
Resource Efficiency |
Majority of dollars are spent on hardware and software {requires a lot of maintenance). |
versus |
Majority of dollars are spent on data and analyses (requires less maintenance). |
| 9 |
Data Governance |
Data governance is centralized; IT strictly controls who sees/analyzes data {heavy in policy setting). |
versus |
Data governance is distributed between a central entity and business areas; data are open to many users. |
| 10 |
Data |
Uses a tight data model and strict access rules aimed at preserving the processed data and avoiding its corruption and deletion. |
versus |
Consider processed data as disposable and easy to recreate from the raw data. Focus instead is on preserving unaltered raw data. |
| 11 |
Data Access and Use |
Small number of people with access to data; limits use of data for insights and decision-making to a “chosen few.” |
versus |
Many people can access the data; applies the concept of “many eyes” to allow insights and decision-making at all levels of an organization. |
Figure 29. Differences between Traditional and Modern Data Management from NCHRP 952 - “Guidebook for Managing Data from Emerging Technologies for Transportation.”
4.4 Proactive Analytics for Data Management
Tools are now available that actively monitor incoming data and internal and external access and use of data. These tools can help detect anomalies related to security and data quality. These tools can also help tailor services based on user behaviors. The specific vendor product will vary based on the data systems. For example, the product Unravel can help detect Apache Spark issues (e.g., failure, inconsistent performance, drop-in input records, suspect time intervals, etc.). Following are examples of proactive analytics capabilities and how they may be used by transportation agencies, summarized from a forthcoming report from NCHRP 03-128, “Business Intelligence Techniques for Transportation Agency Decision Making.”
- Tailoring data services - By analyzing patterns of data access, agencies can identify the most common user types and tailor their offerings to meet that user’s needs. For example, if it is found that 90 percent of users download reports in pdf format, then emphasis can be placed on making all new reports available as pdf files to support that preference.
- Automated monitoring of incoming data - Loop detector data systems already screen information that is clearly erroneous before pushing it within the ATMS system. With larger data volumes and velocities being imported into a data lake environment from multiple sources, similar checks should be performed. If the data falls within normal parameters, it is loaded without incident. If the data differs significantly from expectations, then it is flagged for human review to see if it is a legitimate outlier or if there is a data quality issue that must be addressed. This flagging process is preferable to automatically deleting suspect data because it reduces the risk of discarding good data and provides valuable diagnostic information when troubleshooting persistent data quality issues.
- Security - Data security is improved via anomaly detection processes. Securing administrative access to the database is the first line of defense against unauthorized or malicious use. By proactively analyzing administrative user activity, preventative action can be taken when suspicious commands are issued. For example, if an administrator that only logs in during weekday business hours suddenly accesses the system in the middle of the night and enters commands to destroy data, an anomaly detection process can detect that aberrant behavior and prevent the deletion commands until another administrator can investigate the situation and confirm those commands are valid.
While the central IT group leads proactive data management analytics, with greater decentralization of data management, the transportation operations, and ITS group will need to learn and apply strategies to better monitor incoming data and access to data.
Return to top ↑
5. Data-Informed Decision-Making Examples
Data can and should inform decisions at every level of an organization. The previous three sections introduced the sources of ITS and related data, the context for and types of analytics to inform decisions, and the management and governance needed for the democratization of data. This section provides examples of data-information decision making that evolves processes that are instinct- and intuition-driven to those that apply insights from data through reports, dashboards, decision support, and artificial intelligence. Figure 30 illustrates this advance in decision making and the types of data products associated with quicker, simpler, efficient, and potentially optimized decisions.
The forthcoming NCHRP 03-128 report identifies the following four levels of decision making:
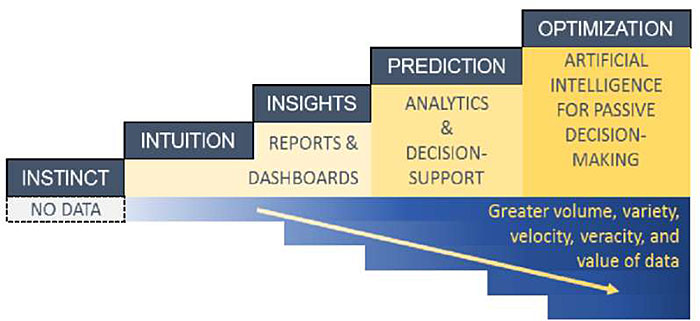
Figure 30. Evolving Decision Making. Source: Shah, 2019.
- Enterprise -Enterprise-level decisions affect agency-wide focus, processes, and infrastructure. Examples of enterprise-level decisions include the allocation of resources across business lines, setting strategic priorities, investments in new enterprise data systems or governance, and adjusting the agency’s budget. An enterprise example that integrates ITS and asset management is shared in Section 4.1.
- Program - Program-level decisions can refer to a broader Office of Operations or the Office of Maintenance and Operations, to specific groups such as traffic safety or traffic signals, or to specific operations efforts such as road weather management or traffic incident management. Program-level decision making examples are provided in Section 4.2.
- Project - The decision-making process can drill down even deeper to individual projects. For example, there is a range of decisions that can be made as part of a new roadway build, signal timing, or VSL implementation or process update. These decisions may entail both short-term and long-term considerations. Project-level data is available through decision support systems such as interfaces that pull data from ATMS systems. Project-level decision making examples are provided in Section 4.2.
- Front line - These decisions occur at the micro-level of day-to-day operations, typically by front-line operators. These decisions are often reactive and deal with topics such as when to send out winter maintenance crews and what rates of application to choose, how to respond to an incident, including associated traveler information, etc. Most decision support systems target front-line decisions within the operations/ITS realm. Front-line decision-making examples are provided in Section 4.3.
5.1 Enterprise Decision Making Example
Enterprise decision making balances information available through data analytics with external political influences and internal strategic goals and priorities. By codifying and making transparent enterprise-level decisions using data, organizations can buffer political or other external influences that may be less aligned with the mission of the organization. Data is particularly impactful at the enterprise-level, where relevant metrics and tools can be used for long-term strategic planning and course corrections. Data supporting enterprise decisions come in the form of reports and high-level performance dashboards based on well-curated and processed data typically involving lifecycle benefit-cost analyses. The decisions based on data may occur annually or over multiple years. The impact of decisions may be measured within months and across multiple years.
The redesign of the Ohio DOT asset management process is one example of how ITS data improved enterprise decision making. Through changes outlined in the Ohio DOT 2017 Transportation Asset Management Plan (TAMP), the agency expects to save $400M over six years by evolving business processes and technologies to (1) consider life cycle costs, (2) emphasize the use of cost-effective preservation treatments, and (3) implement more collaborative and consistent procedures. Each of these three undertakings is enabled through analytics.
The Ohio DOT “Transportation Information Mapping System (TIMS) helps planners, engineers, and executives access and manage key asset, safety, and operational data in a web-based integrated map-based format.” TIMS is available to the enterprise and the public. The tool also enables condition, performance, investment, and planning reports. Through their Collector Program, Ohio DOT eliminated data silos, integrated data from culverts, underdrains, signs, right of way, barriers, and outfalls, and is integrating ITS/signals, retaining walls, tower lighting, and inspection data (Figure 31) using mobile data collection.
As of 2018, Ohio DOT employed multiple data warehouse systems (SQL, Oracle, and GQL) and has moved towards an enterprise data warehouse system with some cloud-based storage and computing. This shift is illustrated in Figure 32 and evolved from a data governance maturity assessment. The assessment recommendations were organized across a 5-year timeline into three phases that focus on (1) a new agency-wide approach to data governance, (2) a new data governance framework, and (3) a new data governance plan. The first phase included hiring a Chief Data Officer, establishing a data governance framework and policy, and creating a Data Governance Group. These efforts quickly helped staff realize a change was needed to remain relevant, do meaningful work, and spread institutional knowledge.
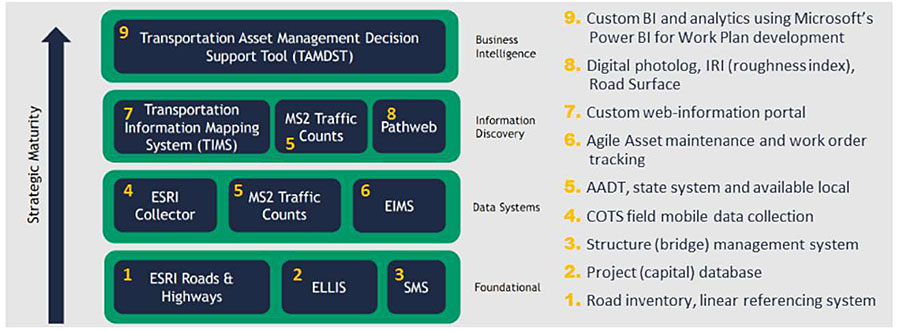
Figure 31. Ohio DOT Technology Portfolio (adapted from Williams, 2017.)
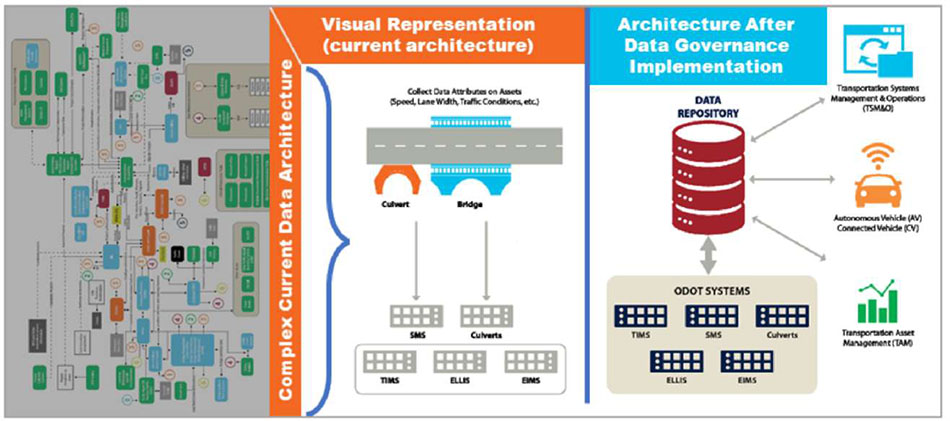
Figure 32. Planned Data Architecture Transformation (adapted from Williams, 2017).
The outcome from the efforts across people, processes, and technologies, as noted earlier, is a marked improvement in system performance. While annual funding levels are expected to decline from $1.5 billion in 2018, to $1.0 billion for 2020 onward, efficient asset management practices enabled through data analytics will increase statewide general pavement condition from 83 percent to above 85 percent, whereas the old investment strategy would have resulted in a decline below 75 percent by 2023. These outcomes reflect key inputs from ITS systems, including traffic volume and reliability data, as well as the inclusion of ITS infrastructure within asset management.
5.2 Program Decision Making Examples
Data analytics can support decisions made at the program level, including compliance with operating procedures and regulations as well as the strategic interplay across a portfolio of projects within a given agency program or division. Tradeoffs in ITS and broader operations investment, process, and policy are typically made at the program-level. These decisions also rely on reports, but may leverage self-service analytics (democratized data) where the decision maker will have access to some systems performance trend data. Following are program-level decision examples:
The Kentucky Transportation Cabinet (KYTC) Maintenance Group manages the state’s ITS infrastructure and data. Prompted by a growing AVL data set and the need for a real-time interface to view this data, the agency shifted to a modern data management system. The agency first developed an in-house cloud and, within two years, expanded the system to ingest and integrate data from HERE, Waze, work zones, and other sources in real-time. In 2021, KYTC began a shift towards the use of a vendor cloud service and, with it, a shift in data architecture. Figure 33 illustrates the current cloud architecture (top) as well as the previous in-house cloud architecture (bottom).
During the time of this data integration, the agency generated interfaces to visualize specific data types. They quickly recognized an opportunity to produce interfaces that could replace the agency’s legacy 511 system provided and managed through a vendor contract. KYTC in-house staff developed a replacement for the legacy 511 system in under 200 staff hours. The new system, GoKY, includes real-time crowdsourced information in addition to reports from KYTC’s TMCs. By aggregating, processing, and publishing information in a timely, accurate, and reliable manner, GoKY meets the requirements for Title 23, CFR 511.301-315 Real-Time Systems Management Information Program and achieved significant cost savings.
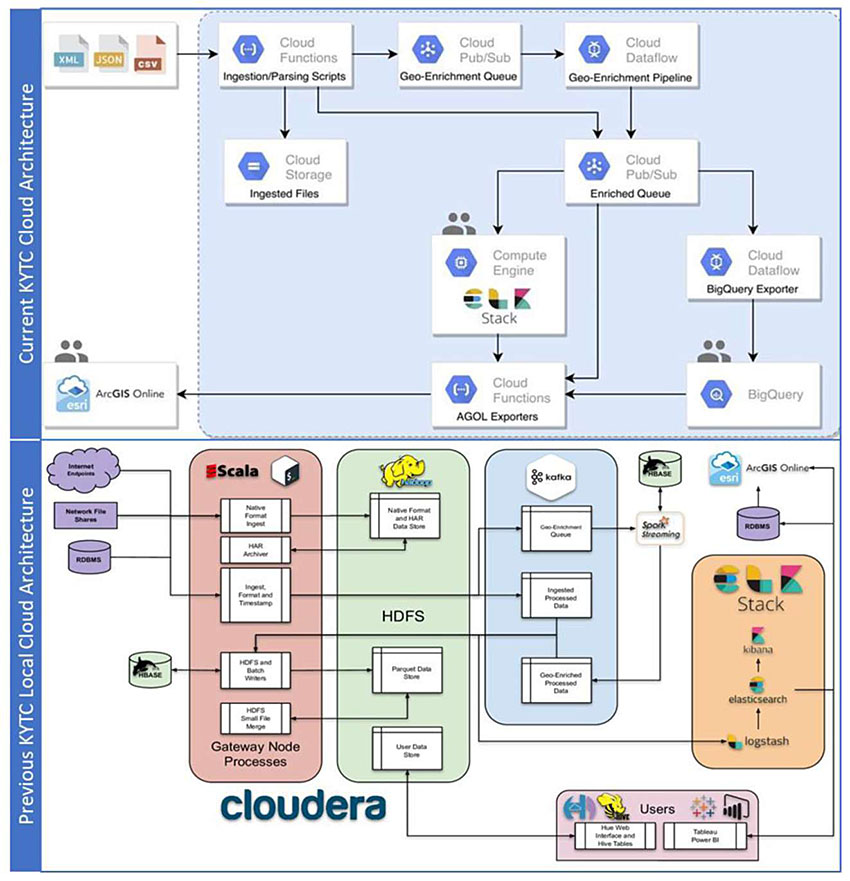
Figure 33. Kentucky Transportation Cabinet Data Architecture. Source: KYTC.114
Indiana DOT ITS Infrastructure Deployment and Capital Project Selection - The Indiana DOT collects speed data for 6659 Interstate segments and 34,829 non-interstate segments every minute from a vehicle probe data provider. Through collaboration with Purdue University, Indiana DOT developed a suite of real-time alert analytics and archived data-based descriptive statistics. The agency eliminated over 130 existing and 650 proposed roadside ITS infrastructure sites, instead choosing to use vehicle probe data. While Indiana DOT continues to maintain ITS sensor infrastructure at interchanges, they found the physical technology was not needed between interchanges, as demand does not change, and comparable traffic speed and travel time are available through vehicle probe data. The agency’s shift to vehicle probe data saved the agency $28M in infrastructure deployment cost and $750K per year in communications service and maintenance costs.
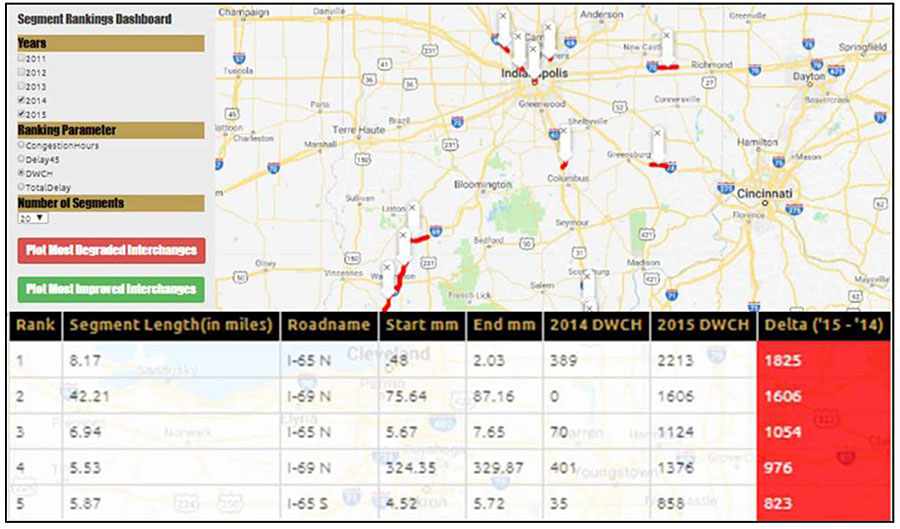
Figure 34. Indiana DOT Archived Data Analytics Support Capital Program Selection. Source: Indiana DOT.
Indiana DOT also uses the vehicle probe data to support capital program selection and assessment. The state computes distance-weighted congestion hours (DWCH) for each roadway and ranks segments based on changes in this performance measure, as illustrated in Figure 34. The agency also uses data for front-line decisions, further described in Section 4.3.
Oregon DOT Implementing VSL - The Oregon DOT used crash data to justify the implementation of a VSL program along Oregon State Route 217 due to large crash rates on the roadway (more than 230 crashes/year). Half of the crashes occurred in peak traffic hours, and rear-end collisions accounted for 70 percent of the crashes. The VSL algorithm accounts for both weather conditions and congestion levels in defining speed across seven segments along the corridor. The operational decisions associated with the setting of speed advisories in real time would, of course, fall within the frontline decisions.
Virginia DOT Invests in Operational Improvements for I-81 Corridor - The Virginia DOT applied road sensor and traffic operations data to inform their I-81 corridor improvement plan. The plan ties to the agency mission statement, which includes “enables easy movement of people and goods.”
The agency first used data to prioritize this critical north-south freight corridor with the highest per capita truck volume, over 11,000 crashes in 5 years, and highly unreliable travel times. Data also revealed that, for I-81, 51 percent of the delay was caused by incidents. Thus, rather than expand certain I-81 segments, the agency chose to implement a corridor-wide traffic incident management strategy that includes safety service patrol, incentivized towing, and CCTV cameras. The TIM strategy resulted in a “four-minute reduction in incident and emergency response times, a 7-minute reduction in incident clearance times, and a reduction of 100,000 vehicle hours of delay.”
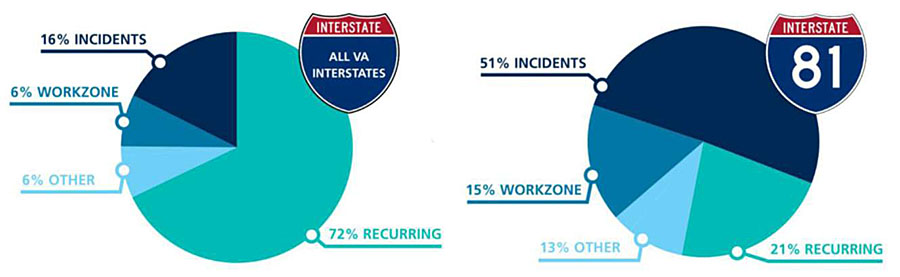
Figure 35. Delay Experienced on Virginia Interstates versus I-81. Source: Virginia DOT.
5.3 Project and Front-Line Decision Making Examples
Project and frontline improved decision making can save significant operator time and improve the quality and local impact of the decision made. ATMS systems and their improvements towards better user interface reflect one effective path towards improved decision making. MDSS also serves similar functions for road weather management. Following are a few examples of improved project and front-line decisions using data and analytics.
Pennsylvania Turnpike Commission (PTC) Incident Timeline Dashboard - The PTC integrates data from Waze, INRIX, and CAD in real-time. TMC operators use multiple dashboards, some with early warning detection that supports quicker incident response.
Operators and analysts also query archived data to better understand the incident response timeline and to use the tool for after-action reviews. Components of the archived analytics tool are excerpted in Figure 36. Not pictured, due to space constraints but a part of the dashboard, are fields such as first arrival, incident clearance, and traffic normal elements of the incident timeline, as well as a tabular view with details such as incident types and locations.
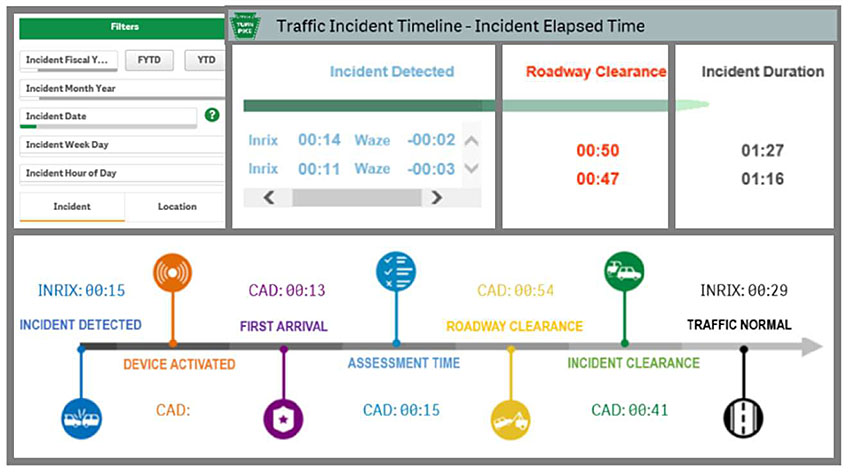
Figure 36. Excerpts from the Pennsylvania Turnpike Commission Traffic Incident Timeline Dashboard. Source: Pennsylvania Turnpike Commission.
Washington State DOT AVL System - The Washington State DOT’s AVL/GPS system for their snowplow fleet has significantly reduced claims of damage. With the AVL software’s ability to provide detailed temporal travel paths for WSDOT snowplows, the annual average payments made by WSDOT resulting from tort claims decreased from $2 million to $500,000 per year.
Port Authority of New York and New Jersey (PANYNJ) Work Zone Management - The PANYNJ pushes work zone information to Waze and other navigation platforms to ensure travelers do not attempt unsafe movements and to reduce traffic in areas of work zones. For example, when a new exit to LaGuardia Airport from the adjacent freeway opened, push notifications were sent to over 140,000 targeted Waze users. For another roadway change, a Waze “hazard” was added for drivers nearing the site. Users signaled their appreciation for this information, including more than 1,000 thumbs up.
KYTC Quicker Incident Detection - The KYTC system compares Waze event reports to HERE vehicle probe speed data along with the same point on the KYTC linear referencing system every two minutes. When certain speed and event reliability thresholds are met, the system delivers an email to TMC operators with integrated information detailing the district, facility, and mile point data, along with relevant Waze reports, weather profile, and vehicle probe speeds. The KYTC system-generated email, which also includes links to more detailed data, helps operators understand the nature of the event better, allowing them to better plan their response. Information is also made available in real-time to response agencies, such as Kentucky State Police and Kentucky Emergency Management, providing a single, shared view of incidents from which to make decisions during emergencies. TIM committees also have access to the systems’ analytics dashboards to facilitate after-action reviews and support training.
Indiana DOT Improves Work Zone Management -Indiana DOT uses vehicle probe data to support real-time situational awareness within their statewide TMC and with partners such as law enforcement. For example, off-duty law enforcement officers supporting work zones can monitor real-time queuing from their vehicle using the agency’s Delta Speed, tool as illustrated in Figure 37. The law enforcement officer can respond when they see unusual queueing. Indiana DOT generates weekly congestion heat maps and performance measures associated with work zones to inform closure planning. A few of the performance measures in the weekly report include hours where queue length exceeds 5 miles, the worst day of queuing, the mile-hours with speeds below 45 miles per hour (mph), numbers of property damage only (PDO) crashes, personal injury crashes, and back-of-queue crashes. Indiana DOT also uses the vehicle probe data for snow and ice management, posting travel time on message signs, and traffic signal timing decisions.
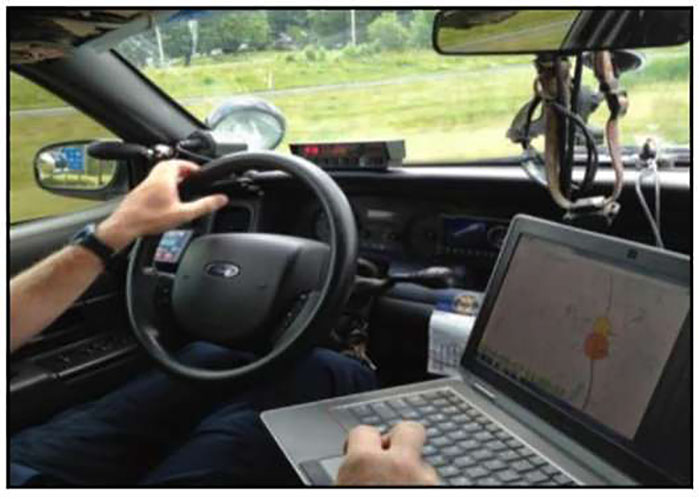
Figure 37. Law Enforcement Officer Parked at Active
Work Zone Monitors Queuing. Source: Indiana DOT.
Ohio Weather Responsive VSL - The Ohio DOT statewide TMC operators use a tool developed in-house to better operate their VSL in response to weather, incidents, and work zones. Illustrated in Figure 38, the state’s VSL now extends along I-90 and I-670. On I-90, the system posted changes in speed limits across nine eastbound and ten westbound digital speed-limit signs beginning the 2018-2019 snow and ice season. Operators monitor real-time speed data and follow processes to reduce speeds at 10 mph increments. The tool aligns the speed, RWIS, and road segment speed reduction strategy. The information enables operators to enact lower speeds in advance of winter weather-related queuing and slowdowns. Over two winter seasons, operator decisions contributed to a 22 percent reduction in total crashes, a 42 percent reduction in snow event crashes.
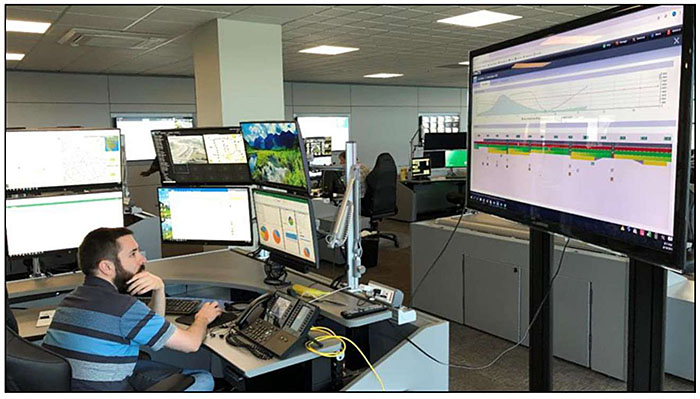
Figure 38. Ohio Statewide TMC Operator Uses Data to Inform Variable Speed Limit. Source: Ohio DOT.
Return to top ↑
6. Summary
State and local transportation agencies rely on data from ITS infrastructure to generate foundational data—speed, volume, and vehicle type—used to operate roadways, plan for roadway operations, and plan for broader infrastructure investments. Agencies have also expanded sources and types of data through vehicle probe, crowdsourced, connected vehicle, and IoE-based technologies. With this data expansion, comes the potential for greater precision, timeliness, and accuracy for the foundational data, newer types of data, as well as more qualitative and potentially non-authoritative data such as travelers-perceived incident type reported through a navigation app or a tweet.
Complementing the surge in data are more accessible techniques and tools for processing data, understanding the nature of the data, integrating data, making data available as and when needed. Transportation agencies should focus on their performance management plans to identify the relevant performance measures and the required data and data fidelity for each measure. And while there is the potential in the application of AI to improve transportation decision making, agencies can make marked improvements by continuing to focus on collecting quality data, integrating these data, and applying traditional and real-time analytics to advance from static systems management (e.g., time of day, day of week) to responsive systems management. Examples of shifting towards responsive operations are highlighted in this module’s introduction, and in Section 4.3.
How agencies manage data directly affects how data can be used. The democratization of data is the process of making data accessible enterprise-wide and to end-users potentially outside the agency, as and when needed rather than when a specialist creates a report or dashboard. The democratization of data supports greater data-informed decision making. Agencies must develop and practice modern data governance and management when shifting towards the democratization of data; otherwise, they may find themselves without authoritative data, without confidence in the data, and with unnecessary costs in supporting a murky data environment. Agencies that have begun harnessing the power of data are evolving to leverage modern data management strategies. More often, transportation agencies rely on universities, consultants, and vendors to manage data and develop tools to support decision making.
Many federal, AASHTO, NCHRP, and State-developed resources are available for more detailed information related to ITS and transportation systems management and operations as well as newer data, data analytics techniques, business intelligence, and data management and governance. Many of these resources are excerpted and summarized in this module. These resources are outlined in the call-out box in this section.
Though not addressed directly in this module, it is worthy to note that the pace of evolution towards data-informed decision making is somewhat dampened by the pace of workforce skills development. Agencies need to hire or train staff to understand core concepts of data management and governance, to understand big data and real-time analytics capabilities and limits, and to embrace cultural shifts towards data democratization. Staff need to be able to discern when buzzwords such as predictive analytics and AI are within the realm of reasonableness and when they are not.
Transportation decision making is indeed evolving from instinct and engineering judgment to data-informed, prescriptive, and predictive decisions, resulting in more efficient resource allocation, greater customer responsiveness, and better road safety and reliability. By using the guideposts of performance management and data management and governance, ITS professionals will better choose the data, software, dashboards, and decision support tools that will indeed improve the confidence, accuracy, precision, simplicity, speed, timeliness, and impact of front-line, project, program, and enterprise decisions.
Return to top ↑
Resources
Framework for Managing Data from Emerging Transportation Technologies to Support Decision Making, NCHRP Research Report 952, 2020
Leveraging Big Data to Improve Traffic Incident Management, NCHRP Research Report 904, 2019
Management and Use of Data for Transportation Performance Management: Guide for Practitioners. NCHRP Research Report 920, 2019
Business Intelligence Techniques for Transportation Agency Decision Making. NCHRP 03-128 (Forthcoming)
Use of Vehicle Probe and Cellular GPS Data by State Departments of Transportation, NCHRP 20-05/Topic 51-06 (Forthcoming)
FHWA Traffic Analysis Tools
AASHTO Transportation Management and Operations Guide
Developing and Sustaining a Transportation Systems Management & Operations Mission for Your Organization - A PRIMER FOR PROGRAM PLANNING
Return to top ↑
Notes
1^ Auer, Ashley, Shelley Feese, and Stephen Lockwood. Federal Highway Administration. History of Intelligent Transportation Systems, FHWA-JPO-16-329, Prepared for US DOT ITS Joint Program Office, May 2016.
2^ Day, Christopher M, et al. “Performance Measures for Traffic Signal Systems: an Outcome-Oriented Approach.” Purdue University, 2014.
3^ Federal Highway Administration, , “ATSPM Case Study: Utah Department of Transportation,” Report 18048. Federal Highway Administration, United States Department of Transportation, https://ops.fhwa.dot.gov/publications/fhwahop18048/fhwahop18048.pdf, Washington, DC 2018.
4^ Utah Department of Transportation, Automated Traffic Signal Performance Measures (ATSPM)Frequently Asked Questions, http://udottraffic.utah.gov/ATSPM/FAQs/Display
5^ Federal Highway Administration , “ATSPM Case Study: Utah Department of Transportation,” Report 18048., United States Department of Transportation, https://ops.fhwa.dot.gov/publications/fhwahop18048/fhwahop18048.pdf, Washington, DC 2018.
6^ Effinger, Justin R. “Integration of Crowdsourced Data into Automated Traffic Signal Performance Measures (ATSPMs),” FHWA Adventures in Crowdsourcing Webinars, Prepared for National Operations Center of Excellence, https://transportationops.org/edc5/adventures-crowdsourcing-webinar-series, Feb 27, 2020.
7^ Legare, Ryan, “Business Case for Crowdsourced Data: Lake County Passage: FHWA Adventures in Crowdsourcing Webinars. Prepared for National Operations Center of Excellence,” https://transportationops.org/edc5/adventures-crowdsourcing-webinar-series, Oct 22, 2020.
8^ Effinger, Justin R, “Integration of Crowdsourced Data into Automated Traffic Signal Performance Measures (ATSPMs),” FHWA Adventures in Crowdsourcing Webinars, National Operations Center of Excellence, Feb 27, 2020. https://transportationops.org/edc5/adventures-crowdsourcing-webinar-series.
9^ Federal Highway Administration, “Understanding and Responding to Traffic Impacts from Covid-19 Travel Changes,” FHWA EDC News Weekly Newsletter, https://www.fhwa.dot.gov/innovation/everydaycounts/edcnews/20200326.cfm, FHWA Center for Accelerating Innovation, March 26, 2020.
10^ Reilly, Shalice, “Friction Sensors Help CDOT Save Money and Improve Winter Road Safety [Winter Operations],” Prepared for Colorado Department of Transportation, Office of Process Improvement https://www.codot.gov/business/process-improvement/larger-process-improvement-efforts/friction-sensors., Oct 2, 2018.
11^ Pecheux, Kelley K., Benjamin Pecheux, Grady Carrick, Leveraging Big Data to Improve Traffic Incident Management, NCHRP Research Report 904, 2019.
12^ Klein, Lawrence, Milton Mills, and David Gibson, Traffic Detector Handbook: Third Edition, Volume I, Federal Highway Administration, US Department of Transportation, Washington, DC, 2006. https://www.fhwa.dot.gov/publications/research/operations/its/06108/06108.pdf.
13^ Singer, Jeremiah, et al., “Travel Time on Arterials and Rural Highways: State-of-the-Practice Synthesis on Arterial Data Collection Technology,” FHWA-HOP-13-028, Prepared for the United States Department of Transportation, Washington, DC, Apr 2013.
14^ Federal Highway Administration, Traffic Monitoring Guide, https://www.fhwa.dot.gov/policyinformation/tmguide/, updated 2016.
15^ Texas Department of Transportation, Statewide Traffic Analysis and Reporting System, https://www.txdot.gov/inside-txdot/division/transportation-planning/stars.html.
16^ Caltrans, Performance Measurement System (PeMS) Data Source, https://dot.ca.gov/programs/traffic-operations/mpr/pems-source.
17^ Maryland Department of Transportation Coordinated Highway and Action Response Team, https://chart.maryland.gov/travinfo/speedData.asp.
18^ Caltrans, “Weight-In-Motion Technical Overview,” https://dot.ca.gov/programs/traffic-operations/wim/technical-overview, 2020.
19^ Utah Department of Transportation, Video: “Introduction to Point versus Probe Data (Freway PeMS vs. iPeMS),” https://www.udot.utah.gov/connect/docs/introduction-to-point-versus-probe-data, 2020.
20^ Federal Highway Administration, Weather Data Environment Site. https://wxde.fhwa.dot.gov/?org.apache.catalina.filters.CSRF NONCE=C5CF50331290487A6E9952E9EC 3B1614.
21^ Federal Highway Administration, “2020 Road Weather Management Stakeholder Meeting Summary Report” Sep 2020.
22^ Lee, Ming-Shiun and Dan Nelson, “Utilization of AVL/GPS Technology: Case Studies” Clear Roads Pooled Fund Program, TPF-5(218) http://clearroads.org/wp-content/uploads/dlm uploads/FR CR.16-01 Final.pdf, June 2018.
23^ Pack, Michael. Nikola Ivanov, and Elizabeth Birriel. “Transportation Management Centers Streaming Video Sharing and Distribution.” FHWA-HOP-19-037. Federal Highway Administration, U.S. Department of Transportation, Washington, DC, September 2019.
24^ Marquess, Alvin, Purvi Desai, Glenn Havinoviski, and Cliff Heise. “Safety Service Patrol Priorities and Best Practices.” FHWA-HOP-16-047. Federal Highway Administration, U.S. Department of Transportation, Washington, DC, Apr 2017. https://ops.fhwa.dot.gov/publications/fhwahop16047/fhwahop16047.pdf.
25^ City of Bellevue and Microsoft Corp. “Video Analytics Towards Vision Zero: Case Study Report.” Dec 2019. https://bellevuewa.gov/sites/default/files/media/pdf_document/2020/Video%20Analytics%20Towards%20Vision%20Zero-Traffic%20Video%20Analytics-12262019.pdf.
26^ TrafficVision. “Colorado DOT’s Visionary Investment: TrafficVision Video Analytics.” 2015. http://www.trafficvision.com/case-studies.
27^ Rotenberg, Meta. “ALPR: It Really Does Increase Both Revenue and Efficiency.” Parking Today. Nov 2014. https://www.parkingtoday.com/articledetails.php?id=1743&t=alpr-it-really-does-increase-both-revenue-and-efficiency.
28^ Zmud, Johanna, Jason Wagner, Maarit Moran. “License Plate Reader Technology: Transportation Uses and Privacy Risks.” NCHRP 08-36, Task 136. Nov 2016.
29^ Denney, Richard. “Improving Traffic Signal Management and Operations: A Basic Service Model.” FHWA-HOP-09-055. Federal Highway Administration, U.S. Department of Transportation, Washington, D.C. Dec 2009. https://ops.fhwa.dot.gov/publications/fhwahop09055/fhwa_hop_09_055.pdf.
30^ FHWA EDC Round One Program. “EDC Exchange: Adaptive Signal Control Technology - Managing Risks, Achieving Objectives.” Aug 16, 2012. https://www.fhwa.dot.gov/innovation/everydaycounts/edc_exchange/asct.cfm.
31^ Aleksandar Stevanovic. Adaptive Traffic Control Systems: Domestic and Foreign State of Practice. NCHRP Synthesis 403. 2010.
32^ Fehon, K., Mike Krueger, Jim Peters, Richard Denney, Paul Olson, and Eddie Curtis. “Model Systems Engineering Documents for Adaptive Signal Control Technology Systems - Guidance Document.” FHWA-HOP-11-027. Aug 2012. https://ops.fhwa.dot.gov/publications/fhwahop11027/mse_asct.pdf.
33^ Lattimer, Charles. “Automated Traffic Signals Performance Measures.” FHWA-HOP-20-002. Mar 2020. Federal Highway Administration, U.S. Department of Transportation, Washington, D.C. https://ops.fhwa.dot.gov/publications/fhwahop20002/fhwahop20002.pdf.
34^ Day, C. M., D. M. Bullock, H. Li, S. M. Remias, A. M. Hainen, R. S. Freije, A. L. Stevens, J. R. Sturdevant, and T. M. Brennan. Performance Measures for Traffic Signal Systems: An Outcome-Oriented Approach. Purdue University, West Lafayette, Indiana, 2014. doi: 10.5703/1288284315333.
35^ Curtis, Eddie. FHWA EDC-4 Summit, Advanced Traffic Signal Performance Measures Break Out Session. Fall 2016. Federal Highway Administration, U.S. Department of Transportation, Washington, D.C.https://www.youtube.com/watch?v=7gS2ATBVGtU&ab channel=FederalHighwayAdministrationUSD OTFHWA.
36^ Gotfredson, Shawn. “Signal Performance Metrics: City of Overland Park, Kansas.” FHWA EDC-4 Summit, Advanced Traffic Signal Performance Measures Break Out Session. Fall 2016. https://www.youtube.com/watch?v=7gS2ATBVGtU&ab channel=FederalHighwayAdministrationUSDOTF HWA.
37^ FHWA. Presentation by Jodoin, Paul. “Using Data to Improve Traffic Incident Management.” I-95 Corridor Coalition State Police Computer Aided Dispatch Integration Workshop. Apr 24-24, 2018. https://tetcoalition.org/wp-content/uploads/2018/06/2-I95CC-CAD-Workshop-EDC4-TIM-FHWA-Presentation-Apr2018.pdf
38^ Pecheux, K. K. 2016. Process for Establishing, Implementing, and Institutionalizing a Traffic Incident Management Performance Measurement Program. FHWA-HOP-15-028. Federal Highway Administration, U.S. Department of Transportation, Washington, DC, 2016.
39^ FHWA. Presentation by Colyar, James. “Use of Crowdsourcing to Advance Operations.” FHWA EDC-5 Summit, Crowdsourcing for Operations Break Out Session Webinar Recording. Fall 2018. https://connectdot.connectsolutions.com/pc531wzr25a9/.
40^ FHWA. EDC-5 Crowdsourcing for Operations Frequently Asked Questions. FHWA-HOP-19-036. https://www.fhwa.dot.gov/innovation/everydaycounts/edc_5/docs/crowdsourcing-faq.pdf.
41^ INRIX. “INRIX Launches First Intersection Intelligence Platform Powered Entirely by Vehicle Probe Data.” January 8, 2020. https://inrix.com/press-releases/signal-analytics/.
42^ FHWA EDC-5 Crowdsourcing Vehicle Probe Data Peer Exchange. St. Louis, MO. Mar 12-13, 2020.
43^ HERE. I-95 VPP2 Interface Guide Version 1.0. Jan 2015. https://tetcoalition.org/wp-content/uploads/2015/02/HERE_I-95_Implementation_Guide_1-16-15.pdf.
44^ INRIX. I-95 Vehicle Probe Project II. Interface Guide. Apr 2018. https://tetcoalition.org/wp-content/uploads/2015/02/I-95_VPP_II_Inteface_Guide-March_2018.pdf.
45^ TomTom. TomTom Traffic Flow Bulk Feed - I95 Interface Specification. 2015. https://tetcoalition.org/wp-content/uploads/2015/03/TomTom_Traffic_Flow_Interface_Spec-FOR-WEBSITE.pdf.
46^ FHWA Adventures in Crowdsourcing Webinar: Validating Crowdsourced Data. Aug 25, 2020. https://transportationops.org/ondemand-learning/adventures-crowdsourcing-validating-crowdsourced-data.
47^ FHWA EDC-5 Crowdsourcing Vehicle Probe Data Peer Exchange. St. Louis, MO. Mar 12-13, 2020.
48^ FHWA Operations Performance Measurement. https://ops.fhwa.dot.gov/perf_measurement/.
49^ Goodall, Noah and Eun Lee. Comparison of Waze crash and disabled vehicle records with video ground truth. Virginia Transportation Research Council, Jun 2019.
50^ Franz, Mark. “Waze Integration and Analysis.” RITIS and Probe Data Analytics Suite User Group, July 19, 2018. Webinar Power Point.
51^ FHWA Crowdsourcing for Operations E-News. “Iowa DOT Finds Increasing Value Over Time from Crowdsourced Data.” Sep 14, 2020.
52^ FHWA Crowdsourcing for Operations E-News. “Tennessee Enhances Queue Detection with Crowdsourced Data.” Oct 15, 2020.
53^ McCarthy, Ryan. “PublicStuff, an online app, set for Fairfield.” Daily Republic. March 1, 2015 https://www.dailyrepublic.com/all-dr-news/solano-news/fairfield/publicstuff-an-online-app-set-for-fairfield.
54^ Walker, Alissa. “The App You’ve Never Heard of That’s Making Your City Better.” Gizmodo. Jul 14, 2016.
55^ Robach, Joseph A. “NYS DOT Creates New Mobile App for Travel Info.” The New York State Senate, Transportation. January 25, 2011. https://www.nysenate.gov/newsroom/press-releases/joseph-e-robach/nys-dot-creates-new-mobile-app-travel-info.
56^ Colorado DOT. “CDOT Releases Free Smartphone Application to Improve Travel Experience.” September 21, 2012. https://www.codot.gov/news/2012-news-releases/09-2012/cdot-releases-free-smartphone-application-to-improve-travel-experience.
57^ Bramble, Tracey, Sinclair Stolle, “Iowa Department of Transportation Social Media for Operations.” FHWA Adventures in Crowdsourcing Webinars on behalf of National Operations Center of Excellence. https://transportationops.org/ondemand-learning/adventures-crowdsourcing-social-media-improved-operations-edc5-webinar-series, May 20, 2020.
58^ Bramble, Tracey and Sinclair Stolle, “Iowa Department of Transportation Social Media for Operations.” FHWA Adventures in Crowdsourcing Webinars on behalf of National Operations Center of Excellence. https://transportationops.org/ondemand-learning/adventures-crowdsourcing-social-media-improved-operations-edc5-webinar-series, May 20, 2020.
59^ Fu, Kaiqun, Rakesh Nune, and Jason Tao, “Social Media Data Analysis for Traffic Incident Detection and Management.” Transportation Research Board 94th Annual Meeting, Paper Numbers: 15-4022, insert date here.
60^ Dabiri, Sina and Kevin Heaslip, “Twitter-based traffic information system based on vector representations for words,” arXiv preprint arXiv:1812.01199.
61^ Gu, Yiming, Zhen Qian, and Feng Chen, “From Twitter to detector: Real-time traffic incident detection using social media data.” Transportation Research Part C: Emerging Technologies, Volume 67, Pages 321-342, ISSN 0968-090X, https://www.sciencedirect.com/science/article/abs/pii/S0968090X16000644?via%3Dihub, 2016.
62^ Quian, Zhen, “Real-time Incident Detection Using Social Media Data,” on behalf of Pennsylvania Department of Transportation, FHWA-PA-2016-004-CMU WO 03, May 9, 2016.
63^ Pecheux, Kelley K., Benjamin Pecheux, Grady Carrick, “Leveraging Big Data to Improve Traffic Incident Management.” NCHRP Research Report 904, 2019.
64^ Pecheux, Kelley K., Benjamin Pecheux, Grady Carrick, “Leveraging Big Data to Improve Traffic Incident Management.” NCHRP Research Report 904, 2019.
65^ I-95 Corridor Coalition, “CJIS Considerations for CAD Integration, 2018,” https://tetcoalition.org/wp-content/uploads/2018/06/I95_CJIS-Considerations-for-CAD-Integration.pdf?x70560, accessed October 2020.
66^ CAD and TMS Integration Workshop: Summary Report, on behalf of I-95 Corridor Coalition, Workshop Proceedings, https://tetcoalition.org/wp-content/uploads/2018/06/I95CC_CAD_Workshop_Summary_Report-Final-04_23-24_2018.pdf?x70560, April 2018.
67^ Federal Highway Administration, FHWA Every Day Counts, Weather-Responsive Management Strategies (WRMS) for Flood Management in Iowa, Missouri, and Nebraska, FHWA-HOP-20-050, October 2020.
68^ Federal Highway Administration, Connected Vehicle Pilot Deployment Program Overview, https://www.its.dot.gov/pilots/index.htm, last updated 2018.
69^ Gartner, “Gartner Says By 2020, a Quarter Billion Connected Vehicles Will Enable New In-Vehicle Services and Automated Driving Capabilities,” https://www.gartner.com/en/newsroom/press-releases/2015-01-26-gartner-says-by-2020-a-quarter-billion-connected-vehicles-will-enable-new-in-vehicle-services-and-automated-driving-capabilities, January 26, 2015.
70^ Strategy& PwC, “Digital Auto Report 2017: Exponential growth in new mobility services,” https://www.strategyand.pwc.com/gx/en/about/media/press-releases/digital-auto-report17.html, September 11, 2017.
71^ Otonomo, https://otonomo.io/data/, accessed November 15, 2020.
72^ Wejo, “Optimizing Traffic Signal Performance to Enhance Safety and Reduce Infrastructure Cost,” https://www.youtube.com/watch?v=3zZx6Uoj7Hw&feature=youtu.be&ab channel=wejo, Dec 11, 2020.
73^ Juliussen, Egil,. “Connected Cars: Let Me Count the Ways,” EE Times, https://www.eetimes.com/connected-cars-let-me-count-the-ways/, July 29, 2020.
74^ iCone, https://www.iconeproducts.com/live-traffic-data, accessed November 15, 2020.
75^ Mollenhauer, Michael, Elizabeth White, Nazila Roofigari-Esfahan, “Design and Evaluation of a Connected Work Zone Hazard Detection and Communication System for Connected and Automated Vehicles (CAVs),” Report 03-050, 2021.
76^ Walsh, Mike and Bill Bader, MakeWay Emergency Vehicle Alert System, https://www.trafficconf.com/files/2021/06/Make-Way-Emergency-Vehicle-Alert-System.pdf, 2019.
77^ HAAS Alert, https://www.haasalert.com/.
78^ Fitzpatrick, Cole, et al., “The Application of Unmanned Aerial Systems In Surface Transportation -Volume II- C: Evaluation of UAS Highway Speed-Sensing Application,” Report 19-010, https://rosap.ntl.bts.gov/view/dot/49140, December 2019.
79^ Federal Highway Administration, EDC-6 Virtual Summit, “Next Generation TIM: Integrating Technology, Data, and Training,” https://www.labroots.com/ms/virtual-event/fhwa-everyday-counts-6-virtual-summit#terms-popup, December 10, 2020.
80^ Quinton, Drew and Terrance Regan, “Use of Unmanned Aerial Systems (UAS) by State DOTs,” Peer Exchange, FHWA-HIF-18-060, https://www.fhwa.dot.gov/uas/peer/2018peer.pdf, February 2018.
81^ National Conference of State Legislatures, “Current Unmanned Aircraft State Law Landscape,” https://www.ncsl.org/research/transportation/current-unmanned-aircraft-state-law-landscape.aspx#1, April 1, 2020.
82^ OptaSense, “OptaSense Traffic Monitoring Solution Deployed In Atlanta,” https://optasense.com/case-study-optasense-traffic-monitoring-solution-deployed-on-interstate-20-atlanta/, 2020.
83^ Chicago Metropolitan Agency for Planning, “New Data Allows an Initial Look At Ride Hailing In Chicago,”. https://www.cmap.illinois.gov/updates/all/-/asset publisher/UIMfSLnFfMB6/content/new-data-allows-an-initial-look-at-ride-hailing-in-chicago, May 4, 2019.
84^ Cambridge Systematics and High Street Consulting Group, Transportation Performance Management: Insight from Practitioners, NCHRP Report 660, 2010.
85^ Federal Highway Administration, FHWA Transportation Performance Measures Guidebook, Federal Highway Administration, U.S. Department of Transportation, Washington, DC, 2020. https://www.tpmtools.org/guidebook/.
86^ Federal Highway Administration, Transportation Performance Measures Toolbox, https://www.tpmtools.org/. 2020.
87^ Federal Highway Administration, Transportation Performance Management Guidance, https://www.fhwa.dot.gov/tpm/guidance/.
88^ Federal Highway Administration, “Moving Ahead for Progress in the 21st Century Act (MAP-21), A Summary of Highway Provisions,” https://www.fhwa.dot.gov/map21/docs/map21_summary_hgwy_provisions.pdf., July 17, 2012.
89^ Federal Highway Administration, “Fixing America’s Surface Transportation Act (FAST Act), A Summary of Highway Provisions,”. https://www.fhwa.dot.gov/fastact/fastact_summary.pdf, July 2016.
90^ Federal Highway Administration, “National Performance Management Measures; Assessing Performance of the National Highway System, Freight Movement on the Interstate System, and Congestion Mitigation and Air Quality Improvement Program, A Rule by the FHWA,” Federal Register, https://www.govinfo.gov/content/pkg/FR-2017-01-18/pdf/2017-00681.pdf, January 18, 2017.
91^ Federal Highway Administration , “Performance Measures & Asset Management Plan - Key Implementation Dates,” https://www.fhwa.dot.gov/tpm/rule/timeline.pdf, May 31, 2018.
92^ John MacAdam, “Measuring ODOT’s TSMO Performance,” I-95 Corridor Coalition Webinar-Building TSMO Performance Measures, Aug 30, 2018.
93^ Shah, Vaishali, et al., , “The Road to High-Value BI Opportunities: Bringing together the Decision Maker, Data, Analytics, and the Kitchen Sink,” Conference on Performance and Data in Transportation Decision Making, Sep 15-18, 2019.
94^ Grassi, Giulio, Kyle Jamieson, Giovanni Pau, “ParkMaster: An in-vehicle, edge-based video analytics service for detecting open parking spaces in urban environments,” https://www.microsoft.com/en-us/research/wp-content/uploads/2017/08/Bahl-SEC-2017-1.pdf, 2017.
95^ Shah, Vaishali, et al., “The Road to High-Value BI Opportunities: Bringing together the Decision Maker, Data, Analytics, and the Kitchen Sink,” Conference on Performance and Data in Transportation Decision Making, Sep 15-18, 2019.
96^ Pechuex, K., B. Pecheux, and G. Carrick, “Leveraging Big Data to Improve Traffic Incident Management,” NCHRP Research Report 904, 2019.
97^ Bathaee, N., et al., “A cluster analysis approach for differentiating transportation modes using Bluetooth sensor data,” Journal of Intelligent Transportation Systems. Issue 4, Volume 22, 2018.
98^ Pechuex, K., B. Pecheux, and G. Carrick, “Leveraging Big Data to Improve Traffic Incident Management,” NCHRP Research Report 904, 2019.
99^ Mishra, S., et al., “A tool for measuring and visualizing connectivity of transit stop, route and transfer center in a multimodal transportation network,” Public Transp 7, 77-99, https://link.springer.com/article/10.1007/s12469-014-0091-2, (2015).
100^ Federal Highway Administration, Presentation Management, “I-95 Corridor Coalition State Police Computer Aided Dispatch Integration Workshop,” April0 24, 2018.
101^ Shah, Vaishali, et al., “The Road to High-Value BI Opportunities: Bringing together the Decision Maker, Data, Analytics, and the Kitchen Sink,” Conference on Performance and Data in Transportation Decision Making, Sep 15-18, 2019.
102^ Irina Ivanova, “Why face-recognition technology has a bias problem,” CBS News, https://www.cbsnews.com/news/facial-recognition-systems-racism-protests-police-bias/, June 12, 2020.
103^ Mysla, Vlad, “Machine Learning in 10 minutes,” Data Driven Investor, Apr 13, 2020.
104^ Redman, Thomas, “Bad Data Costs the U.S. $3 Trillion Per Year,” Harvard Business Review, https://hbr.org/2016/09/bad-data-costs-the-u-s-3-trillion-per-year, September 22, 2016.
105^ USDOT Research and Innovative Technology Administration, “ASTM E2468-05 - Standard Practice for Metadata to Support Archived Data Management Systems,” https://www.standards.its.dot.gov/Factsheets/PrintFactsheet/73, March 22, 2006.
106^ Pechuex, K., B. Pecheux, and G. Carrick, “Leveraging Big Data to Improve Traffic Incident Management,” NCHRP Research Report 904, 2019.
107^ Data Governance Institute, “Universal Data Governance Principles,” http://datagovernance.com/goals-and-principles-for-data-governance/
108^ Pecheux, Kelley Klaver, et al., “Guidebook for Managing Data from Emerging Technologies for Transportation,” NCHRP Research Report 952, 2020.
109^ Pecheux, Kelley Klaver, et al., “Guidebook for Managing Data from Emerging Technologies for Transportation,” NCHRP Research Report 952, 2020.
110^ Pecheux, Kelley Klaver, et al., “Guidebook for Managing Data from Emerging Technologies for Transportation,” NCHRP Research Report 952, 2020.
111^ Forthcoming. Shah, V., B. Pechuex, P. Noyes, and E. Robinson, “Business Intelligence Techniques for Transportation Agency Decision-Making,” NCHRP 03-128, 2020.
112^ Ohio Department of Transportation, Transportation Asset Management Plan, https://www.transportation.ohio.gov/wps/portal/gov/odot/programs/asset-management/resources/asset-management-plan, May 2016.
113^ Hale, Stephen, “Better Data for Better Decisions.” TRB Webinar on Current and Evolving Practices in Asset Management for Highway Agencies, https://onlinepubs.trb.org/onlinepubs/webinars/180807.pdf, 2018.
114^ Green, Michael, and Anthony Lucivero, Data Governance & Data Management Case Studies of Select Transportation Agencies, on behalf of the US DOT Federal Highway Administration. https://www.gis.fhwa.dot.gov/documents/GIS_Data_Governance_and_Data_Management_Case_Studies.pdf, 2018.
115^ Kidner, Ian, Applications of Geospatial Technologies in Transportation: Data Integration through Data Governance. US DOT FHWA: GIS in Transportation Webcast 35, https://www.gis.fhwa.dot.gov/webcast35_Data_Integration_through_Data_Governance.asp#figure4 - content is no longer available, 2018.
116^ Williams, A., and I. Kinder, “Using BI and Analytics to Manage Transportation Assets,” on behalf of Ohio DOT, https://www.otec.transportation.ohio.gov/static/presentations/2018/Williams_61C.pdf, 2017.
117^ Kentucky Transportation Cabinet, Presentation by Lambert, Chris, FHWA EDC-5 Crowdsourcing for Operations, “Peer Exchange on Validating, Filtering, and Using Free Crowdsourced Data,” Nashville, Tennessee, Dec 10-11, 2019.
118^ Interview with Kentucky Transportation Cabinet’s Big Data Environment Developer, 2019.
119^ Edward D. Cox, “Indiana DOT Crowdsourcing Business Case,” National Operations Center of Excellence,- FHWA Adventures in Crowdsourcing Webinar Series, https://transportationops.org/ondemand-learning/adventures-crowdsourcing-business-case-crowdsourced-data, October 22, 2020.
120^ Day, Christopher M., et al., \ “2015 Indiana Mobility Report and Performance Measure Dashboard,” Purdue University, West Lafayette, Indiana, 2016.
121^ Katz, Bryan, et al., “Synthesis of Variable Speed Limit Signs,” FHWA-HOP-17-003, May 2017.
122^ Federal Highway Administration, Every Day Counts Round Four, Using Data to Improve TIM, Regional Peer Exchange, Baltimore, Maryland, December 4, 2018.
123^ Virginia Department of Transportation, “VDOT’S I-81 Operational Improvements Receive National Recognition for Operations Excellence,” https://www.virginiadot.org/newsroom/statewide/2020/vdots-i-81-operational-improvements-receive-national-recognition-for-operations-excellence9-10-2020.asp, September 10, 2020.
124^ Virginia Department of Transportation, “I-81 Corridor Improvement Plan Executive Summary.” https://drive.google.com/file/d/1BqltKAfjaprmwYkxm4bS_5P7Y5_UHacK/view, December 3, 2018.
125^ Christopher (John) Parker, Pennsylvania Turnpike, “What Else is Up Our Crowdsourcing Sleeve,” Presented at the FHWA EDC-6 Virtual Summit, Crowdsourcing for Advancing Operations Live Exhibit Hall, December 9, 2020.
126^ Lee, Ming-Shiun and Dan Nelson, “Utilization of AVL/GPS Technology: Case Studies,” Clear Roads Pooled Fund Study, Report No. CR 16-01, Jun 2018.
127^ Port Authority of New York and New Jersey, “Partnerships Transforming Communication and TSMO at The Port Authority Of New York And New Jersey,” on behalf of the National Operations Center of Excellence, https://www.transportationops.org/case-studies/partnerships-transforming-communication-and-tsmo, March 21, 2019.
128^ Edward D. Cox, FHWA EDC-5 Crowdsourcing for Operations, “Vehicle Probe Peer Exchange,” St. Louis, Missouri, March 12-13, 2020.
129^ Marik, Stephanie and William Welch, FHWA EDC-5 Crowdsourcing for Operations, “Virtual Vehicle Probe Peer Exchange,” September 24, 2020.
130^ Ohio Department of Transportation, “Lake 90 Variable Speed Limit Corridor,” National Operations Center of Excellence Case Study, https://www.transportationops.org/case-studies/lake-90-variable-speed-limit-corridor, May 20, 2020.
Return to top ↑